Fig. 11
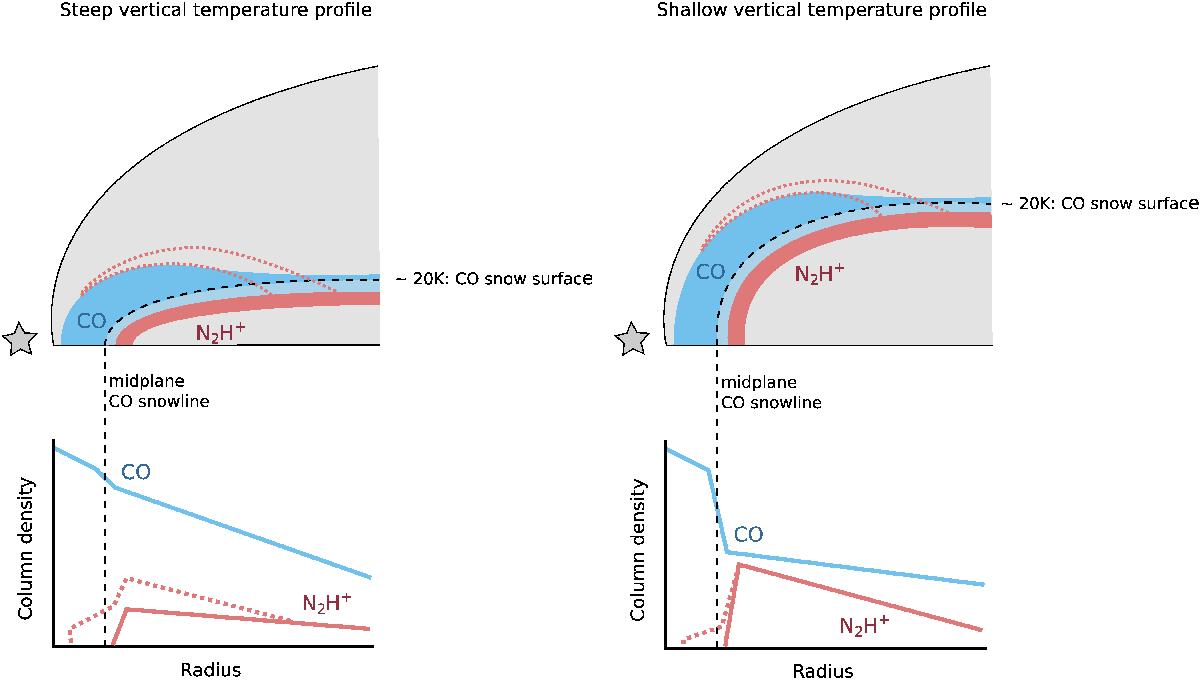
Schematic representation of the distribution of gas-phase CO (blue) and N2H+ (red) in disks with either a steep vertical temperature profile, as for TW Hya (left), or a shallow vertical temperature profile (right). These differences can be due to different degrees of grain settling. To highlight the region around the CO snowline, the vertical direction depicts scale height, z/r. The dashed black contour represents the CO snow surface and the light blue area directly outside this contour shows that, at the snow surface, the gas phase abundance drops by 50%. The N2H+ surface layer is indicated by dotted red lines. The predicted column density profiles are shown below. For N2H+, the column density profile is shown with (dotted line) and without (solid line) the surface layer. The vertical dashed black line indicates the location of the midplane CO snowline.
Current usage metrics show cumulative count of Article Views (full-text article views including HTML views, PDF and ePub downloads, according to the available data) and Abstracts Views on Vision4Press platform.
Data correspond to usage on the plateform after 2015. The current usage metrics is available 48-96 hours after online publication and is updated daily on week days.
Initial download of the metrics may take a while.