Fig. D.1
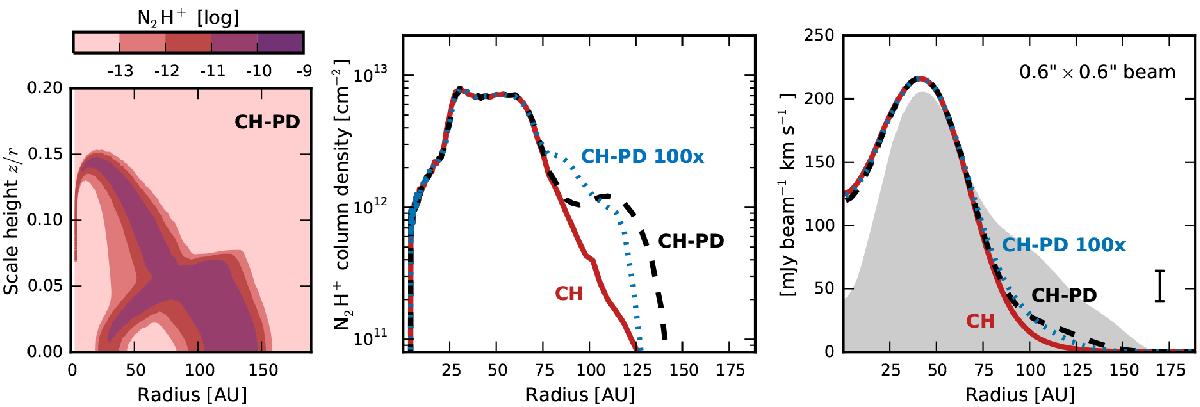
N2H+ distribution (left panel), column density (middle panel) and radial J = 4−3 integrated line intensity profile (right panel) when photodesorption is included in the chemistry (model CH-PD with CO and N2 abundances of 3 × 10⁻⁶; dashed black lines). The dotted blue lines show a model with photodesorption rates increased by a factor 100 (model CH-PD 100x), and the red solid lines show the fiducial model without photodesorption (model CH). The simulated emission is convolved with a ![]() beam. Observations by Q13 are shown in gray in the right panel with the 3σ-error depicted in the lower right corner.
beam. Observations by Q13 are shown in gray in the right panel with the 3σ-error depicted in the lower right corner.
Current usage metrics show cumulative count of Article Views (full-text article views including HTML views, PDF and ePub downloads, according to the available data) and Abstracts Views on Vision4Press platform.
Data correspond to usage on the plateform after 2015. The current usage metrics is available 48-96 hours after online publication and is updated daily on week days.
Initial download of the metrics may take a while.