Fig. 3
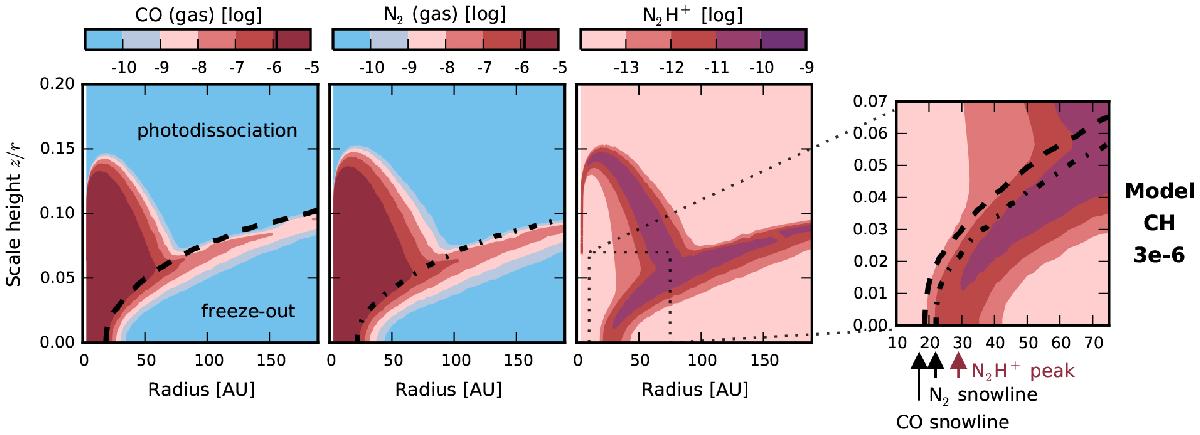
Distributions of CO gas, N2 gas and N2H+ in the simple chemical model (model CH) with CO and N2 abundances of 3 × 10⁻⁶. To focus on the region around the CO snow surface, the vertical scale is limited to a scale height z/r ≤ 0.2. The rightmost panel highlights the region where N2H+ is present near the disk midplane. The dashed and dash-dotted contours represent the CO and N2 snow surfaces, respectively, and the corresponding midplane snowlines are indicated by arrows below the horizontal axis of the rightmost panel. The midplane radius with the highest N2H+ abundance is marked with a red arrow.
Current usage metrics show cumulative count of Article Views (full-text article views including HTML views, PDF and ePub downloads, according to the available data) and Abstracts Views on Vision4Press platform.
Data correspond to usage on the plateform after 2015. The current usage metrics is available 48-96 hours after online publication and is updated daily on week days.
Initial download of the metrics may take a while.