| Issue |
A&A
Volume 543, July 2012
|
|
|---|---|---|
| Article Number | A152 | |
| Number of page(s) | 18 | |
| Section | Interstellar and circumstellar matter | |
| DOI | https://doi.org/10.1051/0004-6361/201118310 | |
| Published online | 13 July 2012 | |
Deuterated methanol in Orion BN/KL⋆,⋆⋆
1 Univ. Bordeaux, LAB, UMR 5804, 33270 Floirac, France
e-mail: This email address is being protected from spambots. You need JavaScript enabled to view it.
2 CNRS, LAB, UMR 5804, 33270 Floirac, France
3 Max-Planck-Institut für Radioastronomie (MPIfR), Auf dem Hügel 69, 53121 Bonn, Germany
Received: 21 October 2011
Accepted: 30 May 2012
Abstract
Aims. Deuterated molecules have been detected and studied toward Orion BN/KL in the past decades, mostly with single-dish telescopes. However, high angular resolution data are critical not only for interpreting the spatial distribution of the deuteration ratio but also for understanding this complex region in terms of cloud evolution involving star-forming activities and stellar feedbacks. Therefore, it is important to investigate the deuterated ratio of methanol, one of the most abundant grain-surface species, on a scale of a few arcseconds to better understand the physical conditions related to deuteration in Orion BN/KL.
Methods. Orion BN/KL was extensively observed with the IRAM Plateau de Bure Interferometer from 1999 to 2007 in the 1 to 3 mm range. The angular resolution varies from 1.″8×0.″8 to 3.″6×2.″3 and the spectral resolution varies from 0.4 to 1.9 km s-1. Deuterated methanol CH2DOH and CH3OD and CH3OH lines were searched for within our 3 mm and 1.3 mm data sets.
Results. We present here the first high angular resolution (1.″8×0.″8) images of deuterated methanol CH2DOH in Orion BN/KL. Six CH2DOH lines were detected around 105.8, 223.5, and 225.9 GHz. In addition, three E-type methanol lines around 101–102 GHz were detected and were used to derive the corresponding CH3OH rotational temperatures and column densities toward different regions across Orion BN/KL. The strongest CH2DOH and CH3OH emissions come from the Hot Core southwest region with a velocity that is typical of the Compact Ridge (VLSR ≈ 8 km s-1). We derive [CH2DOH]/[CH3OH] abundance ratios of 0.8–1.3 × 10⁻³ toward three CH2DOH emission peaks. A new transition of CH3OD was detected at 226.2 GHz for the first time in the interstellar medium. Its distribution is similar to that of CH2DOH. Besides, we find that the [CH2DOH]/[CH3OD] abundance ratios are lower than unity in the central part of BN/KL. Furthermore, the HDO 31,2−22,1 line at 225.9 GHz was detected and its emission distribution shows a shift of a few arcseconds with respect to the deuterated methanol emission that likely results from different excitation effects. The deuteration ratios derived along Orion BN/KL are not markedly different from one clump to another. However, various processes such as slow heating due to ongoing star formation, heating by luminous infrared sources, or heating by shocks could be competing to explain some local differences observed for these ratios.
Key words: ISM: clouds / ISM: molecules / astrochemistry / ISM: general
Based on observations carried out with the IRAM Plateau de Bure Interferometer. IRAM is supported by INSU/CNRS (France), MPG (Germany), and IGN (Spain).
Appendices are available in electronic form at http://www.aanda.org
© ESO, 2012
1. Introduction
Observational parameters of the PdBI data sets.
Deuterium chemistry in the interstellar medium (ISM) has been intensively studied in recent decades. More and more deuterated molecules have been found as well as multiply-deuterated species, e.g., ND3 (van der Tak et al. 2002; Lis et al. 2002) and CD3OH (Parise et al. 2004). Deuterium chemistry models have also been revised to explain the observations that show a strong enhancement of deuterium-bearing molecule abundances in star-forming regions (e.g., Roberts et al. 2003; Roberts & Millar 2000; Charnley et al. 1997), compared with the D/H ratio of 2–3 × 10⁻⁵ in the local interstellar gas (see, e.g., Linsky et al. 2006, and references therein). Those strong enhancements (by a factor of a few thousand) are seen mostly in methanol, ammonia, water, and formaldehyde, leading to the abundance ratios > 0.1 compared with their non-deuterated analogs. The formation of these molecules can be largely explained by grain-surface reactions that provide a natural explanation for the abundant doubly or multiply deuterated molecules that ion-molecule chemistry failed to predict (Turner 1990).
Many deuterated molecules were first detected toward the Orion Becklin-Neugebauer/Kleinmann-Low (BN/KL) region (Becklin & Neugebauer 1967; Kleinmann & Low 1967), one of the closest (414 ± 7 pc, Menten et al. 2007) and most-studied star-forming regions in the sky. For example, deuterated water HDO and deuterated ammonia NH2D were first detected by Turner et al. (1975) and Rodriguez Kuiper et al. (1978), and the single-deuterated methanol molecules CH3OD and CH2DOH were first detected toward the same region by Mauersberger et al. (1988) and Jacq et al. (1993), respectively. Although grain-surface chemical models can well explain the high abundance of those deuterated molecules in molecular clouds, the deuteration branching ratios in the same species predicted by models disagree with observations. For instance, Charnley et al. (1997) showed that the formation of deuterated methanol on grains based on the addition of H and D atoms to CO always leads to [CH2DOH]/[CH3OD] abundance ratios of about 3. This prediction is in conflict with the [CH2DOH]/[CH3OD] ratio of 1.1–1.5 observed by Jacq et al. (1993) in Orion BN/KL. However, Rodgers & Charnley (2002) later pointed out that without taking into account other surface species such as CO and H2CO and possibly different energy barriers involved in the reaction scheme, the [CH2DOH]/[CH3OD] ratio of 3 is an artificial result of the model assumptions. In addition, most proposed models that include surface chemistry strongly depend on local environment where temperature and gas density play important roles in the chemical reaction rates. This is especially true for the Orion BN/KL region where contributions from stellar feedbacks (e.g., ultraviolet photons) and star formation activities (e.g., outflows/shocks) alter the warm-up history of the cloud, involving both grain surface and gas-phase chemistry. Hence, it is crucial to investigate the BN/KL deuterated methanol distribution with high spatial resolutions so that the physical conditions of individual clumps are properly constrained and the deuteration ratios can be related to specific physical processes. Additionally, deeper insight into the processes at play can be gained by comparing CH2DOH maps with another major deuterated species, HDO.
The massive star-forming region Orion BN/KL is complicated not only because of the interactions between outflows and the ambient material, but also because of its rich and complex chemistry at the so-called Orion Hot Core and Compact Ridge regions (see, e.g., Blake et al. 1987). Owing to larger single-dish beam sizes in the early spectral line studies of Orion BN/KL, molecular line profiles were usually decomposed into several components according to their local standard of rest (LSR) velocities and line widths. The Orion hot molecular core (Hot Core) is usually characterized by its velocity component at VLSR = 5–6 km s-1 and a broad line width of about 5–10 km s-1. It has been identified in the interferometric maps as a strong mm/submm continuum emission peak close to the infrared (IR) source IRc2 (see, e.g., Gezari et al. 1998; Downes et al. 1981; Rieke et al. 1973), whereas many molecular emission peaks observed around 8 km s-1 are displaced from the Hot Core by about 4′′ to the southwest (Hot Core Southwest, HC-SW; see, e.g., works of Favre et al. 2011; Wang et al. 2010; Tang et al. 2010; Friedel & Snyder 2008, and references therein).
The 8–9 km s-1 LSR velocity component of the Orion Compact Ridge exhibits a relatively narrow line width (3–5 km s-1). The exact location of the Orion Compact Ridge is somewhat ambiguous, but recent interferometric observations (e.g., Favre et al. 2011; Friedel & Snyder 2008) suggest that it is located 10′′–15′′ to the southwest of the Hot Core (the strongest dust continuum peak). It is important to mention that the Orion Hot Core is located within the NE-SW dense ridge of the BN/KL region seen in dust continuum emission (Favre et al. 2011; Tang et al. 2010), and is part of the hierarchical filamentary structure seen on a larger scale in OMC-1 (e.g., mid-J CO images by Peng et al. 2012). Additionally, the Orion Compact Ridge is located at the southern part of this dense ridge, the bottom part of the V-shaped region seen in many molecular lines, e.g., CS (Chandler & Wood 1997), SO (Wright et al. 1996), HCOOCH3 (Favre et al. 2011), and NH3 (Goddi et al. 2011).
The main goal of this paper is to investigate the deuteration ratios in Orion BN/KL, and address the possible causes for the abundant deuterated methanol in this region. We present the first high angular resolution ( ) images of CH2DOH toward the Orion BN/KL region (Sect. 3.1). CH3OH maps were also obtained from the same data sets with a
  resolution (Sect. 3.2). The CH3OD map and HDO result are shown in Sects. 3.3 and 3.4, respectively. We discuss methanol deuteration in Sect. 4.1 for CH2DOH and Sect. 4.2 for CH3OD. In Sect. 4.3, our own CH3OH data are discussed in the light of the spectral line profiles obtained at much higher frequencies with Herschel. Comparison of our deuterated methanol and methanol maps with our deuterated water maps is presented in Sect. 4.4, and water and methanol deuteration ratios are discussed in Sect. 4.5.
2. Observations and spectroscopy
2.1. IRAM observations
The data used in this study are part of the large 1–3 mm data sets obtained from 1999 to 2007 using PdBI1 toward the Orion BN/KL region (see Favre et al. 2011, for more observational details). Four data sets (Table 1) and five antennas equipped with two SIS receivers were used in this study. The quasars 0458–020, 0528+134, 0605–085, and 0607–157, and the BL Lac source 0420–014 were observed for phase and amplitude calibration. The six units of the correlator allowed us to achieve different bandwidths and spectral resolutions. Using the 30 m single-dish data (Cernicharo, priv. comm.), the missing flux for the CH2DOH lines around 223 GHz is estimated to be 20–50%. The large uncertainty in this estimate is due to line confusion and the difficulty in determining spectral baselines in the 30 m data. The missing flux in our CH3OH line interferometric observations around 101 GHz is estimated to be ≲ 6%. As for the HDO, CH2DOH, and CH3OD data at 226 GHz, we compared our PdBI HDO line emission at 225 896.7 MHz with the 30 m data of Jacq et al. (1990), and we find that the missing flux for this HDO line is about 23% toward IRc2. Since the CH2DOH and CH3OD emissions are less extended than the HDO emission, the missing fluxes of CH2DOH and CH3OD are likely less than 23% at 226 GHz.
The PdBI data were reduced with the GILDAS2 package, and the continuum emission was subtracted by selecting line-free channels. Our continuum emission images were presented in Favre et al. (2011) where the H2 column densities of selected clumps were also estimated. The data cube was then cleaned channel-by-channel with the Clark algorithm (Clark 1980) implemented in the GILDAS package.
2.2. CH2DOH spectroscopy
Spectroscopic parameters of the detected lines.
CH2DOH is an asymmetric top molecule similar to CH3OH where one H atom is replaced by a D atom in the methyl group ( − CH3). Therefore, the threefold symmetry (C3V) of the methyl group in the internal rotation of CH3OH is broken, and the CH3OH symmetry states A, E1, and E2 become e0, e1, and o1 in CH2DOH, which are more difficult to deal with theoretically and experimentally (see, e.g., Lauvergnat et al. 2009; Mukhopadhyay et al. 2002), leading to only few published studies of accurate line frequency measurements to date. The CH2DOH substate symmetry can be characterized as even (e) or odd (o) according to the plane of symmetry defined by the DCO or COH plane. For example, the minimum potential energy for CH2DOH occurs in the “trans” substate where the D atom is opposite to OH, and the secondary minimum occurs at the “gauche” positions where the D atom is located at − 120 degrees from the “trans” position (Mukhopadhyay et al. 2002). Therefore, the ground torsional states of CH2DOH contain three substates, e0 (“trans”), e1 (symmetric “gauche”), and o1 (antisymmetric “gauche”) with an increasing energy, similar to ethanol (see, e.g., Pearson et al. 1997; Mukhopadhyay et al. 2002). The selection rules for the same symmetry states (e.g., e0 − e0) allow a- and b-type transitions, and c-type transitions are allowed for involving different symmetry states (e.g., o1 − e1) in CH2DOH. The CH2DOH molecular parameters are listed in Table 2. The CH2DOH molecular parameters were provided by one of us (Parise, see Appendix A), and the CH3OH molecular parameters were taken from the JPL database3 (see calculations of Xu et al. 2008).
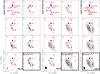 |
Fig. 1 Left: channel maps of the CH2DOH 52,4 − 42,3 (Eup/k = 95.2 K) emission at 223 422.3 MHz for a synthesized beam of |
3. Results
3.1. CH2DOH
Six CH2DOH lines have been detected toward Orion BN/KL, and three of them are slightly blended with other molecular lines. Four CH2DOH lines are a-type (ΔKa = 0 and ΔKc = 1) R-branch (ΔJ = 1) transitions with one b-type (ΔKa = 1 and ΔKc = 1) Q-branch (ΔJ = 0) transition and one b-type R-branch transition. The CH2DOH line parameter measurements toward Orion BN/KL are summarized in the appendix (Table B.1).
Emission peaks:
The CH2DOH emission is mostly present in the southern part of the Orion BN/KL region, or the Compact Ridge region with a characteristic VLSR of ≈ 8 km s-1. For example, the CH2DOH velocity channel maps in Figs. 1 and B.1 show one strong peak (deuterated methanol 1, dM-1) and two weaker peaks (dM-2 and dM-3) in the 7–9 km s-1 velocity range.
There is no clear CH2DOH detection at the Orion Hot Core itself (the strong dust continuum peak), except for the weak emission close to the source I position (Menten & Reid 1995; Garay et al. 1987) shown in the CH2DOH 52,4 − 42,3 e0 line (see Fig. 1, VLSR = 5–7 km s-1). Since the feature associated with source I is only seen in our strongest CH2DOH line, it is not clear if the signal-to-noise ratio (S/N) is too low to detect this feature in other transitions, or if this feature is simply caused by contamination of other molecular lines from the region close to the Hot Core. Nevertheless, there is no indication of other molecular lines at this frequency.
The CH2DOH spectra toward the three main peaks are shown in the appendix (Fig. B.2). The average VLSR measured at the peak emission channel is 7.7 ± 0.4 km s-1 for dM-1, 7.8 ± 0.4 km s-1 for dM-2, and 7.8 ± 0.4 km s-1 for dM-3. The FWHM line widths estimated by fitting a Gaussian profile are 2.1 ± 1.2 km s-1 and 2.3 ± 0.9 km s-1 for dM-1 and dM-2, respectively. The weak dM-3 source exhibits a line width of approximately 3.7 ± 0.5 km s-1, which is broader than the dM-1 and dM-2 line widths; this is likely because of the blending of two or more velocity components (see below).
Additionally, dM-1 has a counterpart in the methyl formate emission (MF-2) observed by Favre et al. (2011), and dM-2 and dM-3 are nearly coinciding with MF-3 and MF-1, respectively. It should be noted that MF-1, the strongest methyl formate emission peak in Orion BN/KL (Favre et al. 2011), shows weak CH2DOH emission in our data (dM-3). As shown by Favre et al. (2011), MF-1 exhibits two velocity components at 7.5 km s-1 and 9.2 km s-1, and these two components are only seen in the 225 878.3 MHz CH2DOH line toward dM-3 where our spectral resolution is higher (0.42 km s-1). Furthermore, dM-2 and dM-3 are close to the CH3OH emission peak in the SMA CH3OH and 13CH3OH images ( , Eup/k = 110 − 730 K) obtained by Beuther et al. (2005) around 337 GHz. It is interesting to note that dM-2 is close to the 25 GHz and 95 GHz CH3OH maser emission peaks reported by Matsakis et al. (1980) and Plambeck & Wright (1988), respectively.
Derived column density and temperature for CH2DOH and CH3OH.
Population diagrams:
We use population diagrams to estimate the column density of CH2DOH (e.g., Goldsmith & Langer 1999; Turner 1991) 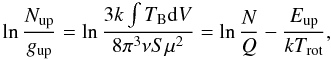 (1)where N is the total column density, Trot the rotational temperature, S the line strength, and μ the dipole moment (μx = 1.44 D and μz = 0.89 D, Ivash & Dennison 1953). In this work, the partition function Q is calculated according to our approximation Q = 2.25 T1.5. We used the four CH2DOH lines at 223 GHz (e0 state) observed with the same spatial resolution in this population diagram analysis. Because our data points fall in a narrow energy range, the population diagrams give a temperature of about 100 K with a very large uncertainty. Hence, the rotational temperatures were assumed and taken from the work of Favre et al. (2011) to reduce the statistical error. We assumed here that both CH3OH and HCOOCH3 trace the same gas because both lines show the same emission peaks, VLSR, and ΔV. Figure B.3 shows the least-squares fit result where we assumed that the rotational temperatures according to the HCOOCH3 excitation temperatures are 130 K for dM-1 and 85 K for dM-2 as derived by Favre et al. (2011) with the same spatial resolution (
 ×
×  ). The derived CH2DOH column densities are given in Table 3. We find 8.8 ± 0.9 × 1015 cm-2 and 2.4 ± 0.3 × 1015 cm-2 for dM-1 and dM-2, respectively. Adopting an H2 column density of 3.1 × 1024 cm-2 as derived by Favre et al. (2011) from the 223 GHz dust continuum, we obtain a CH2DOH relative abundance of 2.8 ± 0.3 × 10⁻⁹ toward dM-1. The relative CH2DOH abundance is uncertain toward dM-2 because this clump does not have a strong dust continuum emission and no reliable H2 column density can be derived.
Jacq et al. (1993) derived a CH2DOH column density of 2.6–5.4 × 1015 cm-2 toward Orion IRc2 with an estimated temperature of 88 K and an assumed source size of 15′′ from their IRAM 30 m data. When smoothing our CH2DOH data to a source size of 15′′, the derived CH2DOH column density is 0.2–1.4 × 1015 cm-2, assuming a maximum missing flux of 50% and an excitation temperature of 88 K toward IRc2. The column density disagrees with that of Jacq et al. (1993) by a factor of 2–3. Owing to the importance of deuteration ratios, which are obtained based mainly on previous single-dish estimates, we have revised the CH2DOH column density calculations together with CH3OD in Appendix A to compare them with our interferometric results. We find that the CH2DOH column density obtained by Jacq et al. (1993) is overestimated by a factor of 2–3, and the revisited value is thus consistent with our result mentioned above.
3.2. CH3OH
Three E-type methanol lines around 101 GHz (see Table 2) have been detected; the line parameters toward different peaks are summarized in Table B.2. The CH3OH emission exhibits a V-shaped structure (Figs. 1 and B.1) similar to that observed for several other molecular lines and for dust continuum emission. The eastern side of the V-shaped structure follows the dense ridge, and the bottom part coincides with the Compact Ridge region. The western part of this V-shaped structure lies in the N-S direction, and one CH3OH emission peak (Orion KL western clump, KL-W, Wright et al. 1992; MF-4/5, Favre et al. 2011) is located to the north close to the IR source IRc6, which lies ~3″ north of IRc7 (see, e.g., Gezari 1992; Gezari et al. 1998). Because of the lower spatial resolution ( ) of these CH3OH lines, only dM-1, dM-3, and KL-W are spatially resolved. The average FWHM line width toward the CH3OH emission peaks is 4.4 ± 1.2 km s-1, and the average line width at KL-W is about 6.5 km s-1, which is likely due to the blending of two or more velocity components at 8 and 10 − 11 km s-1 close to MF-4 and MF-5 (Favre et al. 2011). In addition, the E-type methanol lines’ average velocity is 8.2 ± 0.9 and 8.6 ± 0.9 km s-1 toward the three CH2DOH emission peaks and KL-W, respectively. Since KL-W is located ~7″ from the Hot Core and ~10″ from the Compact Ridge, the 8 km s-1 velocity component observed in single-dish observations (θMB > 20″) may contain a large amount of gas (~25% of our CH3OH total flux) from the KL-W region or the western side of the V-shaped structure. This will affect the analysis based only on the velocity components.
Because the CH3OH lines are optically thick in most cases (e.g., Menten et al. 1988), we first estimated the optical depth of the CH3OH lines detected here around 101 GHz. In the Rayleigh-Jeans approximation we derive the opacity from ![Mathematical equation: \begin{equation} \tau=-\ln\left[ 1-\frac{T_{\rm b}-T_{\rm bg}}{T_{\rm ex}-T_{\rm bg}} \right], \end{equation}](/articles/aa/full_html/2012/07/aa18310-11/aa18310-11-eq142.png) (2)where Tb and Tex are the source brightness and excitation temperatures (using the derived rotational temperatures of 40–70 K), Tbg is the background emission temperature, including both the cosmic microwave background radiation (2.73 K) and the Orion dust emission (around 0.8–1.4 K from the PdBI data, correcting for a high interferometric filtering loss in continuum of 90%). The average CH3OH optical depth is estimated to be ≲ 0.2 for the three 101 GHz CH3OH lines. Therefore, in the optically thin case, we can apply the population diagram method to estimate the E-type methanol column densities and rotational temperatures. The population diagrams are shown in Fig. B.4 and the derived excitation temperatures and column densities are listed in Table 3.
(2)where Tb and Tex are the source brightness and excitation temperatures (using the derived rotational temperatures of 40–70 K), Tbg is the background emission temperature, including both the cosmic microwave background radiation (2.73 K) and the Orion dust emission (around 0.8–1.4 K from the PdBI data, correcting for a high interferometric filtering loss in continuum of 90%). The average CH3OH optical depth is estimated to be ≲ 0.2 for the three 101 GHz CH3OH lines. Therefore, in the optically thin case, we can apply the population diagram method to estimate the E-type methanol column densities and rotational temperatures. The population diagrams are shown in Fig. B.4 and the derived excitation temperatures and column densities are listed in Table 3.
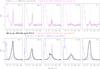 |
Fig. 2 Spectrum comparison of HDO, CH3OH, 13CH3OH, CH2DOH, and CH3OD toward selected sources in Orion BN/KL with a similar resolution of about 3′′. The SMA 13CH3OH line (Tang, priv. comm.) is plotted in blue for a synthesized beam of |

Rotational temperatures of 40–70 K and column densities of about 1018 cm-2 are found toward selected clumps in Orion BN/KL, assuming an A/E methanol abundance ratio of 1.2 (Menten et al. 1988). The derived CH3OH column densities are higher than the IRAM 30 m result of Menten et al. (1988), who obtained a CH3OH column density of 3.4 ± 0.3 × 1017 cm-2 with a rotational temperature of 128 ± 10 K, including both narrow and broad components and assuming a source size of 25′′. To compare ours with their results, we smoothed our CH3OH spectra to the beam size (25′′) of the 30 m telescope at 101–102 GHz (Fig. B.5). We derived a CH3OH column density of 2.3 ± 0.5 × 1017 cm-2 with a rotation temperature of about 60 K at the same position as used by Menten et al. (1988). Additionally, by adopting a higher temperature of 130 K, we derived a CH3OH column density of 4.6 ± 0.4 × 1017 cm-2, which is close to the column density derived by Menten et al. (1988).
Our methanol rotational temperature estimate is lower than the 100–150 K obtained by Menten et al. (1988) using the 30 m telescope and lower than the 80 K of Neill et al. (2011) using CARMA, but lies at the low end of the 50–350 K obtained by Beuther et al. (2005) using SMA. Lower rotational temperatures may be due to the non-LTE behavior (or subthermal excitation, see Sect. 4.3) of methanol. In addition, choosing only the lower-Eup transitions tends to result in a lower excitation temperature from population diagrams (see, e.g., Blake et al. 1987; Parise et al. 2002). Nevertheless, column densities are not very sensitive to rotational temperatures in this temperature range (Fig. B.6), and the differences in CH3OH column densities derived with different temperatures are less than a factor of about 3.
3.3. CH3OD
A new transition of CH3OD (5-1 − 4-1 E) was detected at 226 185.9 MHz for the first time in the ISM at the edge of our spectrometer and imaged toward Orion BN/KL. The CH3OD spectra for the selected sources in Orion BN/KL are shown in Fig. 2, and the line parameters are listed in Table B.3. The CH3OD channel maps are shown in Fig. 1. The CH3OD and CH2DOH spatial distributions are very similar (see Fig. 3c), and both maps show the strongest emission at dM-1 with weaker emission toward dM-2 and dM-3. The line widths of CH3OD toward dM-1 and dM-2 are about 2–3 km s-1, whereas two velocity components are clearly seen toward dM-3 with line widths of about 1–2 km s-1.
3.4. HDO
In one of our low angular resolution data sets ( ), we detected one HDO line at 225 896.7 MHz (31,2 − 22,1). This is not sufficient for a detailed analysis, but it allows us to compare the spatial distribution and spectra between deuterated methanol and water emissions. Figure 2 clearly shows that the optically thin lines from rarer isotopologs of methanol have similar spectral profiles with an average line width of about 3 km s-1 and LSR velocities of about 8 km s-1 at dM-1, dM-2, and dM-3. On the other hand, the HDO spectra in Orion BN/KL have broader line widths, which are likely composed by two or more velocity components. For example, the HDO spectra at dM-1 can be decomposed by two components at LSR velocities of about 5 and 7 km s-1 with line widths of about 10 and 4 km s-1, respectively. The narrow line feature is likely produced by the same gas at which isotopologic methanol lines have been detected, and the broad line feature may be due mainly to the shock-heated gas associated with the Hot Core and source I region where the hot ammonia and highly excited CH3CN are present (see, e.g., Goddi et al. 2011; Zapata et al. 2011).
4. Discussion
4.1. The CH2DOH/CH3OH abundance ratios
To investigate the CH3OH deuteration across the Orion BN/KL region, we smoothed our CH2DOH data to the spatial resolution of the E methanol lines () and derived the population diagram (Fig. B.3) by using methanol rotational temperatures and HCOOCH3 rotational temperatures for low and high temperature reference, respectively (see Table 3, which summarizes our calculations toward different clumps in Orion BN/KL). The [CH2DOH]/[CH3OH] abundance ratios are 1.1 ± 0.2 × 10⁻³, and 7.4 ± 1.6 × 10⁻⁴, and 8.8 ± 0.8 × 10⁻⁴ for dM-1, dM-2, and dM-3 with lower temperatures, respectively. An upper limit of about 2 × 10⁻⁴ is given for the [CH2DOH]/[CH3OH] abundance ratio at KL-W. It is interesting to note that the [CH2DOH]/[CH3OH] ratio of dM-3 is higher than that of dM-2.
These abundance ratios do not depend much on the assumed Trot (see Fig. B.6). If higher excitation temperatures are adopted (e.g., 130 K for dM-1 and 85 K for dM-2), the [CH2DOH]/[CH3OH] ratios do not change much. These ratios (observed toward different clumps in Orion BN/KL, see Table 3) are about one order of magnitude lower than the ratio (0.01–0.08) reported by Jacq et al. (1993). However, the [CH2DOH]/[CH3OH] abundance ratios derived for the selected sources (0.8 − 1.3 × 10³) are consistent with a revised ratio of 0.8 − 2.8 × 10³, where possible line blending and different observing positions were taken into account in the revisited calculations of the 30 m observations (see Appendix A for more details). In addition, the [CH2DOH]/[CH3OH] ratios in Orion BN/KL are lower than the deuterated methanol and formaldehyde abundance ratios estimated in several low-mass protostars, e.g., up to about 0.6 for [CH2DOH]/[CH3OH] and 0.3 for [HDCO]/[H2CO] in Class 0 sources (Parise et al. 2006).
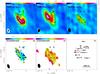 |
Fig. 3 a) Color image showing the integrated intensity map of the CH3OH 8-2 − 81 E line (Eup/k = 109.6 K, integrated from 5 to 11 km s-1) for a synthesized beam of |
Assuming that both CH2DOH and CH3OH are in LTE and have the same excitation temperature, we can produce a [CH2DOH]/[CH3OH] ratio map by using two transitions of CH2DOH and CH3OH and taking into account their line strengths, partition functions, and upper-state energies, the same method as used recently by Ratajczak et al. (2011). In the [CH2DOH]/[CH3OH] ratio map (Fig. 3d), dM-1 exhibits a higher ratio than observed toward the southern part of Orion BN/KL where dM-2 and dM-3 are located. It is interesting to note that the source I region also shows higher CH2DOH/CH3OH intensity ratios on each side of the bipolar outflow (marked with a double black arrow in the image). Since the feature associated with source I is only seen in the strongest CH2DOH line at 223 422.3 MHz, more observations are needed to confirm this result. Because we derive an upper limit of 2.2 × 10⁻⁴ for the [CH2DOH]/[CH3OH] abundance ratio toward KL-W, which is well below the ratios derived for dM-1, dM-2, and dM-3, there might be different physical and/or chemical conditions at KL-W. Nevertheless, we cannot exclude yet that the non-detection of the CH2DOH emission toward KL-W may result from spatial filtering in our PdBI interferometric data.
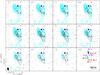 |
Fig. 4 Channel maps of the CH2DOH emission at 225 878.3 MHz (Eup/k = 35.7 K) in black contours overlaid with the HDO 31,2 − 22,1 line (Eup/k = 167.6 K) at 225 896.7 MHz in light-blue contours for a synthesized beam of |
The deuteration ratios derived here are not markedly different from one clump to another except perhaps for KL-W (where an upper limit is derived). However, it is clear that the deuteration ratio tends to decrease from the dense clumps (dM-1 to dM-3) to the more extended gas in Orion BN/KL. The H2 column densities of dM-1 and dM-3 are about 3 − 5 × 1024 cm-2, but the rotational temperature of HCOOCH3 toward dM-1 (about 130 K) is higher than toward dM-2 and dM-3 (about 8 K). Therefore, the slight difference observed in the deuteration ratios is likely due to different gas temperatures of the clumps. Based on our present knowledge, we suggest that various competing processes could be at work. For instance, global, slow heating of the Orion BN/KL region through ongoing star formation should produce widespread effects and the expected net result is a fairly homogeneous deuterated ratio. On the other hand, heating by luminous infrared sources (e.g., in the vicinity of source I) could result in a higher temperature in this region, leading to a higher deuteration ratio toward dM-1.
4.2. The CH2DOH/CH3OH abundance ratios
Although only one CH3OD line (5-1 − 4-1 E at 226 185.9 MHz, Eup/k = 37.3 K) has been detected in our observations, a similar [CH2DOH]/[CH3OD] abundance ratio image can be produced in the same fashion as [CH2DOH]/[CH3OH] by using the CH2DOH 31,3 − 20,2 o0 line (Eup/k = 35.7 K) at 225 878.3 MHz. Figure 3e shows the [CH2DOH]/[CH3OD] abundance ratio image by assuming the same excitation temperature for CH2DOH and CH3OD, the method used for the [CH2DOH]/[CH3OH] ratio map. This abundance ratio does not depend much on the temperature (see Fig. B.6b). Our results show that the [CH2DOH]/[CH3OD] abundance ratios are less than unity in the central region of Orion BN/KL and the mean ratio is 0.7 ± 0.3, which also differs from the ratio (1.1–1.5) reported by Jacq et al. (1993). However, the revisited calculation as mentioned above (Appendix A) of the previous 30 m observations of CH2DOH (Jacq et al. 1993), CH3OD (Mauersberger et al. 1988), and CH3OH (Menten et al. 1988) gives a lower [CH2DOH]/[CH3OD] abundance ratio of ≲ 0.6 toward IRc2 (adopting a source size of 15′′), which is consistent with our results and is much lower than the values derived in low-mass protostars (e.g., Parise et al. 2002; Ratajczak et al. 2011). Additionally, we note that the [CH2DOH]/[CH3OD] abundance ratios are higher at dM-1 and dM-3 compared with that at dM-2.
The fact that the [CH2DOH]/[CH3OD] ratios are less than unity in the central Orion BN/KL region is surprising because most of the theoretical and experimental studies on deuterated methanol predict more abundant CH2DOH than CH3OD (see, e.g., Charnley et al. 1997; Osamura et al. 2004; Nagaoka et al. 2005; Ratajczak et al. 2009). Since CH2DOH and CH3OD have very similar emission distributions in Orion BN/KL, their formations seem to be closely related. As shown by Osamura et al. (2004), exchanging protons and deuterons on the two different parts of the methanol backbone is very inefficient in the post-evaporative gas-phase. However, the simulations of Osamura et al. (2004) show that the water vapor that evaporates from the surface above 80 K strongly affects the abundance of CH3OD, because the protonation of H2O and HDO in gas phase leads to additional fractionation throughout the reaction network. Therefore, the observed abundance ratio between CH2DOH and CH3OD might not reflect the primitive abundance ratio in the ice mantle of grain surfaces. This may explain the much lower [CH2DOH]/[CH3OD] ratios seen in Orion BN/KL, where most of the regions have higher temperatures than 80 K. Besides, it indicates that H2O and HDO may be two critical molecules for understanding the formation processes of deuterated methanol in Orion BN/KL.
4.3. CH3OH subthermal excitation?
Recently, Wang et al. (2011) detected more than 300 methanol lines around 524 GHz (θMB ≈ 43″) and 1061 GHz (θMB ≈ 20″) with the Herschel/HIFI instrument. Although these data were obtained with a broad beamwidth, it may be useful to investigate the implications of the Wang et al. results on our own data in terms of the CH3OH excitation. The narrow and broad CH3OH components observed by Wang et al. show average FWHM line widths of 2.7 and 4–11 km s-1 at VLSR = 8.6 and 6–9 km s-1, respectively. Their LSR velocities are consistent with our data. However, their broad components’ line widths are wider than ours. This is likely due to optical depth broadening (τ ~ 15 in the Herschel/HIFI CH3OH data), although we cannot exclude that some faint broad and extended velocity components detected by Herschel may also be partly filtered out in our interferometric data.
Our three CH3OH 101 GHz transitions include upper energy levels with Eup/k ≲ 110 K, from which we derived Trot = 40–70 K. The CH3OH lines in this energy level range detected by Herschel (see, e.g., Fig. 4 in Wang et al. 2011) also give a similar trend: a low rotational temperature and a high column density are derived by using only the low Eup data in the CH3OH population diagram. The CH3OH lines from the Herschel/HIFI observations are optically thick, but the 13CH3OH lines (τ = 0.03–0.28) also show the same trend. This suggests that our low-temperature result (Trot = 40–70 K) is unlikely to be caused by optical depth effects. Because the LSR velocities of our CH3OH lines are consistent with the Herschel/HIFI data, it is more likely that our low CH3OH excitation temperatures are not caused by a cold component along the line of sight, but that they are largely generated by subthermal excitation conditions.
4.4. Comparison with the HDO emission
In Fig. 4, the superposition of HDO 31,2 − 22,1 and CH2DOH 31,3 − 20,2 lines shows a globally similar distribution for different velocity channels. This result is significant because both lines were detected in the same PDBI data set around 225.9 GHz. However, details differ, as one may expect for two transitions with different upper energy levels (168 K and 36 K for HDO and CH2DOH, respectively), and for different molecular formation scenarios, which imply, for instance, that methanol is formed on grain surfaces at higher densities than water.
The HDO emission peaks between the Orion Hot Core and dM-1, near the dust clump SMA-1 (Beuther et al. 2004; see also our Fig. 3). Dust emission toward this peak has been detected with SMA in the 870 μm band by Tang et al. (2010). Owing to a position offset of about 1′′, it is not clear whether this clump coincides with the SMA-1 position observed by Beuther et al. (2004) with a resolution of  . In addition to the prominent emission peak near SMA-1, the HDO emission shows a similar V-shaped distribution as CH3OH. There is HDO emission close to the IR source IRc7, but it is interesting to note that the HDO emission does not peak at IRc7. It peaks to the southwest of IRc7 instead. A similar situation is observed with SMA for the 13CH3OH emission (see the right panel of Fig. 3; Tang, priv. comm.). In addition, it seems that the overall CH2DOH emission distribution is shifted to the south by a few arcseconds with respect to the HDO emission. For example, the strongest HDO emission peak, which corresponds to the NH3 column density peak derived by Goddi et al. (2011), is located 3′′ north of dM-1. This shift is clearly seen in Fig. 3 where the HDO and 13CH3OH emissions lie farther north than the CH3OH and CH2DOH emissions. The different spatial distributions observed for CH2DOH and CH3OH on one side, and HDO and 13CH3OH on the other side (see Figs. 3 and 4) cannot be attributed to optical depth effects because (a) we have shown that our CH2DOH (1.3 mm emission) and CH3OH (3 mm emission) data are optically thin; (b) our estimate of the HDO line opacity is ≲ 0.3 (agrees with Jacq et al. 1990). The difference observed in the distribution of these molecular species could be due to different temperatures across the Orion molecular material involving processes such as heating by luminous infrared sources or shocks.
4.5. Deuteration ratios of water and methanol
The [HDO]/[H2O] abundance ratio has been reported to be about a few times 10-4 toward Orion BN/KL (see, e.g., Pardo et al. 2001; Jacq et al. 1990), which is about one order of magnitude lower than the [CH2DOH]/[CH3OH] ratio derived here. [HDO]/[H2O] ratios lower than the [CH2DOH]/[CH3OH] ratios have also been reported toward low-mass protostars (Parise et al. 2005; Liu et al. 2011). Since heavy water (D2O) is much less abundant than HDO, i.e., [D2O]/[HDO] = 1.7 × 10⁻³ in IRAS 16 293–2422 (Butner et al. 2007), HDO seems to be the main deuterium (gas phase) reservoir for water in Orion BN/KL. For methanol, CH3OD is as abundant as CH2DOH, and other doubly or multiply deuterated methanol species are expected to be less abundant. Therefore, the total deuteration ratio for methanol (including CH2DOH and CH3OD) in Orion BN/KL is about one order of magnitude higher than that of water (including HDO and D2O). If both water and methanol sublimate from ice mantles with similar time scales, and supposing that their destruction rates are comparable, the higher abundance of deuterated methanol may just reflect different chemical reaction speeds on dust surface. At a later stage, formation and destruction rates in the gas phase will of course complicate the analysis. Some experiments have been conducted to investigate this question. For example, H-D exchange between water and methanol has been proposed by several authors in different physical conditions, e.g., temperature increase and ultraviolet light irradiation (Ratajczak et al. 2009; Weber et al. 2009). In addition, the enrichment of deuterated methanol has been experimentally reproduced by H-D substitution in solid methanol at 10 K. However, a high atomic D/H ratio of 0.1 was required and the substitution was not seen in water and ammonia (Nagaoka et al. 2005). Therefore, H-D substitution may qualitatively explain why methanol is easier to be deuterated than water; but more chemical experiments and modeling are clearly needed to quantitatively address this question.
5. Conclusions
The main findings and conclusions of our study based on observations of several transitions of deuterated methanol and one transition of deuterated water in Orion BN/KL are as follows.
-
1.
We have obtained the first high angular resolution(
 ×
×  ) CH2DOH images detected around 223.5 GHz toward Orion BN/KL and compared these data with somewhat lower resolution () CH3OH images at 101.5 GHz. The strongest CH2DOH and CH3OH emissions come from the Hot Core southwest region exhibiting an LSR velocity of about 8 km s-1, typical of the Orion Compact Ridge region. The CH2DOH emission is clumpy and the column densities are estimated to be about 1–9 × 1015 cm-2 toward these clumps. The CH3OH column densities are about 3–5 × 1017 cm-2 across Orion BN/KL, leading to a [CH2DOH]/[CH3OH] deuteration ratio of 0.8–1.3 × 10⁻³ toward three deuterated methanol clumps and below 2 × 10⁻⁴ toward KL-W.
 -
2.
The [CH2DOH]/[CH3OD] abundance ratio map was obtained for Orion BN/KL, and their ratios are less than unity at the central part of the region. These ratios are lower than the statistical factor of 3 derived in the simplest deuteration models, and definitely lower than the values derived in low-mass protostars (e.g., Parise et al. 2002; Ratajczak et al. 2011).
-
3.
We have mapped with moderately high spatial resolution (
) the 225.9 GHz transition of HDO and compared its distribution with CH2DOH, CH3OH, and 13CH3OH. We find that the deuterated water ratio is about one order of magnitude lower than the deuterated methanol ratio. H-D substitution may explain why methanol is easier to be deuterated than water. -
4.
The deuteration ratios derived in this work are not strongly different from one clump to another, except perhaps toward KL-W where more observations are desirable to conclude. However, to explain the slight differences observed locally in the abundance ratios of identified clumps, we suggest that various processes could be competing, for instance, heating by luminous infrared sources, or heating by shocks.
Online material
Appendix A: Revisiting the CH2DOH/CH3OD abundance ratios in Orion BN/KL
To compare our high angular resolution data with previous single-dish observations, we re-calculated the temperatures and column densities obtained by Mauersberger et al. (1988) and Jacq et al. (1993) from their 30 m data for CH3OD and CH2DOH, respectively. The line parameters of CH3OD and CH2DOH used in the calculations are listed in Table A.1, and the population diagrams are shown in Fig. A.1.
CH 3 OD
We selected only five clean CH3OD lines (without any apparent line-blending) around 140–156 GHz detected by Mauersberger et al. (1988) with a similar resolution of 16′′–17′′ to reduce the fitting uncertainty. The CH3OD lines detected by Jacq et al. (1993) were excluded because no CH3OD spectra can be used to judge the possible line-blending and data quality. Effective line strengths Sμ2 of the CH3OD lines were taken from Anderson et al. (1988), and the partition function Q = 1.41 T1.5 was used. The rotational temperature (132.4 ± 19.6 K) and column density (4.4 ± 0.3 × 1015 cm-2) were estimated by a least-squares fit (Fig. A.1), assuming a source size of 15′′. The revised CH3OD temperature and column density are consistent with those of Mauersberger et al. (1988), who derived a rotational temperature of 50–150 K and a column density of 1–5 × 1015 cm-2.
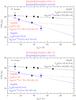 |
Fig. A.1 Population diagrams of CH3OD and CH2DOH using the 30 m data of Mauersberger et al. (1988) and Jacq et al. (1993), respectively. The old CH2DOH effective line strengths of Jacq et al. (1993) (upper panel) and the new ones (lower panel) were used in the calculations. The beam filling factor was taken into account by assuming a source size of 15′′. The rotational temperatures and column densities were estimated by a least-squares fit, and the results and uncertainties are given in the diagrams. For CH2DOH, the red dashed line in the upper panel indicates the fit with a fixed temperature of 100 K as adopted by Jacq et al. (1993) and the one in the lower panel the fit with a temperature of 130 K (the same as the CH3OD temperature derived here). |
30 m CH3OD and CH2DOH line parameters.
CH 2 DOH
For CH2DOH, we judge that only the three detections reported by Jacq et al. (1993) can be reliably used in the population diagrams (see Table A.1). Both old CH2DOH Sμ2 values taken from Jacq et al. (1993) and new ones (see Table A.1) provided by Parise (priv. comm.) were used in the calculations (Fig. A.1). The CH2DOH partition function Q = 2.25 T1.5 and a source size of 15′′ were used here.
The new values of CH2DOH Sμ2 employed in this work are based on those tabulated in the paper by Parise et al. (2002) but a factor of three higher. This revision corrects for an inconsistency with the partition function reported by Parise et al. (2002), and some dipole moment values can be quite uncertain, which may explain the discrepancy with the values used by Jacq et al. (1993) and why they were never officially released in the JPL database. However, as shown below, both the old Sμ2 values used by Jacq et al. (1993) and new ones adopted here give similar estimates of the CH2DOH column densities in Orion BN/KL. We believe that the uncertainties of the CH2DOH Sμ2 values of our present work are not dominant in the column density calculations. Nevertheless, a new spectroscopic study of CH2DOH with a robust fitting of the Hamiltonian would definitely give better confidence in these intensities.
Using the old Sμ2, a least-squares fit to the CH2DOH data shows a low rotational temperature (about 25 ± 10 K) with a column density of 5.0 × 1014 cm-2, consistent with the first estimate of Jacq et al. (1993), who derived a rotational temperature of 34 K and a column density of 6 × 1014 cm-2. However, since the rotational temperatures derived by Menten et al. (1988) and Mauersberger et al. (1988) for CH3OH and CH3OD are about 100 K toward Orion BN/KL, Jacq et al. (1993) also adopted a higher temperature for CH2DOH. They obtained a CH2DOH column density of 3.9 × 1015 cm-2, which is 2.6 times higher than our revised value (1.6 × 1015 cm-2, see Fig. A.1 upper panel). This is because they appear to correct the beam-filling factor twice in their Nl/gl calculations and population diagram. Therefore, the CH2DOH column density derived by Jacq et al. (1993) with a temperature of 100 K was overestimated by a factor of 2–3.
With the new CH2DOH Sμ2, we derive a somewhat higher rotational temperature (40.6 ± 14.4 K) and a column density of 5.0 × 1014 cm-2 similar to that derived by using the old Sμ2. This suggests that the uncertainties in the CH2DOH effective line strengths do not strongly affect the CH2DOH column density estimate in this case.
CH 2 DOH/CH 3 OD abundance ratios
The overestimated CH2DOH column density derived by Jacq et al. (1993) leads to a higher [CH2DOH]/[CH3OD] abundance ratio (1.1–1.5) toward IRc2. The new calculation indicates that the [CH2DOH]/[CH3OD] abundance ratio is 0.2–0.5 with a source size of 15′′, assuming CH2DOH and CH3OD have the same temperature of about 130 K. For a lower CH2DOH temperature (i.e., about 40 K), the [CH2DOH]/[CH3OD] ratio is even lower (about 0.1).
In addition, the CH3OD data of Mauersberger et al. (1988) were taken at the position close to KL-W (KL-WM hereafter, Menten et al. 1988) instead of IRc2, which was used as the central position by Jacq et al. (1993). According to our CH3OD image (Fig. 3), the intensity observed toward IRc2 is about twice as high as that of KL-WM, assuming a 30 m telescope beam size of about 18′′ at 140 GHz and the same filtering. Therefore, the
CH3OD abundance in Orion BN/KL derived by Mauersberger et al. (1988) may be underestimated by 50% at most. A similar calculation (Fig. B.5) also shows that the CH3OH column density toward KL-WM is about 20% lower than that toward IRc2.
In short, we conclude that the revisited [CH2DOH]/ [CH3OD] abundance ratio derived from the previous 30 m observations is ≲ 0.6, and the [CH2DOH]/[CH3OH] abundance ratio is estimated to be 0.8–2.8 × 10⁻³ toward IRc2, by adopting a CH3OH column density of 4.7 ± 0.3 × 1017 cm-2 (Menten et al. 1988) and correcting the possible density underestimate of about 20% toward IRc2 (for a source size of 15′′).
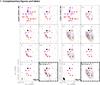 |
Fig. B.1 Left: channel maps of the CH2DOH doublet (Eup/k = 48.4 K) emission at 223 616.1 MHz for a synthesized beam of |
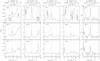 |
Fig. B.2 CH2DOH spectra toward dM-1, dM-2, and dM-3 for a synthesized beam of |
PdBI CH2DOH line parameters at dM-1, dM-2, and dM-3.
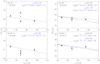 |
Fig. B.3 CH2DOH population diagrams of dM-1 and dM-2. a, b) Population diagrams of the high angular resolution data. The rotational temperatures are assumed to be 130 K and 85 K for dM-1 and dM-2, respectively. c, d) Population diagrams for the data smoothed to a resolution of |
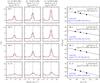 |
Fig. B.4 CH3OH spectra ( |


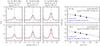 |
Fig. B.5 Similar plot as Fig. B.4. CH3OH spectra were smoothed to the 30 m beam size of 25′′ to compare with the previous 30 m observations by Menten et al. (1988). Upper panels show the CH3OH spectra and population diagram taken at the same position ( |


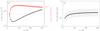 |
Fig. B.6 a) Variation of derived CH3OH column densities with respect to different rotational temperatures toward dM-1. The corresponding [CH2DOH]/[CH3OH] abundance (derived in population diagrams) ratios are shown in red. The best-fit result corresponds to a CH3OH column density of 2.1 × 1018 cm-2 and a temperature of about 60 K. For temperatures lower than 200 K, the differences in the derived column densities are clearly smaller than a factor of about 3. The [CH2DOH]/[CH3OH] abundance ratios derived from different temperatures are lower than 1.1 × 10⁻³. b) Variation of the relative abundance (based on the ratio of two transitions of CH2DOH and CH3OD as seen in Fig. 3e of the two isotopologs toward dM-1 as a function of the adopted temperatures. Note that this ratio does not depend much on the temperature. |
PdBI CH3OH line parameters at dM-1, dM-2, dM-3, and KL-W.
PdBI CH3OD 5-1 − 4-1 E line parameters at dM-1, dM-2, and dM-3.
The IRAM Plateau de Bure Interferometer. IRAM is supported by INSU/CNRS (France), MPG (Germany) and IGN (Spain).
Acknowledgments
We thank Y.-W. Tang for kindly providing the SMA 13CH3OH image. T.-C. Peng acknowledges support from the ALMA grant 2009-18 at Université de Bordeaux1/LAB. B. Parise is supported by the German Deutsche Forschungsgemeinschaft, DFG Emmy Noether project number PA1692/1-1. We thank the referee, who helped us in restructuring our initial work and in clarifying our main conclusions.
References
- Anderson, T., Crownover, R. L., Herbst, E., & De Lucia, F. C. 1988, ApJS, 67, 135 [NASA ADS] [CrossRef] [Google Scholar]
- Becklin, E. E., & Neugebauer, G. 1967, ApJ, 147, 799 [NASA ADS] [CrossRef] [Google Scholar]
- Beuther, H., Zhang, Q., Greenhill, L. J., et al. 2004, ApJ, 616, L31 [Google Scholar]
- Beuther, H., Zhang, Q., Greenhill, L. J., et al. 2005, ApJ, 632, 355 [NASA ADS] [CrossRef] [Google Scholar]
- Blake, G. A., Sutton, E. C., Masson, C. R., & Phillips, T. G. 1987, ApJ, 315, 621 [NASA ADS] [CrossRef] [Google Scholar]
- Butner, H. M., Charnley, S. B., Ceccarelli, C., et al. 2007, ApJ, 659, L137 [NASA ADS] [CrossRef] [Google Scholar]
- Charnley, S. B., Tielens, A. G. G. M., & Rodgers, S. D. 1997, ApJ, 482, L203 [NASA ADS] [CrossRef] [Google Scholar]
- Clark, B. G. 1980, A&A, 89, 377 [NASA ADS] [Google Scholar]
- Chandler, C. J., & Wood, D. O. S. 1997, MNRAS, 287, 445 [NASA ADS] [Google Scholar]
- Downes, D., Genzel, R., Becklin, E. E., & Wynn-Williams, C. G. 1981, ApJ, 244, 869 [NASA ADS] [CrossRef] [Google Scholar]
- Favre, C., Despois, D., Brouillet, N., et al. 2011, A&A, 532, A32 [NASA ADS] [CrossRef] [EDP Sciences] [Google Scholar]
- Friedel, D. N., & Snyder, L. E. 2008, ApJ, 672, 962 [NASA ADS] [CrossRef] [Google Scholar]
- Garay, G., Moran, J. M., & Reid, M. J. 1987, ApJ, 314, 535 [NASA ADS] [CrossRef] [Google Scholar]
- Gezari, D. Y. 1992, ApJ, 396, L43 [NASA ADS] [CrossRef] [Google Scholar]
- Gezari, D. Y., Backman, D. E., & Werner, M. W. 1998, ApJ, 509, 283 [NASA ADS] [CrossRef] [Google Scholar]
- Goddi, C., Greenhill, L. J., Humphreys, E. M. L., Chandler, C. J., & Matthews, L. D. 2011, ApJ, 739, L13 [NASA ADS] [CrossRef] [Google Scholar]
- Goldsmith, P. F., & Langer, W. D. 1999, ApJ, 517, 209 [NASA ADS] [CrossRef] [Google Scholar]
- Ivash, E. V., & Dennison, D. M. 1953, J. Chem. Phys., 21, 1804 [NASA ADS] [CrossRef] [Google Scholar]
- Jacq, T., Walmsley, C. M., Henkel, C., et al. 1990, A&A, 228, 447 [NASA ADS] [Google Scholar]
- Jacq, T., Walmsley, C. M., Mauersberger, R., et al. 1993, A&A, 271, 276 [NASA ADS] [Google Scholar]
- Kleinmann, D. E., & Low, F. J. 1967, ApJ, 149, L1 [NASA ADS] [CrossRef] [Google Scholar]
- Lauvergnat, D., Coudert, L. H., Klee, S., & Smirnov, M. 2009, J. Mol. Spect., 256, 204 [Google Scholar]
- Linsky, J. L., Draine, B. T., Moos, H. W., et al. 2006, ApJ, 647, 1106 [NASA ADS] [CrossRef] [Google Scholar]
- Lis, D. C., Roueff, E., Gerin, M., et al. 2002, ApJ, 571, L55 [NASA ADS] [CrossRef] [Google Scholar]
- Liu, F.-C., Parise, B., Kristensen, L., et al. 2011, A&A, 527, A19 [NASA ADS] [CrossRef] [EDP Sciences] [Google Scholar]
- Matsakis, D. N., Wright, M. C. H., Townes, C. H., et al. 1980, ApJ, 236, 481 [NASA ADS] [CrossRef] [Google Scholar]
- Mauersberger, R., Henkel, C., Jacq, T., & Walmsley, C. M. 1988, A&A, 194, L1 [NASA ADS] [Google Scholar]
- Menten, K. M., & Reid, M. J. 1995, ApJ, 445, L157 [NASA ADS] [CrossRef] [Google Scholar]
- Menten, K. M., Walmsley, C. M., Henkel, C., & Wilson, T. L. 1988, A&A, 198, 253 [NASA ADS] [Google Scholar]
- Menten, K. M., Reid, M. J., Forbrich, J., & Brunthaler, A. 2007, A&A, 474, 515 [NASA ADS] [CrossRef] [EDP Sciences] [Google Scholar]
- Mukhopadhyay, I., Perry, D. S., Duan, Y.-B., et al. 2002, J. Chem. Phys., 116, 3710 [NASA ADS] [CrossRef] [Google Scholar]
- Nagaoka, A., Watanabe, N., & Kouchi, A. 2005, ApJ, 624, L29 [NASA ADS] [CrossRef] [Google Scholar]
- Neill, J. L., Steber, A. L., Muckle, M. T., et al. 2011, J. Phys. Chem. A, 115, 6472 [CrossRef] [Google Scholar]
- Osamura, Y., Roberts, H., & Herbst, E. 2004, A&A, 421, 1101 [NASA ADS] [CrossRef] [EDP Sciences] [Google Scholar]
- Pardo, J. R., Cernicharo, J., Herpin, F., et al. 2001, ApJ, 562, 799 [NASA ADS] [CrossRef] [Google Scholar]
- Parise, B., Ceccarelli, C., Tielens, A. G. G. M., et al. 2002, A&A, 393, L49 [NASA ADS] [CrossRef] [EDP Sciences] [Google Scholar]
- Parise, B., Castets, A., Herbst, E., et al. 2004, A&A, 416, 159 [NASA ADS] [CrossRef] [EDP Sciences] [Google Scholar]
- Parise, B., Caux, E., Castets, A., et al. 2005, A&A, 431, 547 [NASA ADS] [CrossRef] [EDP Sciences] [Google Scholar]
- Parise, B., Ceccarelli, C., Tielens, A. G. G. M., et al. 2006, A&A, 453, 949 [NASA ADS] [CrossRef] [EDP Sciences] [Google Scholar]
- Pearson, J. C., Sastry, K. V. L. N., Herbst, E., & De Lucia, F. C. 1997, ApJ, 480, 420 [NASA ADS] [CrossRef] [Google Scholar]
- Peng, T.-C., Wyrowski, F., Zapata, L. A., Güsten, R., & Menten, K. M. 2012, A&A, 538, A12 [NASA ADS] [CrossRef] [EDP Sciences] [Google Scholar]
- Plambeck, R. L., & Wright, M. C. H. 1988, ApJ, 330, L61 [NASA ADS] [CrossRef] [Google Scholar]
- Ratajczak, A., Quirico, E., Faure, A., Schmitt, B., & Ceccarelli, C. 2009, A&A, 496, L21 [NASA ADS] [CrossRef] [EDP Sciences] [Google Scholar]
- Ratajczak, A., Taquet, V., Kahane, C., et al. 2011, A&A, 528, L13 [NASA ADS] [CrossRef] [EDP Sciences] [Google Scholar]
- Rieke, G. H., Low, F. J., & Kleinmann, D. E. 1973, ApJ, 186, L7 [NASA ADS] [CrossRef] [Google Scholar]
- Roberts, H., & Millar, T. J. 2000, A&A, 361, 388 [NASA ADS] [Google Scholar]
- Roberts, H., Herbst, E., & Millar, T. J. 2003, ApJ, 591, L41 [NASA ADS] [CrossRef] [Google Scholar]
- Rodgers, S. D., & Charnley, S. B. 2002, Planet. Space Sci., 50, 1125 [NASA ADS] [CrossRef] [Google Scholar]
- Rodriguez Kuiper, E. N., Kuiper, T. B. H., & Zuckerman, B. 1978, ApJ, 219, L49 [NASA ADS] [CrossRef] [Google Scholar]
- Tang, Y.-W., Ho, P. T. P., Koch, P. M., & Rao, R. 2010, ApJ, 717, 1262 [NASA ADS] [CrossRef] [Google Scholar]
- Turner, B. E. 1990, ApJ, 362, L29 [Google Scholar]
- Turner, B. E. 1991, ApJS, 76, 617 [NASA ADS] [CrossRef] [Google Scholar]
- Turner, B. E., Fourikis, N., Morris, M., Palmer, P., & Zuckerman, B. 1975, ApJ, 198, L125 [NASA ADS] [CrossRef] [Google Scholar]
- van der Tak, F. F. S., Schilke, P., Müller, H. S. P., et al. 2002, A&A, 388, L53 [NASA ADS] [CrossRef] [EDP Sciences] [Google Scholar]
- Wang, K.-S., Kuan, Y.-J., Liu, S.-Y., & Charnley, S. B. 2010, ApJ, 713, 1192 [NASA ADS] [CrossRef] [Google Scholar]
- Wang, S., Bergin, E. A., Crockett, N. R., et al. 2011, A&A, 527, A95 [NASA ADS] [CrossRef] [EDP Sciences] [Google Scholar]
- Weber, A. S., Hodyss, R., Johnson, P. V., Willacy, K., & Kanik, I. 2009, ApJ, 703, 1030 [NASA ADS] [CrossRef] [Google Scholar]
- Wright, M., Sandell, G., Wilner, D. J., & Plambeck, R. L. 1992, ApJ, 393, 225 [NASA ADS] [CrossRef] [Google Scholar]
- Wright, M. C. H., Plambeck, R. L., & Wilner, D. J. 1996, ApJ, 469, 216 [NASA ADS] [CrossRef] [Google Scholar]
- Xu, L.-H., Fisher, J., Lees, R. M., et al. 2008, J. Mol. Spectr., 251, 305 [NASA ADS] [CrossRef] [Google Scholar]
- Zapata, L. A., Schmid-Burgk, J., Ho, P. T. P., Rodríguez, L. F., & Menten, K. M. 2009, ApJ, 704, L45 [NASA ADS] [CrossRef] [Google Scholar]
- Zapata, L. A., Schmid-Burgk, J., & Menten, K. M. 2011, A&A, 529, A24 [NASA ADS] [CrossRef] [EDP Sciences] [Google Scholar]
All Tables
All Figures
|
Fig. 1 Left: channel maps of the CH2DOH 52,4 − 42,3 (Eup/k = 95.2 K) emission at 223 422.3 MHz for a synthesized beam of |
| In the text | |
|
Fig. 2 Spectrum comparison of HDO, CH3OH, 13CH3OH, CH2DOH, and CH3OD toward selected sources in Orion BN/KL with a similar resolution of about 3′′. The SMA 13CH3OH line (Tang, priv. comm.) is plotted in blue for a synthesized beam of |
| In the text | |
|
Fig. 3 a) Color image showing the integrated intensity map of the CH3OH 8-2 − 81 E line (Eup/k = 109.6 K, integrated from 5 to 11 km s-1) for a synthesized beam of |
| In the text | |
|
Fig. 4 Channel maps of the CH2DOH emission at 225 878.3 MHz (Eup/k = 35.7 K) in black contours overlaid with the HDO 31,2 − 22,1 line (Eup/k = 167.6 K) at 225 896.7 MHz in light-blue contours for a synthesized beam of |
| In the text | |
|
Fig. A.1 Population diagrams of CH3OD and CH2DOH using the 30 m data of Mauersberger et al. (1988) and Jacq et al. (1993), respectively. The old CH2DOH effective line strengths of Jacq et al. (1993) (upper panel) and the new ones (lower panel) were used in the calculations. The beam filling factor was taken into account by assuming a source size of 15′′. The rotational temperatures and column densities were estimated by a least-squares fit, and the results and uncertainties are given in the diagrams. For CH2DOH, the red dashed line in the upper panel indicates the fit with a fixed temperature of 100 K as adopted by Jacq et al. (1993) and the one in the lower panel the fit with a temperature of 130 K (the same as the CH3OD temperature derived here). |
| In the text | |
|
Fig. B.1 Left: channel maps of the CH2DOH doublet (Eup/k = 48.4 K) emission at 223 616.1 MHz for a synthesized beam of |
| In the text | |
|
Fig. B.2 CH2DOH spectra toward dM-1, dM-2, and dM-3 for a synthesized beam of |
| In the text | |
|
Fig. B.3 CH2DOH population diagrams of dM-1 and dM-2. a, b) Population diagrams of the high angular resolution data. The rotational temperatures are assumed to be 130 K and 85 K for dM-1 and dM-2, respectively. c, d) Population diagrams for the data smoothed to a resolution of |
| In the text | |
|
Fig. B.4 CH3OH spectra ( |
| In the text | |
|
Fig. B.5 Similar plot as Fig. B.4. CH3OH spectra were smoothed to the 30 m beam size of 25′′ to compare with the previous 30 m observations by Menten et al. (1988). Upper panels show the CH3OH spectra and population diagram taken at the same position ( |
| In the text | |
|
Fig. B.6 a) Variation of derived CH3OH column densities with respect to different rotational temperatures toward dM-1. The corresponding [CH2DOH]/[CH3OH] abundance (derived in population diagrams) ratios are shown in red. The best-fit result corresponds to a CH3OH column density of 2.1 × 1018 cm-2 and a temperature of about 60 K. For temperatures lower than 200 K, the differences in the derived column densities are clearly smaller than a factor of about 3. The [CH2DOH]/[CH3OH] abundance ratios derived from different temperatures are lower than 1.1 × 10⁻³. b) Variation of the relative abundance (based on the ratio of two transitions of CH2DOH and CH3OD as seen in Fig. 3e of the two isotopologs toward dM-1 as a function of the adopted temperatures. Note that this ratio does not depend much on the temperature. |
| In the text | |
Current usage metrics show cumulative count of Article Views (full-text article views including HTML views, PDF and ePub downloads, according to the available data) and Abstracts Views on Vision4Press platform.
Data correspond to usage on the plateform after 2015. The current usage metrics is available 48-96 hours after online publication and is updated daily on week days.
Initial download of the metrics may take a while.