Fig. 1
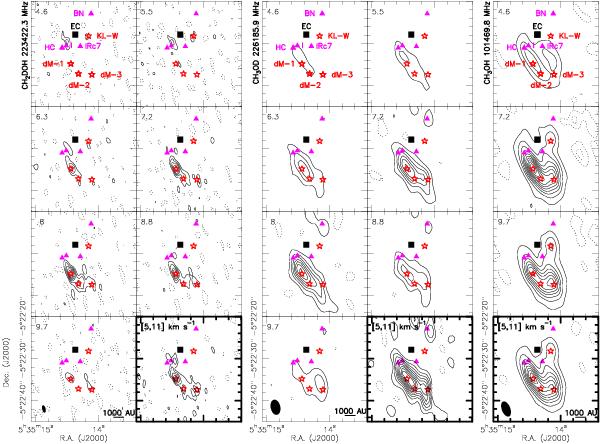
Left: channel maps of the CH2DOH 52,4 − 42,3 (Eup/k = 95.2 K) emission at 223 422.3 MHz for a synthesized beam of  . Contours run from 40 mJy beam-1 (2σ) to 280 mJy beam-1 (4.84 K) in steps of 40 mJy beam-1, and the dashed contours represent –20 mJy beam-1. The bottom-right panel shows the integrated intensity (from 5 to 11 km s-1) in contours running from 0.2 to 1.0 Jy beam-1 km s-1 in steps of 0.2 Jy beam-1 km s-1, and the dashed contours represent –0.08 Jy beam-1 km s-1. Middle: channel maps of the CH3OD emission at 226 185.9 MHz (Eup/k = 37.3 K) for a synthesized beam of
  . Contours run from 0.12 to 2.52 Jy beam-1 in steps of 0.04 Jy beam-1 (3σ), and the dashed contours represent –0.08 Jy beam-1. The bottom-right panel shows the integrated intensity of CH3OD (from 5 to 11 km s-1) in contours running from 10% to 90% in step of 10% of the peak intensity (3.1 Jy beam-1 km s-1), and the dashed contours represent –10% of the peak intensity. Right: channel maps of the CH3OH 8-2 − 81 E (Eup/k = 109.6 K) emission at 101 469.8 MHz for a synthesized beam of
  . Contours run from 40 to 490 mJy beam-1 (7.74 K) in steps of 50 mJy beam-1. The dashed contours represent –30 (1σ) and –90 mJy beam-1. The bottom panel shows the integrated intensity of CH3OH (from 5 to 11 km s-1) in contours running from 0.3 to 3.0 Jy beam-1 km s-1 in steps of 0.3 Jy beam-1 km s-1, and the dashed contours represent −0.03 Jy beam-1 km s-1. The black square marks the center of explosion according to Zapata et al. (2009). The positions of source BN, source I, the Hot Core (HC), and IRc7 are marked by magenta triangles. The positions of deuterated methanol emission peaks (dM-1, dM-2, and dM-3) and KL-W are marked by red stars. Note that the channel separation in the CH3OD channel maps are resampled and only the three selected CH3OH channel maps are shown here for clarity (see Fig. B.1 for the full CH3OH channel maps).
Current usage metrics show cumulative count of Article Views (full-text article views including HTML views, PDF and ePub downloads, according to the available data) and Abstracts Views on Vision4Press platform.
Data correspond to usage on the plateform after 2015. The current usage metrics is available 48-96 hours after online publication and is updated daily on week days.
Initial download of the metrics may take a while.