| Issue |
A&A
Volume 543, July 2012
|
|
|---|---|---|
| Article Number | A152 | |
| Number of page(s) | 18 | |
| Section | Interstellar and circumstellar matter | |
| DOI | https://doi.org/10.1051/0004-6361/201118310 | |
| Published online | 13 July 2012 | |
Online material
Appendix A: Revisiting the CH2DOH/CH3OD abundance ratios in Orion BN/KL
To compare our high angular resolution data with previous single-dish observations, we re-calculated the temperatures and column densities obtained by Mauersberger et al. (1988) and Jacq et al. (1993) from their 30 m data for CH3OD and CH2DOH, respectively. The line parameters of CH3OD and CH2DOH used in the calculations are listed in Table A.1, and the population diagrams are shown in Fig. A.1.
CH 3 OD
We selected only five clean CH3OD lines (without any apparent line-blending) around 140–156 GHz detected by Mauersberger et al. (1988) with a similar resolution of 16′′–17′′ to reduce the fitting uncertainty. The CH3OD lines detected by Jacq et al. (1993) were excluded because no CH3OD spectra can be used to judge the possible line-blending and data quality. Effective line strengths Sμ2 of the CH3OD lines were taken from Anderson et al. (1988), and the partition function Q = 1.41 T1.5 was used. The rotational temperature (132.4 ± 19.6 K) and column density (4.4 ± 0.3 × 1015 cm-2) were estimated by a least-squares fit (Fig. A.1), assuming a source size of 15′′. The revised CH3OD temperature and column density are consistent with those of Mauersberger et al. (1988), who derived a rotational temperature of 50–150 K and a column density of 1–5 × 1015 cm-2.
 |
Fig. A.1
Population diagrams of CH3OD and CH2DOH using the 30 m data of Mauersberger et al. (1988) and Jacq et al. (1993), respectively. The old CH2DOH effective line strengths of Jacq et al. (1993) (upper panel) and the new ones (lower panel) were used in the calculations. The beam filling factor was taken into account by assuming a source size of 15′′. The rotational temperatures and column densities were estimated by a least-squares fit, and the results and uncertainties are given in the diagrams. For CH2DOH, the red dashed line in the upper panel indicates the fit with a fixed temperature of 100 K as adopted by Jacq et al. (1993) and the one in the lower panel the fit with a temperature of 130 K (the same as the CH3OD temperature derived here). |
| Open with DEXTER | |
30 m CH3OD and CH2DOH line parameters.
CH 2 DOH
For CH2DOH, we judge that only the three detections reported by Jacq et al. (1993) can be reliably used in the population diagrams (see Table A.1). Both old CH2DOH Sμ2 values taken from Jacq et al. (1993) and new ones (see Table A.1) provided by Parise (priv. comm.) were used in the calculations (Fig. A.1). The CH2DOH partition function Q = 2.25 T1.5 and a source size of 15′′ were used here.
The new values of CH2DOH Sμ2 employed in this work are based on those tabulated in the paper by Parise et al. (2002) but a factor of three higher. This revision corrects for an inconsistency with the partition function reported by Parise et al. (2002), and some dipole moment values can be quite uncertain, which may explain the discrepancy with the values used by Jacq et al. (1993) and why they were never officially released in the JPL database. However, as shown below, both the old Sμ2 values used by Jacq et al. (1993) and new ones adopted here give similar estimates of the CH2DOH column densities in Orion BN/KL. We believe that the uncertainties of the CH2DOH Sμ2 values of our present work are not dominant in the column density calculations. Nevertheless, a new spectroscopic study of CH2DOH with a robust fitting of the Hamiltonian would definitely give better confidence in these intensities.
Using the old Sμ2, a least-squares fit to the CH2DOH data shows a low rotational temperature (about 25 ± 10 K) with a column density of 5.0 × 1014 cm-2, consistent with the first estimate of Jacq et al. (1993), who derived a rotational temperature of 34 K and a column density of 6 × 1014 cm-2. However, since the rotational temperatures derived by Menten et al. (1988) and Mauersberger et al. (1988) for CH3OH and CH3OD are about 100 K toward Orion BN/KL, Jacq et al. (1993) also adopted a higher temperature for CH2DOH. They obtained a CH2DOH column density of 3.9 × 1015 cm-2, which is 2.6 times higher than our revised value (1.6 × 1015 cm-2, see Fig. A.1 upper panel). This is because they appear to correct the beam-filling factor twice in their Nl/gl calculations and population diagram. Therefore, the CH2DOH column density derived by Jacq et al. (1993) with a temperature of 100 K was overestimated by a factor of 2–3.
With the new CH2DOH Sμ2, we derive a somewhat higher rotational temperature (40.6 ± 14.4 K) and a column density of 5.0 × 1014 cm-2 similar to that derived by using the old Sμ2. This suggests that the uncertainties in the CH2DOH effective line strengths do not strongly affect the CH2DOH column density estimate in this case.
CH 2 DOH/CH 3 OD abundance ratios
The overestimated CH2DOH column density derived by Jacq et al. (1993) leads to a higher [CH2DOH]/[CH3OD] abundance ratio (1.1–1.5) toward IRc2. The new calculation indicates that the [CH2DOH]/[CH3OD] abundance ratio is 0.2–0.5 with a source size of 15′′, assuming CH2DOH and CH3OD have the same temperature of about 130 K. For a lower CH2DOH temperature (i.e., about 40 K), the [CH2DOH]/[CH3OD] ratio is even lower (about 0.1).
In addition, the CH3OD data of Mauersberger et al. (1988) were taken at the position close to KL-W (KL-WM hereafter, Menten et al. 1988) instead of IRc2, which was used as the central position by Jacq et al. (1993). According to our CH3OD image (Fig. 3), the intensity observed toward IRc2 is about twice as high as that of KL-WM, assuming a 30 m telescope beam size of about 18′′ at 140 GHz and the same filtering. Therefore, the
CH3OD abundance in Orion BN/KL derived by Mauersberger et al. (1988) may be underestimated by 50% at most. A similar calculation (Fig. B.5) also shows that the CH3OH column density toward KL-WM is about 20% lower than that toward IRc2.
In short, we conclude that the revisited [CH2DOH]/ [CH3OD] abundance ratio derived from the previous 30 m observations is ≲ 0.6, and the [CH2DOH]/[CH3OH] abundance ratio is estimated to be 0.8–2.8 × 10⁻³ toward IRc2, by adopting a CH3OH column density of 4.7 ± 0.3 × 1017 cm-2 (Menten et al. 1988) and correcting the possible density underestimate of about 20% toward IRc2 (for a source size of 15′′).
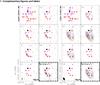 |
Fig. B.1
Left: channel maps of the CH2DOH doublet (Eup/k = 48.4 K) emission at 223 616.1 MHz for a synthesized beam of |
| Open with DEXTER | |


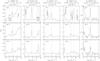 |
Fig. B.2
CH2DOH spectra toward dM-1, dM-2, and dM-3 for a synthesized beam of |
| Open with DEXTER | |
PdBI CH2DOH line parameters at dM-1, dM-2, and dM-3.
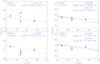 |
Fig. B.3
CH2DOH population diagrams of dM-1 and dM-2. a, b) Population diagrams of the high angular resolution data. The rotational temperatures are assumed to be 130 K and 85 K for dM-1 and dM-2, respectively. c, d) Population diagrams for the data smoothed to a resolution of |
| Open with DEXTER | |
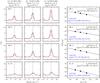 |
Fig. B.4
CH3OH spectra ( |
| Open with DEXTER | |


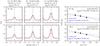 |
Fig. B.5
Similar plot as Fig. B.4. CH3OH spectra were smoothed to the 30 m beam size of 25′′ to compare with the previous 30 m observations by Menten et al. (1988). Upper panels show the CH3OH spectra and population diagram taken at the same position ( |
| Open with DEXTER | |


 |
Fig. B.6
a) Variation of derived CH3OH column densities with respect to different rotational temperatures toward dM-1. The corresponding [CH2DOH]/[CH3OH] abundance (derived in population diagrams) ratios are shown in red. The best-fit result corresponds to a CH3OH column density of 2.1 × 1018 cm-2 and a temperature of about 60 K. For temperatures lower than 200 K, the differences in the derived column densities are clearly smaller than a factor of about 3. The [CH2DOH]/[CH3OH] abundance ratios derived from different temperatures are lower than 1.1 × 10⁻³. b) Variation of the relative abundance (based on the ratio of two transitions of CH2DOH and CH3OD as seen in Fig. 3e of the two isotopologs toward dM-1 as a function of the adopted temperatures. Note that this ratio does not depend much on the temperature. |
| Open with DEXTER | |
PdBI CH3OH line parameters at dM-1, dM-2, dM-3, and KL-W.
PdBI CH3OD 5-1 − 4-1 E line parameters at dM-1, dM-2, and dM-3.
© ESO, 2012
Current usage metrics show cumulative count of Article Views (full-text article views including HTML views, PDF and ePub downloads, according to the available data) and Abstracts Views on Vision4Press platform.
Data correspond to usage on the plateform after 2015. The current usage metrics is available 48-96 hours after online publication and is updated daily on week days.
Initial download of the metrics may take a while.