Fig. B.5
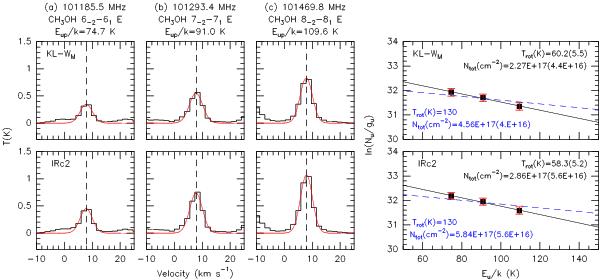
Similar plot as Fig. B.4. CH3OH spectra were smoothed to the 30 m beam size of 25′′ to compare with the previous 30 m observations by Menten et al. (1988). Upper panels show the CH3OH spectra and population diagram taken at the same position ( ,
,  , J2000) used by Menten et al. (1988) and Mauersberger et al. (1988), which is located about 5′′ to the north of KL-W (denoted as KL-WM). Lower panels show the CH3OH spectra and population diagram taken at IRc2 (
 ,
,  , J2000) used by Jacq et al. (1993). Blue dashed lines indicate the fits with a fixed temperature of 130 K. Black dashed lines indicate a VLSR of 8 km s-1. Note that the CH3OH column density derived toward KL-WM is about 20% lower than that of IRc2.
Current usage metrics show cumulative count of Article Views (full-text article views including HTML views, PDF and ePub downloads, according to the available data) and Abstracts Views on Vision4Press platform.
Data correspond to usage on the plateform after 2015. The current usage metrics is available 48-96 hours after online publication and is updated daily on week days.
Initial download of the metrics may take a while.