Fig. B.6
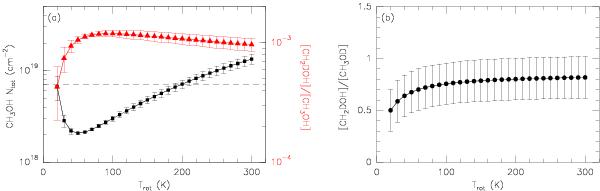
a) Variation of derived CH3OH column densities with respect to different rotational temperatures toward dM-1. The corresponding [CH2DOH]/[CH3OH] abundance (derived in population diagrams) ratios are shown in red. The best-fit result corresponds to a CH3OH column density of 2.1 × 1018 cm-2 and a temperature of about 60 K. For temperatures lower than 200 K, the differences in the derived column densities are clearly smaller than a factor of about 3. The [CH2DOH]/[CH3OH] abundance ratios derived from different temperatures are lower than 1.1 × 10⁻³. b) Variation of the relative abundance (based on the ratio of two transitions of CH2DOH and CH3OD as seen in Fig. 3e of the two isotopologs toward dM-1 as a function of the adopted temperatures. Note that this ratio does not depend much on the temperature.
Current usage metrics show cumulative count of Article Views (full-text article views including HTML views, PDF and ePub downloads, according to the available data) and Abstracts Views on Vision4Press platform.
Data correspond to usage on the plateform after 2015. The current usage metrics is available 48-96 hours after online publication and is updated daily on week days.
Initial download of the metrics may take a while.