Fig. B.3
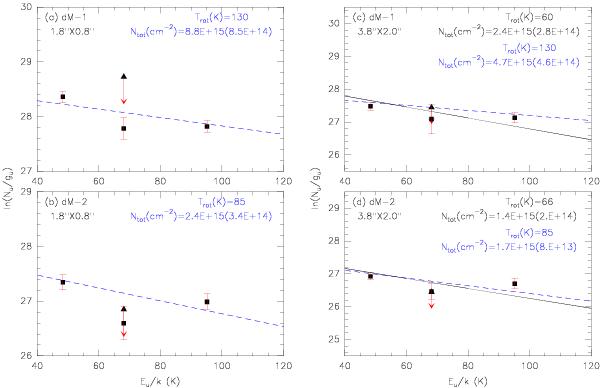
CH2DOH population diagrams of dM-1 and dM-2. a, b) Population diagrams of the high angular resolution data. The rotational temperatures are assumed to be 130 K and 85 K for dM-1 and dM-2, respectively. c, d) Population diagrams for the data smoothed to a resolution of  . Low rotational temperatures and higher ones are assumed to be 60 K and 130 K for dM-1 and 66 K and 85 K for dM-2, respectively. The fits of low temperatures are plotted in black lines and higher temperatures in blue dashed lines. The CH2DOH column densities are estimated by a least-squares fit, where the uncertainties include the statistical error, the rms noise, and calibration uncertainties (10%).
Current usage metrics show cumulative count of Article Views (full-text article views including HTML views, PDF and ePub downloads, according to the available data) and Abstracts Views on Vision4Press platform.
Data correspond to usage on the plateform after 2015. The current usage metrics is available 48-96 hours after online publication and is updated daily on week days.
Initial download of the metrics may take a while.