Fig. A.1
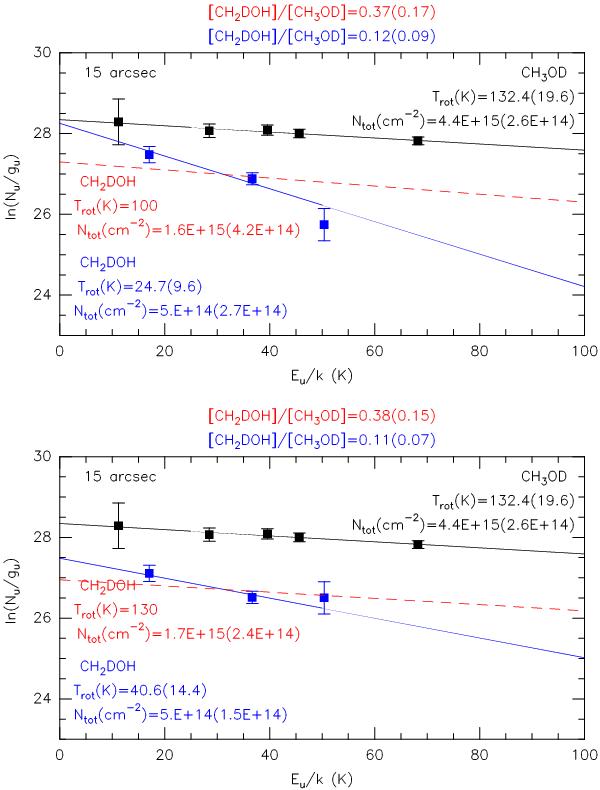
Population diagrams of CH3OD and CH2DOH using the 30 m data of Mauersberger et al. (1988) and Jacq et al. (1993), respectively. The old CH2DOH effective line strengths of Jacq et al. (1993) (upper panel) and the new ones (lower panel) were used in the calculations. The beam filling factor was taken into account by assuming a source size of 15′′. The rotational temperatures and column densities were estimated by a least-squares fit, and the results and uncertainties are given in the diagrams. For CH2DOH, the red dashed line in the upper panel indicates the fit with a fixed temperature of 100 K as adopted by Jacq et al. (1993) and the one in the lower panel the fit with a temperature of 130 K (the same as the CH3OD temperature derived here).
Current usage metrics show cumulative count of Article Views (full-text article views including HTML views, PDF and ePub downloads, according to the available data) and Abstracts Views on Vision4Press platform.
Data correspond to usage on the plateform after 2015. The current usage metrics is available 48-96 hours after online publication and is updated daily on week days.
Initial download of the metrics may take a while.