Fig. 4
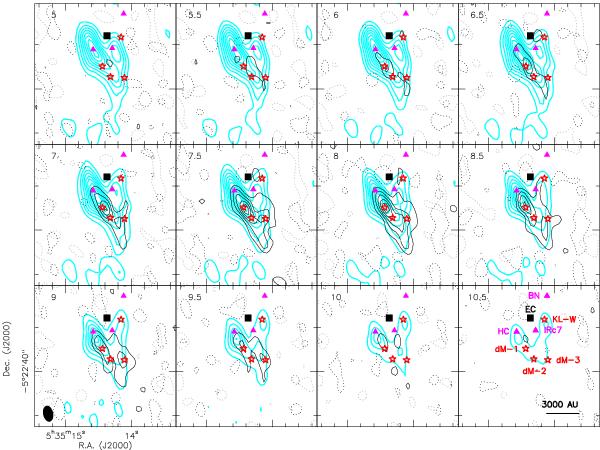
Channel maps of the CH2DOH emission at 225 878.3 MHz (Eup/k = 35.7 K) in black contours overlaid with the HDO 31,2 − 22,1 line (Eup/k = 167.6 K) at 225 896.7 MHz in light-blue contours for a synthesized beam of  . The HDO emission contours run from 10% to 90% in steps of 10% of the peak intensity (17.9 Jy beam-1), and the dashed contours represent − 0.2 Jy beam-1 (5σ). The CH2DOH emission contours run from 0.08 to 0.48 Jy beam-1 in steps of 0.08 Jy beam-1, and the black dashed contours represent –0.04 Jy beam-1 (1σ). The black square marks the explosion center according to Zapata et al. (2009). The positions of source BN, the Hot Core (HC), and IRc7 are marked by magenta triangles, and the positions of the deuterated methanol emission peaks (dM-1, dM-2, and dM-3) are marked by red stars.
Current usage metrics show cumulative count of Article Views (full-text article views including HTML views, PDF and ePub downloads, according to the available data) and Abstracts Views on Vision4Press platform.
Data correspond to usage on the plateform after 2015. The current usage metrics is available 48-96 hours after online publication and is updated daily on week days.
Initial download of the metrics may take a while.