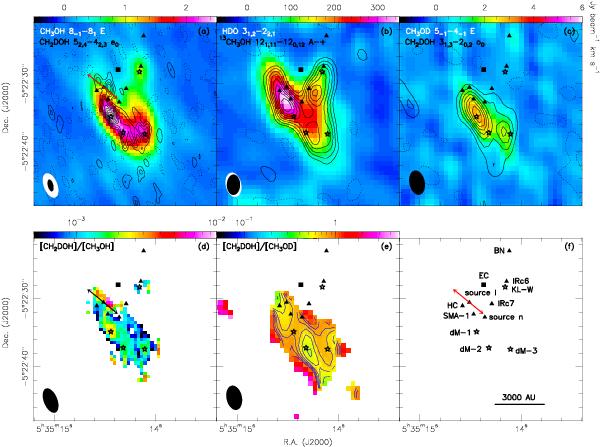
Fig. 3
a) Color image showing the integrated intensity map of the CH3OH 8-2 − 81 E line (Eup/k = 109.6 K, integrated from 5 to 11 km s-1) for a synthesized beam of  . Black contours represent the CH2DOH 52,4 − 42,3 line emission (Eup/k = 48.4 K, integrated from 5 to 11 km s-1) and run from 15% to 95% in steps of 10% of the peak intensity (1.0 Jy beam-1 km s-1) for a synthesized beam of
  . Black dashed contours correspond to –5% of the peak intensity. b) Color image showing the PdBI integrated intensity map of of the HDO 31,2 − 22,1 line (Eup/k = 167.6 K, integrated from − 8 to + 17 km s-1) for a synthesized beam of
  . Black contours represent the SMA 13CH3OH 121,11 − 120,12 A–+ emission (Eup/k = 192.8 K, integrated from 0 to 12 km s-1, Tang, priv. comm.), running from 20% to 90% in steps of 10% of the peak intensity (316.6 Jy beam-1 km s-1) for a synthesized beam of
  . Black dashed contours correspond to –10% of the peak intensity. c) Integrated intensity map of the CH3OD 5-1 − 4-1 E line (Eup/k = 37.3 K, from 5 to 11 km s-1) overlaid with the CH2DOH 31,2 − 20,2 o0 line (Eup/k = 35.7 K, integrated from 5 to 11 km s-1) in black contours for a synthesized beam of . Black contours run from 0.28 (2σ) to 1.12 Jy beam-1 km s-1 in steps of 0.14 Jy beam-1 km s-1, and black dashed contours correspond to − 0.07 Jy beam-1 km s-1. d) [CH2DOH]/[CH3OH] abundance ratio map for a resolution of . The [CH2DOH]/[CH3OD] abundance ratio is calculated by assuming the same excitation temperature (120 K) for both molecules. e) [CH2DOH]/[CH3OD] abundance ratio map for a resolution of . The [CH2DOH]/[CH3OD] abundance ratio is calculated by assuming the same excitation temperature (120 K) for both CH2DOH and CH3OD. Blue contours run from 0.4 to 1.0 in steps of 0.1. f) The black square marks the center of explosion according to Zapata et al. (2009). The positions of source BN, the Hot Core (HC), IRc6/7, and source I/n, and SMA-1 are marked by triangles. The positions of deuterated methanol emission peaks (dM-1, dM-2, and dM-3) and KL-W are marked by stars. The bipolar outflow of source I is indicated.
Current usage metrics show cumulative count of Article Views (full-text article views including HTML views, PDF and ePub downloads, according to the available data) and Abstracts Views on Vision4Press platform.
Data correspond to usage on the plateform after 2015. The current usage metrics is available 48-96 hours after online publication and is updated daily on week days.
Initial download of the metrics may take a while.