Fig. 2
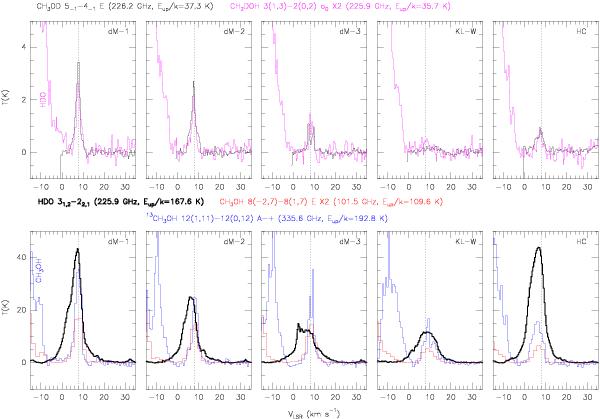
Spectrum comparison of HDO, CH3OH, 13CH3OH, CH2DOH, and CH3OD toward selected sources in Orion BN/KL with a similar resolution of about 3′′. The SMA 13CH3OH line (Tang, priv. comm.) is plotted in blue for a synthesized beam of  . The CH3OH line is plotted in red for a synthesized beam of
  . The HDO (thick black lines), CH3OD (thin black lines), and CH2DOH (magenta) lines are plotted for a synthesized beam of
  . Dotted lines indicate a VLSR of 8 km s-1. Note that the spectrum intensities of CH3OH and CH2DOH are multiplied by 2. Clearly, the spectra of methanol isotopologs have narrow line widths compared with those of HDO.
Current usage metrics show cumulative count of Article Views (full-text article views including HTML views, PDF and ePub downloads, according to the available data) and Abstracts Views on Vision4Press platform.
Data correspond to usage on the plateform after 2015. The current usage metrics is available 48-96 hours after online publication and is updated daily on week days.
Initial download of the metrics may take a while.