| Issue |
A&A
Volume 699, July 2025
|
|
|---|---|---|
| Article Number | A372 | |
| Number of page(s) | 22 | |
| Section | Extragalactic astronomy | |
| DOI | https://doi.org/10.1051/0004-6361/202554391 | |
| Published online | 25 July 2025 | |
Investigating the H I distribution and kinematics of ESO444-G084 and [KKS2000]23: New insights from the MHONGOOSE survey
1
Instituto de Astrofísica de Andalucía (CSIC), Glorieta de la Astronomía s/n, 18008 Granada, Spain
2
Wits Centre for Astrophysics, School of Physics, University of the Witwatersrand, 1 Jan Smuts Avenue, 2000, South Africa
3
Australia Telescope National Facility, CSIRO, Space and Astronomy, PO Box 76, NSW 1710, Epping, Australia
4
Western Sydney University, Locked Bag 1797, Penrith, NSW 2751, Australia
5
Aix Marseille Univ, CNRS, CNES, LAM, Marseille, France
6
Department of Astronomy, University of Cape Town, Private Bag X3, Rondebosch 7701, South Africa
7
Département de physique, Université de Montréal, Complexe des sciences MIL, 1375 Avenue Thérèse-Lavoie-Roux, & Montréal, QC H2V 0B3, Canada
8
Observatoire d’Astrophysique de l’Université Ouaga I Pr Joseph Ki-Zerbo (ODAUO), BP 7021, Ouaga 03, Burkina Faso
9
Max-Planck Institut für Radioastronomie, Auf dem Hügel 69, 53121 Bonn, Germany
10
Department of Physics and Electronics, Rhodes University, PO Box 94, Makhanda 6140, South Africa
11
Ruhr University Bochum, Faculty of Physics and Astronomy, Astronomical Institute (AIRUB), 44780 Bochum, Germany
12
Department of Physics, University of Pretoria, Hatfield, Pretoria, 0028, South Africa
13
Astrophysics Research Centre, University of KwaZulu-Natal, Durban, 3696, South Africa
14
School of Mathematics, Statistics & Computer Science, University of KwaZulu-Natal, Westville Campus, Durban 4041, South Africa
15
Centre for Astrophysics Research, University of Hertfordshire, College Lane, Hatfield, AL10 9AB, UK
16
Université de Strasbourg, CNRS, Observatoire astronomique de Strasbourg, UMR 7550, 67000 Strasbourg, France
17
Instituto de Astrofísica, Departamento de Ciencias Físicas, Universidad Andrés Bello, Fernández Concha 700, Las Condes, Santiago, Chile
18
Observatoire de Paris, Collège de France, Université PSL, Sorbonne Université, CNRS, LERMA, Paris, France
19
Netherlands Institute for Radio Astronomy (ASTRON), Oude Hoogeveensedijk 4, 7991 PD Dwingeloo, The Netherlands
20
Kapteyn Astronomical Institute, University of Groningen, PO Box 800, 9700 AV Groningen, The Netherlands
21
Department of Physics, Engineering Physics and Astronomy, Queen's University, Kingston, ON K7L 3N6, Canada
22
Department of Physics and Astronomy, University of Manitoba, Winnipeg, Manitoba R3T 2N2, Canada
23
Jodrell Bank Centre for Astrophysics, School of Physics and Astronomy, University of Manchester, Oxford Road, Manchester M13 9PL, UK
24
United Kingdom SKA Regional Centre (UKSRC), UK
25
INAF – Padova Astronomical Observatory, Vicolo dell’Osservatorio 5, I-35122 Padova, Italy
26
Department of Astronomy, Case Western Reserve University, 10900 Euclid Avenue, Cleveland, OH 44106, USA
27
Institute for Computational Cosmology, Department of Physics, Durham University, South Road, Durham DH1 3LE, UK
28
Centre for Extragalactic Astronomy, Department of Physics, Durham University, South Road, Durham DH1 3LE, UK
29
Department of Physics, Engineering Physics and Astronomy, Queen's University, Kingston, ON K7L 3N6, Canada
30
CSIRO, Space & Astronomy, PO Box 1130, Bentley WA 6102, Australia
31
International Centre for Radio Astronomy Research, The University of Western Australia, 35 Stirling Highway, Crawley, WA 6009, Australia
⋆ Corresponding author.
Received:
6
March
2025
Accepted:
1
June
2025
Abstract
We present the neutral atomic hydrogen (H I) distribution, kinematics, mass modelling, and gravitational stability of the dwarf irregular galaxies ESO444–G084 and [KKS2000]23 using high spatial, spectral, and column density sensitivity data from the MeerKAT H I observations of nearby galactic objects: Observing Southern Emitters (MHONGOOSE) survey obtained with MeerKAT. ESO444–G084 exhibits centrally concentrated H I emission, while [KKS2000]23 has irregularly distributed high-density pockets. The total H I fluxes measured down to column density thresholds of 1019 cm−2 and 1018 cm−2 are nearly the same, suggesting that the increase in the H I diameter at lower column densities is primarily due to the larger beam size, and that no significant additional emission is detected. The total H I masses are (1.1±0.1)×108 M⊙ for ESO444–G084 and (6.1±0.3)×108 M⊙ for [KKS2000]23. We derived rotation curves using 3D kinematic modelling tools Python fully automated TiRiFiC (PyFAT) and tilted ring fitting code (TiRiFiC), which allow us to fully capture the gas kinematics. Both galaxies exhibit disk-like rotation, with ESO444–G084 showing a kinematic warp beyond ∼1.8 kpc. Its relatively fast-rising rotation curve suggests a more centrally concentrated dark matter distribution, whereas [KKS2000]23's more gradual rise indicates a more extended mass distribution. Mass modelling with an isothermal halo and stellar mass-to-light ratio (M/L)3.μm*=0.20 for ESO444–G084 and 0.18 for [KKS2000]23 yields physically consistent results. We further analyse disk stability using spatially resolved maps of the Toomre Q parameter and Σgas/Σcrit, linking these with recent star formation traced by hydrogen-alpha (Hα) and far-ultraviolet (FUV) emission. ESO444–G084 supports localised star formation despite global stability, while [KKS2000]23 is gravitationally unstable yet lacks strong Hα emission, suggesting that turbulence, gas depletion, or past feedback suppresses star formation. The absence of detectable inflows or outflows implies that internal processes regulate star formation. This study highlights the interplay between H I morphology, kinematics, dark matter distribution, and disk stability, demonstrating how internal mechanisms shape dwarf galaxy evolution.
Key words: instrumentation: interferometers / Galaxy: evolution / Galaxy: kinematics and dynamics
© The Authors 2025
 Open Access article, published by EDP Sciences, under the terms of the Creative Commons Attribution License (https://creativecommons.org/licenses/by/4.0), which permits unrestricted use, distribution, and reproduction in any medium, provided the original work is properly cited.
This article is published in open access under the Subscribe to Open model. This email address is being protected from spambots. You need JavaScript enabled to view it. to support open access publication.
1. Introduction
Dwarf galaxies, despite their small size, serve as key laboratories for studying galaxy formation and evolution. Their relatively simple structures make them valuable testbeds for investigating star formation, feedback, and the interplay between baryons and dark matter (Carignan & Freeman 1988; Hunter et al. 2012). Their extended neutral atomic hydrogen (H I) reservoirs allow for detailed kinematic studies beyond the stellar disk, providing a unique opportunity to probe their gravitational potential (de Blok et al. 2001b, 2008).
An essential approach to studying the structure and dynamics of galaxies is through rotation curves (RCs), which trace the circular motion of gas or stars as a function of galactocentric radius. These curves provide fundamental insights into the mass distribution, highlighting the contributions of both baryonic and dark matter components in galaxies (Bosma 1978; Carignan & Purton 1998). The shape of a galaxy's rotation curve, whether steeply rising, flat, or declining, reveals how baryonic matter and dark matter interact. By examining these curves, one can accurately determine a galaxy's gravitational potential and overall dynamical behaviour, leading to a deeper understanding of its mass distribution (de Blok et al. 2001b).
Among the different methods for studying galaxy kinematics, neutral hydrogen observations provide a reliable approach for deriving rotation curves and probing the distribution of dark matter. Although optical tracers, such as Balmer lines from ionized hydrogen (Hα), are crucial for constraining the inner regions of rotation curves due to their high spatial resolution, they are limited to the optical disk, leaving the dark matter-dominated outskirts unexplored (de Blok et al. 2001b; Blais-Ouellette et al. 2004). On the other hand, the H I disk in galaxies extends much further into the outer regions, often well beyond the optical disk (Carignan & Freeman 1985; Koribalski et al. 2020). In these outer regions, where dark matter dominates the gravitational potential (Carignan & Freeman 1988), H I observations provide a direct means of studying the structure and kinematics of the dark matter halo.
Although rotation curves are a fundamental tool for probing mass distributions, accurately determining their shape remains challenging. Beam smearing, non-circular motions, and projection effects can distort observed velocity fields, introducing systematic uncertainties in mass modelling (Oh et al. 2008; Read et al. 2016b). Recent studies (Oman et al. 2015; Downing & Oman 2023) have demonstrated that Λ Cold Dark Matter (ΛCDM) based hydrodynamical simulations yield consistent circular velocity profiles for low mass galaxies, yet they do not capture the diversity seen in observed dwarf galaxy rotation curve shapes. In many cases, observed inner rotation speeds are lower than predicted, a discrepancy attributed either to various dynamical effects such as mergers, inflows, outflows, warps, and halo asymmetries or to systematic biases that affect the inferred kinematics.
Traditional 2D tilted ring models (Begeman 1989) have been widely used to study galaxy kinematics, but they often fail to fully correct for distortions, leading to rotation curve shapes that do not accurately reflect the true underlying circular velocities (de Blok et al. 2008; Swaters et al. 2003). To overcome these limitations, advanced 3D kinematic modelling techniques such as the tilted ring fitting code (TiRiFiC; Józsa et al. 2007) and 3D-based analysis of rotating bbjects from line observations (3D Barolo; Di Teodoro & Fraternali 2015) have been developed. These methods utilize the complete data cube-including detailed line profiles and intensity distributions to correct for beam smearing. They also incorporate extra parametric components to explicitly model non-circular motions, including radial flows and warps. Although these techniques still assume a locally axisymmetric disk, they represent a significant improvement over 2D approaches in constraining the kinematics of galaxies.
Understanding the kinematics of dwarf galaxies is also critical for assessing their gravitational stability and star formation processes. The stability of a galaxy's disk is often characterized using the Toomre Q parameter, which measures the susceptibility of the gas to collapse and form stars (Toomre 1964). Dwarf galaxies typically exhibit low gas surface densities, making them marginally stable or even gravitationally unstable in certain regions (Elmegreen & Hunter 2015). Since H I serves as both a tracer of galaxy kinematics and a reservoir for future star formation, linking disk stability analyses with rotation curve modelling provides a more complete picture of how gas dynamics, gravitational instabilities, and dark matter influence the evolution of dwarf galaxies (Elson et al. 2012; Ghosh & Jog 2018).
The MeerKAT H I observations of nearby galactic objects: Observing Southern Emitters (MHONGOOSE) survey (de Blok et al. 2024), one of the MeerKAT Large Survey Projects, provides an unprecedented opportunity to study the kinematics and mass distribution of dwarf galaxies. Building upon previous surveys such as The H I Nearby Galaxy Survey (THINGS; Walter et al. 2008), Local Irregulars That Trace Luminosity Extremes, The H I Nearby Galaxy Survey (LITTLE-THINGS; Hunter et al. 2012), and Local Volume H I Survey (LVHIS; Koribalski et al. 2018), MHONGOOSE offers significantly improved velocity resolution, making it ideal for capturing fine-scale kinematic structures and resolving asymmetries at sub-kiloparsec scales. Furthermore, its high sensitivity to low-column-density gas (NHI<1019 cm−2), allows the detection of extended H I structures well beyond the optical disk. Preliminary results from the MHONGOOSE survey have already demonstrated the power of high-sensitivity H I observations in detecting extended gas distributions and resolving kinematic asymmetries at sub-kiloparsec scales (Veronese et al. 2025; Healy et al. 2024; de Blok et al. 2020). These advances are crucial for distinguishing between different dark matter halo profiles and probing the outer regions of dwarf galaxies, where dark matter dominates even more significantly, making its intrinsic properties more apparent.
This study focuses on ESO444–G084 and [KKS2000]23, two gas-rich, isolated dwarf galaxies with well-resolved H I kinematics and extended gas distributions, making them ideal candidates for detailed mass modelling. Their isolation minimizes environmental effects, enabling a clearer analysis of internal kinematics, disk stability, and dark matter distribution. By examining their H I morphology, kinematics, rotation curves, and mass models, we investigate how gas dynamics shape their evolution and influence star formation. The structure of this paper is as follows: Section 2 describes the sample selection; Section 3 details the observations and data reduction process; Section 4 presents the H I morphology and distribution; Section 5 discusses kinematics and rotation curve derivation; Section 6 explores mass modelling; Section 7 details the gravitational instability and star formation and Sections 8 and 9 provide discussion and conclusions, respectively.
2. The galaxy sample
The MHONGOOSE sample consists of 30 nearby star-forming main sequence galaxies, providing a representative set for studying typical star formation processes (de Blok et al. 2024). The sample covers a broad range of stellar and H I masses (∼106–1011 M⊙) and includes both disk galaxies and dwarf systems. The galaxies are situated at distances of 3–23 Mpc, spanning a range of inclination angles from nearly face-on to edge-on, offering a diverse selection for kinematic and structural analysis. The survey achieves a 3σ column density sensitivities down to ∼1017 cm−2 at 90″ resolution and ∼1019 cm−2 at 7″ resolution, with a velocity resolution of 1.4 km s−1. This study focuses on two MHONGOOSE dwarf galaxies, ESO444–G084 and [KKS2000]23, which were the first dwarfs in the MHONGOOSE sample to be observed with the full 50-hour integration time. Additionally, these galaxies were prioritized due to their well-resolved H I kinematics, extended gas distributions, and their importance for detailed mass modelling. A comprehensive overview of the MHONGOOSE sample selection and survey methodology is provided in de Blok et al. (2024).
In addition to the MeerKAT H I observations, this study makes use of publicly available, multi-wavelength ancillary data to provide a more comprehensive view of the galaxy properties. Far-ultraviolet (FUV) images were obtained from the Galaxy Evolution Explorer (GALEX) data release (Martin et al. 2005) and optical images were taken from the Dark Energy Camera Legacy Survey (DECaLS) survey (Dey et al. 2019). Mid-infrared data from the Wide-field Infrared Survey Explorer (WISE) were provided through private communication. Hα images for both galaxies were accessed via the NASA/IPAC Extragalactic Database (NED)1, with ESO444–G084 data from Dale et al. (2009) and from [KKS2000]23 Meurer et al. (2006). These multi-wavelength datasets, all openly available online, are used to trace star formation activity, stellar structure, and ionized gas, complementing the high-resolution H I kinematics provided by the MHONGOOSE survey.
2.1. ESO444–G084 (HIPASS J1337–28)
ESO444–G084 is a dwarf irregular (dIrr) galaxy located at a distance of 4.6 ± 0.4 Mpc, based on the tip of the red giant branch (TRGB) method (Karachentsev et al. 2002). It is one of several dwarf companions surrounding the massive spiral galaxy M 83. Classified as an Im galaxy (de Vaucouleurs et al. 1991), ESO444–G084 has a total B-band magnitude of 15.06 (Karachentsev et al. 2002). The galaxy's H I distribution was mapped by Côté et al. (2000) using the Australia Telescope Compact Array (ATCA), revealing a symmetric extended H I disk with significant warping in its velocity field. The heliocentric velocity was measured at 588 km s−1. The H I flux density was found to be 21.1 ± 3.2 Jy km s−1, which corresponds to an H I mass of 1.1 × 10⁸ M⊙ at the adopted distance of 4.6 Mpc (Karachentsev et al. 2002). These results are consistent with those of Koribalski et al. (2018), who studied ESO444–G084 as part of the Local Volume HI Survey (LVHIS). The rotation curve derived by Côté et al. (2000) shows a maximum velocity of ∼60 km s−1 at a radius of 3.2 kpc, and a very high dark-to-luminous mass ratio, with a dark matter fraction over 90% within the last measured point. A summary of the key properties of ESO444–G084 is provided in Table 1.
Basic properties of ESO444–G084 and [KKS2000]23.
2.2. [KKS2000]23 (HIPASS J1106–14)
Located at a distance of 13.9 Mpc (Tully et al. 2016), the dwarf galaxy [KKS2000]23 was first identified by Karachentsev et al. (2000) in a search for low surface brightness (LSB) objects. A chain of H II regions in its northern region was later detected through Hα imaging by Whiting et al. (2002). The first H I spectrum was obtained by Huchtmeier et al. (2001) using the Effelsberg 100-m Radio Telescope, measuring an H I flux density of 11.9 Jy km s−1 and a systemic velocity of 1041 km s−1. These values were confirmed by Ryan-Weber et al. (2002) and Koribalski et al. (2004), with an estimated H I mass of 7.1×10⁸ M⊙. Observations using the Green Bank Telescope (GBT) by Sorgho et al. (2019) revealed an H I extent of 15.1 arcmin and an H I flux of 11.1±0.4 Jy km s−1. Previous studies classified [KKS2000]23 as having one of the lowest Hα-based star formation rates (SFRs) in its sample (Meurer et al. 2006). However, it is not the most passive galaxy in the SINGG survey, emphasizing that Hα probes recent star formation on short timescales (1–3 Myr), whereas FUV traces star formation over longer periods (100 Myr). A summary of the key properties of [KKS2000]23 is provided in Table 1.
3. MeerKAT observations and data reduction
The 21-cm H I observations were carried out using the MeerKAT telescope (Jonas & MeerKAT Team 2016; Camilo et al. 2018) as part of the MHONGOOSE survey (de Blok et al. 2024). Each target was observed for a total integration time of 50 hours, achieving a final spectral resolution of 1.4 km s−1 after averaging over two channels. Data reduction was performed using the CARACal pipeline, the detailed procedure for which is described in de Blok et al. (2024).
For each galaxy, six data cubes were generated, covering spatial resolutions from 7″ to 90″. The corresponding 3σ column density sensitivity ranges from 5.9×1019 cm−2 to 5.8×1017 cm−2 over a velocity range of 16 km s−1. The observational parameters for ESO444–G084 and [KKS2000]23 are summarized in Table 2.
Parameters of the MeerKAT observations and properties of the highest and lowest resolution data cubes.
4. H I morphology and distribution
The results in this section are highlighted in Figs. 1, 2, 3 and 4. Fig. 1 presents the H I column density maps of ESO444–G084 and [KKS2000]23, derived from data cubes at different spatial resolutions. The lowest H I contour at each resolution, corresponding to S/N = 3, is shown. Contours are colour-coded and overlaid on deep greyscale images composed of gri bands from the Dark Energy Camera Legacy Survey (DECaLS; Dey et al. 2019)2. The H I contours expand smoothly with increasing sensitivity. However, we find that the increase in H I diameter from low (∼1019 cm−2) to high (∼1018 cm−2) column densities does not significantly impact the total fluxes of the galaxies (see Table 3). This suggests that the increase in H I diameter at lower column densities is primarily due to the larger beam size, with no indication of significant additional emission.
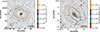 |
Fig. 1. MeerKAT H I column density contours from different H I resolution cubes of ESO444–G084 (left) and [KKS2000]23 (right) are overlaid on DECaLS greyscale images in the gri bands. Each contour level represents the H I column density at S/N = 3 for each spatial resolution. The colour bar values indicate the average beam size corresponding to each spatial resolution. The ellipses in the lower-left corner of each map denote the beam sizes at different resolutions, while the black horizontal line represents the scale in kpc. |
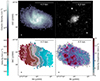 |
Fig. 2. High-resolution maps of ESO444–G084. Top left: H I column density maps from the highest resolution cubes. Top right: GALEX FUV images. Bottom left: velocity field models (pink contours) and observed (white contours) overlaid on velocity field maps (observed). Bottom right: dispersion map models (pink contours) overlaid on the data. The velocity field and dispersion map models were derived from the kinematic analysis described in Section 5. Contours for the velocity field are set at 526.7, 541.7, 556.7, 571.7, 586.7, 601.7, 616.7, 631.7, and 646.7 km s−1, and contours for the velocity dispersion are set at 5, 7, 8, 10, and 12 km s−1. The ellipses in the lower right corner of each map represent the beam sizes. |
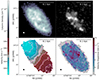 |
Fig. 3. High-resolution maps of [KKS2000]23. Top left: H I column density maps from the highest resolution cubes. Top right: GALEX FUV images. Bottom left: velocity field models (pink contours) and observed (white contours) overlaid on velocity field maps (observed). Bottom right: dispersion map models (pink contours) overlaid on the data. The velocity field and dispersion map models were derived from the kinematic analysis described in Section 5. Contours for the velocity field are set at 980.9, 994.7, 1008.4, 1022.2, 1035.9, 1049.7, 1063.4, 1077.2, and 1090.9 km s−1, and contours for the velocity dispersion are set at 5, 7, 8, 10, and 12 km s−1. The ellipses in the lower right corner of each map represent the beam sizes. |
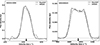 |
Fig. 4. Integrated H I spectra of ESO444–G084 (left) and [KKS2000]23 (right) from MeerKAT (black solid line) and HIPASS (black dashed line, Koribalski et al. 2004). The black arrow on each figure shows the kinematic systemic velocity of each galaxy derived in Section 5. The horizontal dashed grey lines indicate the zero level. These profiles are derived from the high-resolution data. |
Basic H I Properties of ESO444–G084 and [KKS2000]23 at different angular resolutions and column density sensitivities.
4.1. ESO444–G084
The highest-resolution H I column density map of ESO444–G084, presented in Fig. 2, highlights a smooth gas distribution with high column density regions concentrated near the centre of the galaxy. Distinct spiral arm structures are visible in the H I morphology. The far-ultraviolet (FUV) emission from GALEX (Martin et al. 2005) as shown in Fig. 2 overlaps with the high-density H I regions. Additionally, Fig. 2 includes velocity and velocity dispersion maps derived from the kinematic analysis, which will be discussed further in Section 5.
Using the highest-resolution maps, we quantified the H I effective diameter by applying a surface density threshold of 1 M⊙ pc−2, which is equivalent to a column density threshold of 1.24×1020 cm−2. Along the major axis, the effective H I diameter was measured as 6.5 kpc (4 9). Following the methodology outlined in Chamba et al. (2024), we estimated the optical diameter of ESO444-G084 using the concept of a 'stellar edge’, rather than relying on a fixed isophotal threshold such as the traditional D25. This approach defines the outer limit of the stellar disk based on features in the surface brightness and colour profiles-specifically, a flattening or break in the light profile and a significant change in the g−r colour, which may indicate a transition in stellar populations or a truncation of the stellar disk. We constructed smoothed g- and r-band surface brightness profiles from DECaLS DR10 imaging, using elliptical annuli aligned with the galaxy's kinematic parameters. A clear inflection point was identified near a semi-major axis where the g−r colour profile shows a distinct reddening and the surface brightness profiles begin to flatten. Based on this, we adopt a stellar edge diameter of Dstellar = 0.94 kpc for ESO444-G084. This yields an H I-to-optical size ratio of ∼6.9.
The primary beam-corrected global H I profile of ESO444–G084 is shown in Fig. 4. The profile shows a symmetric shape. The total H I flux integrated from the profile is 21.2±0.2 Jy km s−1, which is consistent with the single-dish value of 21.1±3.2 Jy km s−1 (Koribalski et al. 2004; de Blok et al. 2024). At a distance of 4.6 Mpc, this flux corresponds to an H I mass of (1.1±0.1)×108 M⊙. The profile widths at the 20% and 50% flux levels, determined using the GIPSY task profglob, are 76.3±1.18 km s−1 and 55.8±2.1 km s−1, respectively. A summary of the MeerKAT H I properties of ESO444–G084 is provided in Table 4.
MeerKAT H I properties of ESO444–G084 and [KKS2000]23.
4.2. [KKS2000]23
Fig. 3 presents the highest-resolution H I column density map of [KKS2000]23. The map reveals a more fragmented distribution with localized high-density regions scattered across the disk. These regions align closely with the bright FUV emission in the GALEX maps (Martin et al. 2005) shown in Fig. 2. The velocity and dispersion maps included in Fig. 2 will be analysed in detail in Section 5.
To characterize the H I distribution, we calculated the effective H I diameter from the highest-resolution maps by using the method described above. The H I effective diameter was measured as 16.0 kpc (4 0). Based on the method used to determine the stellar edge of ESO444-G084, we estimated a stellar diameter of 2.83 kpc for [KKS2000]23. This yields an H I-to-optical size ratio of approximately 1.7.
The primary beam corrected global H I profile of [KKS2000]23 is shown in Fig. 4. The profile displays a notable asymmetry, with a higher H I mass on the approaching side. The integrated flux derived from the H I profile is 12.3±0.1 Jy km s−1, consistent with de Blok et al. (2024), but 13% lower than the GBT value of 14.2 Jy km s−1 (Sardone et al. 2021). The discrepancy may result from the reported noise in the GBT spectra, which made it challenging to determine if the low column density gas was real emission or simply artefacts from the observations. At a distance of 13.9 Mpc, the measured flux corresponds to an H I mass of (6.1±0.3)×108 M⊙. The velocity widths at the 20% and 50% flux levels, calculated using the GIPSY task profglob, were measured as 94.2±0.92 km s−1 and 79.7±1.4 km s−1, respectively. A summary of the MeerKAT H I properties of [KKS2000]23 is provided in Table 4.
5. H I kinematics
To examine both the inner and outer kinematics of ESO444–G084 and [KKS2000]23, we derived the rotation curves by fitting tilted-ring models to the highest resolution (∼8″) and mid-resolution (∼23″) 3D data cubes using PyFAT (Kamphuis 2024) and TiRiFiC (Józsa et al. 2012).
PyFAT (Python fully automated TiRiFiC) is a Python wrapper for TiRiFiC that automates the fitting of tilted-ring models. The tilted-ring model is a widely used method for modelling the kinematics of disk galaxies by dividing the gas disk into concentric rings, each characterized by parameters such as rotation velocity, inclination, and position angle. PyFAT initially assumes a flat-disk model, meaning that the inclination and position angle remain constant across all rings, representing a uniformly rotating disk with no significant warps or distortions. This simplification works well for symmetric disks but may not fully capture more complex kinematic structures and may fail for galaxies with complicated kinematics. To run PyFAT, the only required input is the 3D data cube, from which the code automatically extracts initial kinematic parameters and iteratively fits a tilted-ring model across the disk. In the case of [KKS2000]23, PyFAT produced a reasonable kinematic model, successfully capturing the overall velocity structure of the galaxy. However, PyFAT generates a single axisymmetric rotation curve that averages the approaching and receding sides of the disk. In this study, our aim is to analyse the shapes of the rotation curves for the approaching and receding sides separately, leading to an additional modelling step using TiRiFiC.
For ESO444–G084, PyFAT did not converge to a satisfactory solution, likely due to its complex velocity field, which caused the initial flat-disk assumption to produce a poor fit, a result that was also reported in Kamphuis et al. (2015). To refine the model, we used TiRiFiC in standalone mode. We began with the simplest possible configuration, assuming constant inclination and position angle across all rings. After visually inspecting the model and comparing it with the observations, we performed multiple iterations, introducing variations in key parameters by either fixing or allowing radial changes in position angle and inclination, while also incorporating radial motions where needed. The best-fit model was obtained with a position angle and inclination that remained fixed in the central regions but varied at larger radii. At each stage, we evaluated the fit by comparing the model channel maps, moment maps, and position-velocity diagrams with the data, and it was accepted when it reproduced the large-scale H I morphology and kinematics without introducing systematic mismatches. The gas disk was modelled using two distinct components fitted separately, with the exception of the velocity dispersion, which was treated as a single component to ensure a well-constrained model. Interpolation was applied to maintain smooth transitions between adjacent rings, minimizing artificial fluctuations in the rotation curves.
5.1. Pressure gradient correction
Due to the gravitational interaction of gas on circular orbits, the stability of a galaxy against gravitational collapse is maintained by both rotation and pressure gradients. As a result, the observed rotation velocities are typically lower than the true circular velocities associated with the gravitational potential. To accurately trace the mass distribution of galaxies, we apply a pressure gradient correction3 to the derived rotation velocities following Meurer et al. (1996),
 (1)
(1)
where σD represents the asymmetric drift, given by
![Mathematical equation: $$ \sigma ^{2}_{D} = -R b^{2} \Bigg [\frac {\partial \ln \Sigma _{g}}{\partial R} + 2\frac {\partial \ln b}{\partial R} - \frac {\partial \ln h_{z}}{\partial R} \Bigg ]. $$](/articles/aa/full_html/2025/07/aa54391-25/aa54391-25-eq7.gif) (2)
(2)
Here, Vc is the circular velocity, Vrot is the rotational velocity, Σg is the H I surface density including helium, R is the radius, and b is the velocity dispersion. The velocity dispersion values are derived from PyFAT and TiRiFiC. The asymmetric drift is computed under the assumption that the scale height gradient is negligible, i.e.  . Fig. 5 shows the corrected circular velocities, and Tables 5 and 6 present the asymmetric drift-corrected rotation curves for ESO444–G084 and [KKS2000]23, respectively.
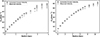 |
Fig. 5. Observed rotation curves (grey) and asymmetric drift-corrected rotation curves (black) for ESO444–G084 (left) and [KKS2000]23 (right). |
Derived rotation velocities (Vrot) of ESO444–G084 and asymmetric drift-corrected velocities (Vc) with associated errors (Verrors).
Derived rotation velocities (Vrot) of [KKS2000]2 and asymmetric drift-corrected velocities (Vc) with associated errors (Verrors).
5.2. Kinematic results
The highest-resolution cubes provides a reliable determination of the H I rotation curve out to ∼2.8 kpc for ESO444–G084, whereas the mid-resolution cubes allowed for an extended measurement out to ∼3.8 kpc, capturing additional kinematic information. For [KKS2000]23, the highest-resolution data constrained the rotation curve to ∼7.8 kpc, whereas the lowest-resolution cubes enabled its extension to ∼10.2 kpc, offering a more comprehensive view of the galaxy's outer dynamics. The findings in this section are presented in Figs. 2, 3, 6, 7, 8, 9, 10 and 11.
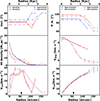 |
Fig. 6. Best-fit kinematic parameters of ESO444–G084 derived from the H I data cube using TiRiFiC. The panels display inclination angle, position angle, H I surface density, radial velocity, and rotation velocity. The blue and red lines correspond to the approaching and receding sides, respectively. The dashed line represents high resolution, while the dotted line represents mid-resolution. The black arrows represent the 90th percentile stellar radius obtained from the WISE 3.4 μm band surface brightness profile. |
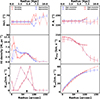 |
Fig. 7. Best-fit kinematic parameters of [KKS2000]23 derived from the H I data cube using PyFAT and TiRiFiC. The panels display inclination angle, position angle, H I surface density, radial velocity, and rotation velocity. The blue and red lines correspond to the approaching and receding sides, respectively. The dashed line represents high resolution, while the dotted line represents mid-resolution. The black arrows represent the 90th percentile stellar radius obtained from the WISE 3.4 μm band surface brightness profile. |
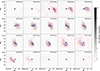 |
Fig. 8. Individual channel maps of ESO444-G084 from the MeerKAT high-resolution cube. Blue contours represent the channel maps from the 3D modelling, while the red contours show the observed data. Contour levels denote values of (3, 6, 9, 12)×σ. Black crosses represent the kinematic centre of the observed data. |
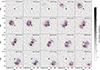 |
Fig. 9. Individual channel maps of [KKS2000]23 from the MeerKAT high-resolution cube. Blue contours represent the channel maps from the 3D modelling, while the red contours show the observed data. Contour levels denote values of (3, 6, 9, 12)×σ. Black crosses represent the kinematic centre of the observed data. |
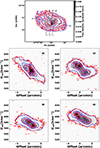 |
Fig. 10. Top: moment-0 map of ESO444-G084 from the MeerKAT high-resolution cube, displaying grey arrows that indicate the positions of slices along which the position–velocity diagrams (bottom) were extracted. The arrows indicate the locations of the PV slices, with one aligned along the kinematic major axis (A) to capture the bulk of rotational motion and another along the minor axis (B) to examine deviations from pure rotation. Additional slices (C and D) were chosen to explore variations in the H I kinematics and overall disk structure. The red contours represent the data, while the blue contours represent the model. The contour levels are set at (3, 6, 9, 15, 18) × σ. |
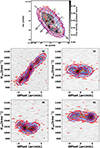 |
Fig. 11. Top: moment-0 map of [KKS2000]23 from the MeerKAT high-resolution cube, displaying grey arrows that indicate the positions of slices along which the position–velocity diagrams (bottom) were extracted. The arrows indicate the locations of the PV slices, with one aligned along the kinematic major axis (A) to capture the bulk of rotational motion and another along the minor axis (B) to examine deviations from pure rotation. Additional slices (C and D) were chosen to explore variations in the H I kinematics and overall disk structure. The red contours represent the data, while the blue contours represent the model. The contour levels are set at (3, 6, 9, 15, 18) × σ. |
5.2.1. ESO444–G084
The bottom-left panel of Fig. 2 presents the observed and model velocity fields of ESO444–G084. The central region does not exhibit strictly parallel and symmetric isovelocity contours. These contours also lack the significant S-shaped or X-shaped distortions that are typically associated with bar-like structures (e.g. Athanassoula & Bureau 1999). To explore the possibility of a bar, we incorporated a bar component into the kinematic modelling using the method prescribed in4; however, the results did not provide strong evidence for a significant bar. This suggests that ESO444–G084 is unlikely to host a prominent bar, and the observed central kinematics may instead be influenced by mild radial motions or weak non-circular gas flows. In the outer disk, a change in the position angle of the velocity gradient is apparent, suggesting the presence of a kinematic warp.
From the highest-resolution model, the dynamical centre was determined at α,δ (J2000) = 13h37m19.8s,−28°02m46.4s, consistent with the optical centre (Table 1). The derived systemic velocity of 586.0±2.1 km s−1 closely matches the 586.7 km s−1 reported by de Blok et al. (2024). Using the profiles in Fig. 6, we adopted an average inclination of 49.0±1.2° and a position angle of 90.0±2.4°.
The rotation curve exhibits a gradual rise in the inner region (R<2 kpc) rather than the steep, abrupt increase expected for an NFW-like halo. This shape is characteristic of a system dominated by rotational motion. The radial velocity profile in Fig. 6 reveals significant non-circular motions in the inner regions, reaching up to ∼20 km s−1. These deviations are possibly linked to weak inflows or minor warps. Beyond ∼3 kpc, these radial motions gradually diminish, marking a transition to a more rotation-dominated outer disk.
The channel maps in Fig. 8 and the PV diagrams in Fig. 10 show good agreement between the observed data and the kinematic model across the disk. This agreement suggests that the model effectively captures the large-scale kinematics of the galaxy, with only minor deviations in localized regions. The summary of the kinematic results is shown in Table 7.
Kinematic properties of ESO444–G084 and [KKS2000]23.
5.2.2. [KKS2000]23
The bottom-left panel of Fig. 3 shows the velocity field of [KKS2000]23, which exhibits smooth, well-ordered isovelocity contours, suggesting a coherent rotation pattern. The transition from blue-shifted to red-shifted velocities follows a clear gradient, indicative of a regularly rotating disk. There are no obvious kinematic twists, strong distortions, or significant asymmetries that would suggest major disturbances from external interactions.
Using the highest-resolution model, we derived a systemic velocity of 1038.0±0.3 km s−1, close to the value of 1035.9 km s−1 reported by de Blok et al. (2024). The dynamical centre, determined at α,δ (J2000) = 11h06m11.8s,−14°24m10.5s. We find a slight offset between the optical and kinematic centres of KKS2000-23. As shown in Fig. 7, the position angle and inclination remain relatively stable across the disk, with an average inclination of 62.0±1.0° and a position angle of 224.0±2.0°.
[KKS2000]23 exhibits a more gradual rise in its rotation curve, continuing to increase in the outer regions, suggesting a more extended and diffuse dark matter distribution. The radial velocity residuals for [KKS2000]23 remain below approximately 6 km s−1 across most of the disk. The channel maps in Fig. 9 and PV diagrams in Fig. 11 show good agreement between the model and observed data. The summary of the kinematic results is shown in Table 7.
6. Mass modelling
Under the assumption of axisymmetry and dynamical equilibrium, the circular velocity reflects the total gravitational potential of a galaxy, which includes contributions from gas, stars, and dark matter. To determine the dark matter distribution in ESO444–G084 and [KKS2000]23, we decompose the observed circular velocities into separate dynamical components using:
 (3)
(3)
where Vc is the circular velocity, Vgas represents the velocity contribution from the gas mass distribution, Vdisk corresponds to the stellar disk, and Vhalo represents the velocity associated with the dark matter halo density distribution. The contributions from gas and stars are computed using the methods described below.
6.1. Stellar component
We use the WISE5, (Wright et al. 2010) 3.4-micron surface brightness profiles to calculate the stellar mass distribution. At this wavelength, the light is less affected by dust, allowing us to probe the older stellar disk population and obtain a more accurate estimate of the stellar mass. These profiles were provided by Prof. Tom Jarrett (priv. comm.). Following the method outlined in Oh et al. (2015), the stellar surface brightness profiles in mag arcsec−2 were converted to luminosity densities in L⊙ pc−2 and then to mass densities using the equation
![Mathematical equation: $$ \Sigma \, [M_{\odot } \, {\mathrm {pc}}^{-2}] = (M/L)^{*}_{3.4\,\upmu {\mathrm {m}}} \times 10^{-0.4 (\mu _{3.4\,\upmu {\mathrm {m}}} - C_{3.4\,\upmu {\mathrm {m}}})}, $$](/articles/aa/full_html/2025/07/aa54391-25/aa54391-25-eq10.gif) (4)
(4)
where  is the stellar mass-to-light ratio in the 3.4-micron band, μ3.4 μm is the surface brightness in mag arcsec−2, and C3.4 μm is a conversion constant that relates mag arcsec−2 to L⊙ pc−2. The conversion constant is calculated as
 (5)
(5)
where M⊙,3.4 μm = 3.24 represents the absolute magnitude of the Sun in the 3.4-micron band. The GIPSY task ROTMOD was then used to convert the stellar surface density profile into a rotation curve. ROTMOD assumes that the stellar component forms an infinitely thin, axisymmetric disk and numerically solves Poisson's equation to calculate the gravitational potential generated by the stellar mass distribution. The task then derives the circular velocity at each radius by computing the radial derivative of this potential, thereby translating the observed stellar density into the corresponding circular velocity needed to support the disk. To estimate the mass-to-light ratio, we employed two approaches: 1) WISE-based estimation: the mass-to-light ratio using the WISE surface brightness and the empirical relation from Cluver et al. (2014), given by the following equation
 (6)
(6)
where W3.4 μm−W4.6 μm = 0.36 for [KKS2000]23 and 0.32 for ESO444–G084. 2) Adopted literature value: As an alternative approach, we adopted a fixed mass-to-light ratio of  , a commonly used value reported in the literature (Lelli et al. 2016).
6.2. Gas component
The contribution of the gaseous disk to the rotation curve was determined using the H I surface brightness profiles shown in Fig. 6 and Fig. 7. The H I surface densities were derived from the 3D kinematic modelling described in Section 5. To account for the presence of helium, the surface densities were scaled by a factor of 1.4. This correction factor is widely adopted in galaxy mass modelling (e.g. Leroy et al. 2008; Walter et al. 2008; de Blok et al. 2008; Begum et al. 2008; Oh et al. 2015). The corresponding gas rotation velocities were then computed using the ROTMOD task in GIPSY. Here, we ignore molecular gas and include only H I and helium in the gas component. This approach is justified given that dwarf galaxies such as ESO444-G084 and [KKS2000]23 typically have very low molecular gas content, with CO detections often weak or absent (e.g. Schruba et al. 2012). Several previous mass modelling studies of dwarf and low-mass galaxies also exclude molecular gas for this reason (e.g. de Blok et al. 2008; Oh et al. 2015).
6.3. Dark matter halo
Over the past three decades, numerous dark matter halo models have been developed, reflecting advances in galaxy dynamics and cosmological simulations. High-resolution simulations incorporating baryonic processes such as supernova feedback, gas outflows, and star formation suggest that these mechanisms can reshape central dark matter distributions, potentially transforming cuspy halos into core-like structures (Read & Gilmore 2005; Pontzen & Governato 2012).
Alternative dark matter models have also gained attention in recent years. Self-interacting dark matter (SIDM) suggests non-negligible interactions between dark matter particles, naturally leading to core-like density profiles (Spergel & Steinhardt 2000; Rocha et al. 2013). Fuzzy dark matter (FDM), composed of ultra-light axions, predicts wave-like effects that suppress small-scale structure formation and produce cored profiles (Hu et al. 2000; Niemeyer 2020). These models provide testable predictions that extend beyond the standard ΛCDM framework.
Given the increasing evidence for core-like dark matter distributions, particularly in low-mass galaxies, the pseudo-isothermal (ISO) model remains a useful benchmark for describing observed rotation curves. The ISO model provides a simple representation of galaxies with constant-density cores (Begeman et al. 1991). This model has been widely used in mass modelling studies due to its ability to match the observed kinematics of dwarf galaxies and low surface brightness (LSB) galaxies, where cuspy profiles often fail (Flores & Primack 1994; Oh et al. 2011). Moreover, the ISO profile serves as a limiting case when testing alternative halo models, allowing for direct comparisons between core-forming mechanisms driven by baryonic feedback or self-interacting dark matter. In this study, we adopt the pseudo-isothermal model as an observationally motivated profile to describe the dark matter distribution in ESO444–G084 and [KKS2000]23.
The density profile of the isothermal halo model with a constant-density core is given by
 (7)
(7)
where ρ0 is the core density and rc is the core radius of the halo. The corresponding circular velocity is given by
![Mathematical equation: $$ V_{{\mathrm {iso}}} (r) = \sqrt {4\pi \rho _{0} r_{\mathrm {c}}^{2} \left [1 - \frac {r_{\mathrm {c}}}{r} \tan ^{-1} \left (\frac {r}{r_{\mathrm {c}}}\right )\right ]}. $$](/articles/aa/full_html/2025/07/aa54391-25/aa54391-25-eq16.gif) (8)
(8)
The total dark matter mass enclosed within a given radius r can be computed by integrating the density profile. For the pseudo-isothermal halo, the enclosed mass is given by
![Mathematical equation: $$ M_{{\mathrm {halo}}}(r) = 4\pi \rho _{0} r_{\mathrm {c}}^{3} \left [\frac {r}{r_{\mathrm {c}}} - \tan ^{-1} \left (\frac {r}{r_{\mathrm {c}}} \right )\right ]. $$](/articles/aa/full_html/2025/07/aa54391-25/aa54391-25-eq17.gif) (9)
(9)
The fitted parameters ρ0 and rc are obtained from the rotation curve decomposition using the best-fit ISO model, and r represents the maximum radius reached by the observed rotation curve.
6.4. Constructing the mass models and results
The dark matter halo was modelled within ROTMAS using the ISO halo profile. This profile is characterized by two free parameters: the core radius (rC) and the central density (ρ0). The fitting procedure involved keeping the baryonic contributions fixed according to the assumed stellar mass-to-light ratio (M/L)* while adjusting the dark matter distribution to match the observed rotation curve. Uncertainties in the observed rotation curve were propagated through the fitting process, and the quality of the fits was assessed using the reduced chi-square statistic ( ). The results in this section are shown in Figs. 12 and 13.
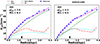 |
Fig. 12. Isothermal (ISO) mass modelling results for ESO444–G084. The decomposition for both galaxies was performed under two different assumptions of the mass-to-light ratio, as indicated in each panel. The blue circles represent the derived rotation curve, while the magenta lines show the fitted rotation curve. The green dashed lines indicate the dark matter contribution to the rotation velocities, while the red dot-dashed and cyan dashed lines correspond to the rotational velocities of the gas and stellar components, respectively. The black arrows represent the 90th percentile stellar radius obtained from the WISE 3.4 μm band surface brightness profile. |
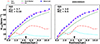 |
Fig. 13. Isothermal (ISO) mass modelling results for [KKS2000]23. The decomposition for both galaxies was performed under two different assumptions of the mass-to-light ratio, as indicated in each figure. The blue circles represent the derived rotation curve, while the magenta lines show the fitted rotation curve. The green dashed lines indicate the dark matter contribution to the rotation velocities, while the red dot-dashed and cyan dashed lines correspond to the rotational velocities of the gas and stellar components, respectively. The black arrows represent the 90th percentile stellar radius obtained from the WISE 3.4 μm band surface brightness profile. |
6.4.1. ESO444–G084
The mass modelling results for ESO444–G084 are summarized in Fig. 12 and Table 8. The best-fit dark matter halo parameters were derived for two different (M/L)* assumptions. For  , the halo is characterized by a core radius of 3.48±0.57 kpc and a central density of (16.05±1.45)×10−3 M⊙ pc−3. The enclosed dark matter mass within the last measured point of the rotation curve (3.8 kpc) is (2.23±0.17)×109 M⊙. Increasing the mass-to-light ratio to
  results in a larger core radius of 5.84±2.64 kpc and a lower central density of (11.47±1.46)×10−3 M⊙ pc−3. While both models yield core radii within the expected range of ∼1–6 kpc (de Blok et al. 2001a; Oh et al. 2015), the central densities are higher than the typical ∼(2−6)×10−3 M⊙ pc−3 found in dwarf galaxies (Oh et al. 2015). It is worth noting that in the
  model the derived core radius is similar to or even larger than the outermost data point, indicating that the available observations do not strongly constrain the inner mass profile. Consequently, the core size estimate should be regarded as a lower limit rather than a definitive measurement. The
  model provides a better fit to the observed rotation curve (
 ) compared to the
  model (
 ).
).
Best-fit dark matter halo parameters for ESO444–G084 and [KKS2000]23.
6.4.2. [KKS2000]23
The derived dark matter halo parameters for [KKS2000]23 are shown in Fig. 13 and Table 8. For the WISE-derived  , the best-fit model yields a core radius of 5.49±0.60 kpc, and a central density of (4.29±0.43)×10−3 M⊙ pc−3. The enclosed dark matter mass within the last measured point of the rotation curve (10.8 kpc) is (7.73±0.74)×109 M⊙. These values align well with previous studies reporting core radii of ∼1–6 kpc and central densities of ∼(2−6)×10−3 M⊙ pc−3 (de Blok et al. 2001a; Oh et al. 2015). When adopting the higher
  , the model produces a slightly larger core radius (7.11±0.86) kpc and a lower central density (3.30±0.30)×10−3 M⊙ pc−3.
7. Gravitational instabilities and star formation
Dwarf galaxies, characterized by their low densities, provide an ideal environment for studying both local and global disk instabilities (Leroy et al. 2008). The extended H I reservoirs in ESO444–G084 and [KKS2000]23 allow us to examine whether their gaseous disks are stable against gravitational collapse and how the regions of high H I column density relate to active star formation. While other tracers, such as molecular gas and stellar kinematics play a role in assessing the disk stability, H I provides critical insight into the large-scale stability of the gas disk, particularly in environments where molecular gas is not detected. By analysing the H I distribution and kinematics, we can assess whether these galaxies host large-scale gravitational instabilities and how efficiently their gas-rich regions are forming stars. The stability of a rotating gas disk is defined using the Toomre-Q parameter, which indicates whether the disk is susceptible to gravitational collapse (Toomre 1964). It is given by
 (10)
(10)
where σHI is the gas velocity dispersion, G is the gravitational constant, and Σgas represents the gas surface density. The σHI and ΣHI are derived using both PyFAT and TiRiFiC. The factor 1.4 accounts for helium, and κ, the epicyclic frequency, describes the differential rotation of the disk, defined as
![Mathematical equation: $$ \kappa = \sqrt {2 \Biggr [\frac {V^{2}}{R^{2}} + \frac {V}{R} \frac {{\mathrm {d}}V}{{\mathrm {d}}R} \Biggr ]}. $$](/articles/aa/full_html/2025/07/aa54391-25/aa54391-25-eq30.gif) (11)
(11)
When Qgas<1, the gas is gravitationally unstable and susceptible to collapse, leading to star formation. However, in galaxies with thicker disks, additional vertical support means that gravitational collapse may require a slightly higher threshold, with instability occurring at approximately 1.5Qgas (Romeo & Falstad 2013).
The efficiency of star formation is strongly linked to the gas density, with previous studies showing that galaxies with low gas surface densities tend to exhibit reduced star formation rates (Kennicutt 1989; Leroy et al. 2008; Hunter et al. 2021). One way to assess whether a galaxy's disk is able to sustain star formation is by comparing the gas surface density to the critical threshold, Σcrit, given by
 (12)
(12)
where κ is the epicyclic frequency, σHI is the velocity dispersion, and G is the gravitational constant. When the ratio Σgas/Σcrit exceeds unity, the gas is expected to be unstable to gravitational collapse, potentially triggering star formation. However, star formation is not only determined by this condition. Additional factors such as the presence of molecular gas, turbulence, and feedback processes influence how efficiently gas converts into stars. To explore the relationship between gas stability and star formation, we examine the spatial distribution of H I column densities alongside star formation tracers such as Hα and far-ultraviolet (FUV) emission. Hα emission traces ionized gas from recent star formation (1–3 Myr), while FUV emission captures longer timescales (up to 100 Myr), providing insight into the sustained star formation activity.
To derive the stability of the gas disk, we determined the pixel-to-pixel Toomre-Q parameter and the Σgas/Σcrit ratio across both galaxies. These quantities depend on the underlying rotation curve, which we parametrized using a functional form that describes how the rotational velocity varies with radius (Leroy et al. 2008). We adopted the rotation curves derived from the best-fit mass model using the pseudo-isothermal (ISO) halo profile. The parameterization of the rotation curves is given by
![Mathematical equation: $$ V_{{\mathrm {rot}}} = V_{{\mathrm {flat}}} \left [1 - \exp \left (-\frac {r}{l_{{\mathrm {flat}}}}\right )\right ], $$](/articles/aa/full_html/2025/07/aa54391-25/aa54391-25-eq32.gif) (13)
(13)
where Vrot represents the rotation velocity at radius r. Vflat and lflat are free parameters describing the velocity at which the rotation curve flattens, and the scale length at which this velocity is reached. The derived velocity maps were used to calculate the epicyclic frequency κ, which, when combined with the gas surface density maps and the mean velocity dispersion derived from Section 5, allowed for the construction of spatially resolved Qgas and Σgas/Σcrit maps.
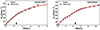 |
Fig. 14. Best-fit rotation velocities from the ISO mass model are shown in black, and the rotation curve derived using Equation (13) is shown in red. The black arrows represent the 90th percentile stellar radius obtained from the WISE 3.4 μm band surface brightness profile. |
We also calculated the associated uncertainty maps to evaluate the reliability of these quantities. The uncertainty in Qgas is propagated as
 (14)
(14)
Similarly, the uncertainty in the stability ratio is calculated by
 (15)
(15)
with
 (16)
(16)
These uncertainties incorporate contributions from the rotation curve, the velocity dispersion σHI, and the gas surface density Σgas.
7.1. Results
The results in this section are highlighted in Figs. 15, 16, and 17.
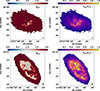 |
Fig. 15. MeerKAT high resolution maps of the Qgas parameter and Σgas/Σcrit for ESO444-G084 (top) and [KKS2000]23 (bottom). The black contours present values of Q<1 while the blue contours show Σgas/Σcrit>1. Note: The colour scale for Q is limited to a maximum of Q = 2 for visual clarity; values above this appear saturated in red. The arrow on the colour bar indicates this saturation. The apparent flattening in the outer regions is a visual effect and does not imply that Q is physically constant. |
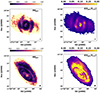 |
Fig. 16. Spatial distribution of uncertainties associated with the Toomre Qgas parameter (left panels) and the Σgas/Σcrit ratio (right panels) for ESO444–G084 (top) and [KKS2000]23 (bottom). The beam size is shown in the bottom-right of each panel. |
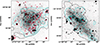 |
Fig. 17. High-resolution MeerKAT H I column density maps (black contours), GALEX FUV (cyan contours), and Hα (crimson contours) of ESO444–G084 (left) and [KKS2000]23 (right) overlaid on DECaLS optical maps. The H I column density contours are set at (2.0, 2.5, 4.0)×1021 cm−2 for ESO444–G084 and (1.0, 2.0, 2.5)×1021 cm−2 for [KKS2000]23. Hα contours are drawn at intensity levels of (70, 90, 110) for ESO444–G084 and (0.02, 0.04, 0.06) for [KKS2000]23. The GALEX FUV contours are plotted at (0.003, 0.005, 0.008, 0.01) for ESO444–G084 and (0.02, 0.04, 0.06) for [KKS2000]23. Hα and FUV contours are arbitrary units. |
7.1.1. ESO444–G084
Fig. 15 shows that the H I disk of ESO444–G084 is stable against global gravitational instability, suggesting that large-scale gravitational processes are not the primary drivers of disk dynamics. The ratio Σgas/Σcrit approaches unity in some central regions but remains below 1 across most of the disk. Fig. 16 presents the associated uncertainty maps for both Qgas and Σgas/Σcrit. Despite this stability, star formation is observed near the centre of ESO444–G084, as traced by Hα and FUV emission (Fig. 17). These tracers indicate ongoing and recent star formation and coincide with regions of high H I column density. This suggests that localized gas compression, rather than large-scale gravitational instabilities, is responsible for triggering star formation in this galaxy, indicating that while localized conditions may support star formation, large-scale gravitational effects are not the dominant mechanism governing disk dynamics. According to López-Sánchez et al. (2012), the SFR derived from FUV emission is 0.0093±0.0011 M⊙ yr−1, while the Hα-based SFR is lower at 0.0022±0.0002 M⊙ yr−1. This discrepancy suggests that recent star formation has declined relative to longer-term activity, consistent with a scenario where localized gas compression, rather than sustained large-scale gravitational instabilities, is responsible for triggering star formation in ESO444-G084.
7.1.2. [KKS2000]23
The analysis reveals that the H I disk of [KKS2000]23 shows clear signatures of gravitational instability across several regions. The spatial correlation between low values of Qgas<1 and high Σgas/Σcrit>1 in Fig. 15 suggests that these regions are gravitationally unstable and likely to undergo star formation. Fig. 16 presents the associated uncertainty maps for both Qgas and Σgas/Σcrit.
Fig. 17 shows a strong spatial correlation between high H I column densities and regions of recent star formation, as traced by FUV and Hα emission. Although Hα emission is weaker in this system, indicative of fewer ionized gas regions associated with ongoing star formation, the FUV emission aligns well with regions identified as gravitationally unstable. This suggests that ongoing star formation in [KKS2000]23 is more extended and likely sustained over longer timescales, as FUV traces star formation over the past 100 Myr. A notable feature is the presence of star formation in both the central disk and the outskirts. Its occurrence in the outer regions, despite lower average H I gas densities, suggests that localized enhancements in gas surface density can trigger gravitational instabilities, leading to star formation.
8. Discussion
8.1. H I Morphology and Distribution
The MHONGOOSE survey provides an unprecedented view of dwarf galaxies, probing low column density H I down to <1019 cm−2. Both ESO444–G084 and [KKS2000]23 exhibit extended H I distributions that stretch well beyond their optical radii.
ESO444–G084 exhibits a symmetric H I distribution in its global profile with the highest H I emission at its centre, indicating that the system is dynamically settled, whereas [KKS2000]23 shows significant asymmetries and clumpiness, with high-density gas appearing in irregular locations. The absence of nearby companions suggests that these irregularities originate from internal processes rather than external interactions, although the possibility of past tidal interactions or minor mergers contributing to its kinematic distortions cannot be ruled out (Koribalski et al. 2018). These results align with the idea where most isolated dwarfs exhibit well-ordered HI distribution unless significantly shaped by internal feedback (de Blok et al. 2020), which show that most isolated dwarfs exhibit well-ordered H I distributions unless significantly shaped by internal feedback. Similar trends have been observed in previous studies (Begum et al. 2008; Hunter et al. 2011), where H I asymmetries in dwarf galaxies have been linked to internal turbulence, localized instabilities, and feedback from star formation.
A comparison with single-dish flux measurements is crucial for determining whether interferometric observations recover the total H I content. As highlighted in de Blok et al. (2024), the MeerKAT fluxes for ESO444–G084 and [KKS2000]23 are in good agreement with the GBT and HIPASS single-dish measurements, within the expected calibration uncertainties (Koribalski et al. 2004; Barnes et al. 2001). The overall agreement between MeerKAT and single-dish measurements supports the reliability of MeerKAT interferometric observations in recovering total H I flux for these two systems which are small in angular size.
Interestingly, the H I fluxes measured at column densities of 1019 cm−2 remain consistent with those at 1018 cm−2, indicating that the observed increase in the H I diameter at lower column densities is primarily due to the increase in beam size rather than the detection of significant additional gas. The contrasting H I distributions of ESO444–G084 and [KKS2000]23 further emphasize the diversity of gas-rich dwarf galaxies.
8.2. H I Kinematics
The kinematics of ESO444–G084 and [KKS2000]23 shed light on the dynamical evolution of dwarf galaxies and the interplay between internal and external processes. The kinematic warp in ESO444–G084 indicates ongoing dynamical activity, which may involve internal gas flows or past accretion events. Warps and asymmetries in H I disks are common in low-mass galaxies and often arise from interactions, internal feedback, or misaligned gas accretion (Swaters et al. 2009).
[KKS2000]23 exhibits regular rotation with minimal perturbations, pointing to a settled kinematic structure. This suggests a history of steady gas accretion and a sufficiently deep potential well that helps mitigate major dynamical disturbances (Bullock & Boylan-Kolchin 2017). Observational studies find that galaxies with deeper potential wells tend to show smoother rotation curves and fewer kinematic irregularities (Kereš et al. 2005).
ESO444–G084's rotation curve exhibits a relatively fast rise in the inner region, indicating a centrally concentrated mass distribution and suggesting a dynamically evolved system with a significant mass concentration. However, the rise is not as steep as expected for an NFW-like halo. [KKS2000]23's more gradual rise in its rotation curve indicates a more diffuse mass profile, which may reflect differences in its evolutionary history.
Velocity fields confirm disk-like rotation in both galaxies but highlight notable variations. ESO444–G084 exhibits a position angle shift beyond ∼1.8 kpc, consistent with a kinematic warp. Subtle deviations in its isovelocity contours suggest weak non-circular motions or small-scale perturbations (Sánchez-Salcedo 2006; Khademi et al. 2021). Meanwhile, [KKS2000]23's isovelocity contours remain largely undisturbed, reinforcing its rotation-dominated nature.
Radial velocity profiles further illustrate these differences. ESO444–G084's moderate radial motions (∼15−20 km s−1) indicate weak internal perturbations, while [KKS2000]23's weaker radial inflows (∼6 km s−1) align with a more quiescent gas distribution (Walter et al. 2008; Hunter et al. 2012).
The absence of a strong bar in ESO444–G084 suggests that bar-driven streaming motions are not a dominant feature of its kinematics. However, mild perturbations in its isovelocity contours could be linked to weak oval distortions or residual radial flows. Some galaxies exhibit bar-like distortions in gas kinematics without a prominent stellar bar, highlighting the need for further investigation (Pence & Blackman 1984; Athanassoula & Bureau 1999; Fragkoudi et al. 2017; Marasco et al. 2018; Downing & Oman 2023).
8.3. Dark matter distribution
The mass modelling results provide valuable insights into the cusp-core problem in dwarf galaxies, a long-standing issue in galaxy formation theory (de Blok 2010; Oman et al. 2015; Bullock & Boylan-Kolchin 2017; Sales et al. 2022). ESO444–G084's high central density and relatively compact halo structure suggest a centrally concentrated dark matter distribution. However, its rotation curve does not rise steeply enough to be fully consistent with a cuspy profile, instead aligning more closely with a cored distribution. This suggests that, while some central mass concentration is present, feedback processes or other mechanisms may have partially redistributed the inner dark matter. The moderate core size indicates that if supernova-driven outflows have influenced the central mass distribution, their effect has been limited. Our analysis does not show strong evidence for extensive core expansion, though the precise impact of feedback remains uncertain (Navarro et al. 1996; Read & Gilmore 2005; Tollet et al. 2016). Some studies suggest that dwarf galaxies with centrally concentrated but non-cuspy profiles may have undergone moderate levels of gas outflows, which could contribute to the formation of a core rather than a steep cusp (Gnedin & Zhao 2002). [KKS2000]23's lower central density and larger core radius suggest a cored dark matter profile, consistent with models in which repeated bursts of star formation and feedback driven gas outflows displace dark matter from the central regions (Governato et al. 2012; Pontzen & Governato 2012). Although our analysis based on the ISO model offers only preliminary support for this interpretation, future work testing models such as DC14 (Di Cintio et al. 2014) or coreNFW (Read et al. 2016a) will provide a more robust assessment.
While ESO444–G084 exhibits a more centrally concentrated dark matter halo, [KKS2000]23's shallower density profile suggests that its dark matter distribution may have been altered over time, potentially through cumulative effects of stellar feedback (Read et al. 2019; Lazar et al. 2020). The observed differences between these two galaxies further contribute to the ongoing discussion on whether CDM adequately explains dwarf galaxy mass profiles or if an alternative model, such as SIDM, could provide additional insight into the observed variations (Carlson et al. 1992; Tulin & Yu 2018).
Another key factor in mass modelling is the assumed stellar mass-to-light ratio (M/L)*. Lower (M/L)* values yield more physically motivated halo parameters, particularly for ESO444–G084, where best-fit models suggest a higher central density than expected for typical dwarfs (Martinsson et al. 2013; Girelli et al. 2020). Meanwhile, for [KKS2000]23, the results align with expectations from dwarf galaxy studies, reinforcing the idea of a more diffuse dark matter halo shaped by feedback processes (Dutton et al. 2019).
Although the maximum rotation velocities of ESO444-G084 and [KKS2000]23 are similar, the marked differences in their core radii and inner mass distributions emphasize the diverse impact of baryonic processes on dwarf galaxy halos. Studies such as Oman et al. (2015) and Santos-Santos et al. (2020) further suggest that variations in baryonic surface density, star formation efficiency, and gas outflow dynamics are key to understanding this diversity.
8.4. Gravitational instabilities and star formation
The contrasting properties of ESO444–G084 and [KKS2000]23 illustrate that gravitational stability alone does not fully determine the star formation history of a galaxy. Whilst gravitational instability is a key mechanism for triggering star formation, additional factors such as turbulence, feedback, and gas depletion must be considered (Hopkins et al. 2012). ESO444–G084 appears globally stable, yet localized perturbations continue to sustain residual star formation, indicating that gravitational stability does not prevent all star formation, but regulates its extent and efficiency. [KKS2000]23 remains gravitationally unstable, yet ongoing star formation is weak, suggesting that turbulent gas motions or past feedback processes may be suppressing star formation despite instability. These findings reinforce well-established results that dwarf galaxy evolution is shaped by episodic bursts of star formation and quiescence, regulated by gravitational collapse, gas depletion, and feedback-driven turbulence (Elmegreen 2002; Hopkins et al. 2012; Romano et al. 2023).
The presence of Hα and FUV emission in ESO444–G084 suggests sustained star formation over the past ∼100 Myr. The alignment of these tracers with high H I column density supports the idea that localized gas compression continues to regulate star formation. Evidently, large-scale gravitational collapse is not fuelling widespread star formation; however, minor dynamical perturbations still allow localized cloud collapse (Leroy et al. 2008; Kennicutt & Evans 2012). Meanwhile, [KKS2000]23 exhibits gravitational instability but lacks strong Hα emission, with only FUV predominantly detected across the disk. This suggests that recent star formation has significantly declined, possibly due to past gas depletion or turbulence disrupting dense cloud formation, aligning with post-burst dwarf galaxies where a previous episode consumed or dispersed available cold gas, leaving behind an unstable but currently quiescent disk (Mac Low & Ferrara 1999; Kennicutt & Evans 2012).
These findings highlight the importance of interpreting star formation across different timescales. Hα emission traces massive stars formed in the past 1–3 Myr, while FUV emission tracks star formation up to 100 Myr. The detection of FUV with little Hα in [KKS2000]23 suggests that recent star formation has significantly declined, leaving a residual UV signature (Elmegreen 2002; Hopkins et al. 2012). In contrast, the continued presence of both tracers in ESO444–G084 suggests ongoing star formation. These variations indicate that ESO444–G084 maintains ongoing star formation, while [KKS2000]23 is experiencing a phase of declining star formation, where previous activity left the disk unstable but with little recent star formation. This aligns with studies emphasizing the cyclical nature of star formation in dwarfs, where gravitational instabilities trigger star formation, followed by gas depletion and stabilization (Bigiel et al. 2008).
9. Conclusions
In this study, we utilized high-resolution MeerKAT H I observations to investigate the H I distribution, kinematics, mass modelling, and disk stability of the dwarf galaxies ESO444–G084 and [KKS2000]23. Our analysis offers new insights into the interplay between dark matter, baryonic processes, and star formation in these systems. Below, we summarize our key findings:
-
H I morphology and distribution:
-
ESO444–G084 exhibits a smooth and well-ordered H I distribution, with high-column-density gas concentrated centrally and distinct spiral arm structures not visible in optical and UV images.
-
[KKS2000]23 displays a clumpier and more irregular H I distribution, with localized high-column-density regions scattered throughout the disk, indicating a fragmented gas structure.
-
The H I fluxes measured at column densities of 1019 cm−2 are consistent with those at 1018 cm−2, suggesting that the observed increase in H I diameter is primarily due to beam size rather than additional gas detection.
-
The total H I masses are (1.1 ± 0.1) × 108 M⊙ for ESO444–G084 and (6.1 ± 0.3) × 108 M⊙ for [KKS2000]23, indicating a significantly higher gas content in the latter.
-
-
H I kinematics:
-
Deviations in the velocity field of ESO444–G084 within the inner ∼1.8 kpc suggest a weak kinematic warp, possibly influenced by internal gas flows or past accretion events.
-
The isovelocity contours in ESO444–G084's central region deviate slightly from parallel, indicating weak non-circular motions. The absence of characteristic S-shaped or X-shaped distortions suggests these motions are not bar-driven but may result from mild internal perturbations or gas flows.
-
[KKS2000]23 exhibits regular rotation with minimal perturbations, indicating a stable kinematic structure.
-
The derived rotation curves show a relatively fast rise in ESO444–G084's rotation velocity within the inner 2 kpc, reaching ∼50 km s−1. [KKS2000]23's rotation curve rises more gradually, peaking at ∼60 km s−1 beyond 6 kpc.
-
-
Dark matter halo:
-
The central dark matter density (ρ0) is significantly higher for ESO444–G084 (ρ0 = 16.05±1.45×10⁻³ M⊙ pc−3) at
 , compared to [KKS2000]23 (ρ0 = 4.29±0.43×10⁻³ M⊙ pc−3), reflecting a more concentrated dark matter halo in ESO444–G084.
 -
The core radius (rC) is smaller for ESO444–G084 (rC = 3.48±0.57 kpc), indicating a more compact dark matter distribution. [KKS2000]23 has a larger core radius (rC = 5.49±0.60 kpc), suggesting a less concentrated mass distribution and the likely presence of a constant density core.
-
-
Gravitational instabilities and star formation:
-
[KKS2000]23 shows Q<1 regions, indicating active gravitational instabilities that may be triggering ongoing star formation, whereas ESO444–G084 remains stable (Q>1), suggesting a different star formation mechanism such as turbulence or stellar feedback.
-
ESO444–G084 exhibits both Hα and FUV emission, confirming ongoing star formation, while [KKS2000]23 is dominated by FUV emission, implying that its last major star formation episode occurred over ∼10 Myr ago.
-
Despite MeerKAT's high sensitivity, no significant gas inflows were detected in either galaxy, suggesting that internal processes (e.g. turbulence, gravitational instabilities) rather than external accretion regulate their star formation.
-
Acknowledgments
The MeerKAT telescope is operated by the South African Radio Astronomy Observatory, which is a facility of the National Research Foundation, an agency of the Department of Science and Innovation. BN acknowledges the grant PTA2023-023268-I funded by MICIU/AEI10.13039/501100011033 and byESF+. BN, AM,RI and LVM acknowledge financial support from the grant PID2021-123930OB-C21 funded by MICIU/AEI/ 10.13039/501100011033 and by ERDF/EU and grant CEX2021-001131-S funded by MICIU/AEI. BN, RD, and XN acknowledge the South African Research Chairs Initiative, through the South African Radio Astronomy Observatory (SARAO, grant ID 77948), which is a facility of the National Research Foundation (NRF), an agency of the Department of Science, Technology, and Innovation (DSTI) of South Africa. This work has received funding from the European Research Council (ERC) under the European Union's Horizon 2020 research and innovation programme (grant agreement No. 882793 “MeerGas”). P.K. is partially supported by the BMBF project 05A23PC1 for D-MeerKAT. JH acknowledges support from the UK SKA Regional Centre (UKSRC). The UKSRC is a collaboration between the University of Cambridge, University of Edinburgh, Durham University, University of Hertfordshire, University of Manchester, University College London, and the UKRI Science and Technology Facilities Council (STFC) Scientific Computing at RAL. The UKSRC is supported by funding from the UKRI STFC. KS acknowledges support from the Natural Science and Engineering Research Council of Canada (NSERC). KAO acknowledges support by the Royal Society through Dorothy Hodgkin Fellowship DHF/R1/231105. EA and AB gratefully acknowledge support from the Centre National d’Etudes Spatiales (CNES), France. L.C. acknowledges financial support from the Chilean Agencia Nacional de Investigación y Desarrollo (ANID) through Fondo Nacional de Desarrollo Científico y Tecnologico (FONDECYT) Regular Project 1210992. SPS acknowledges funding from NRF/SARAO.
Often referred to as an asymmetric drift correction in analogy with the mathematically similar concept from collisionless dynamics.
References
- Athanassoula, E., & Bureau, M. 1999, ApJ, 522, 699 [Google Scholar]
- Barnes, D. G., Staveley-Smith, L., de Blok, W. J. G., et al. 2001, MNRAS, 322, 486 [Google Scholar]
- Begeman, K. G. 1989, A&A, 223, 47 [NASA ADS] [Google Scholar]
- Begeman, K. G., Broeils, A. H., & Sanders, R. H. 1991, MNRAS, 249, 523 [Google Scholar]
- Begum, A., Chengalur, J. N., Karachentsev, I. D., Sharina, M. E., & Kaisin, S. S. 2008, MNRAS, 386, 1667 [NASA ADS] [CrossRef] [Google Scholar]
- Bigiel, F., Leroy, A., Walter, F., et al. 2008, AJ, 136, 2846 [NASA ADS] [CrossRef] [Google Scholar]
- Blais-Ouellette, S., Amram, P., Carignan, C., & Swaters, R. 2004, A&A, 420, 147 [NASA ADS] [CrossRef] [EDP Sciences] [Google Scholar]
- Bosma, A. 1978, PhD thesis, University of Groningen, The Netherlands [Google Scholar]
- Bullock, J. S., & Boylan-Kolchin, M. 2017, ARA&A, 55, 343 [Google Scholar]
- Camilo, F., Scholz, P., Serylak, M., et al. 2018, ApJ, 856, 180 [Google Scholar]
- Carignan, C., & Freeman, K. C. 1985, ApJ, 294, 494 [Google Scholar]
- Carignan, C., & Freeman, K. C. 1988, ApJ, 332, L33 [Google Scholar]
- Carignan, C., & Purton, C. 1998, ApJ, 506, 125 [Google Scholar]
- Carlson, E. D., Machacek, M. E., & Hall, L. J. 1992, ApJ, 398, 43 [CrossRef] [Google Scholar]
- Chamba, N., Marcum, P. M., Saintonge, A., et al. 2024, ApJ, 974, 247 [Google Scholar]
- Cluver, M. E., Jarrett, T. H., Hopkins, A. M., et al. 2014, ApJ, 782, 90 [Google Scholar]
- Côté, S., Carignan, C., & Freeman, K. C. 2000, AJ, 120, 3027 [CrossRef] [Google Scholar]
- Dale, D. A., Cohen, S. A., Johnson, L. C., et al. 2009, ApJ, 703, 517 [Google Scholar]
- de Blok, W. J. G. 2010, Adv. Astron., 2010, 789293P [Google Scholar]
- de Blok, W. J. G., McGaugh, S. S., Bosma, A., & Rubin, V. C. 2001a, ApJ, 552, L23 [Google Scholar]
- de Blok, W. J. G., McGaugh, S. S., & Rubin, V. C. 2001b, AJ, 122, 2396 [NASA ADS] [CrossRef] [Google Scholar]
- de Blok, W. J. G., Walter, F., Brinks, E., et al. 2008, AJ, 136, 2648 [NASA ADS] [CrossRef] [Google Scholar]
- de Blok, W. J. G., Athanassoula, E., Bosma, A., et al. 2020, A&A, 643, A147 [NASA ADS] [CrossRef] [EDP Sciences] [Google Scholar]
- de Blok, W. J. G., Healy, J., Maccagni, F. M., et al. 2024, A&A, 688, A109 [NASA ADS] [CrossRef] [EDP Sciences] [Google Scholar]
- de Vaucouleurs, G., de Vaucouleurs, A., Corwin, H. G. Jr., et al. 1991, Third Reference Catalogue of Bright Galaxies (New York, NY (USA): Springer) [Google Scholar]
- Dey, A., Schlegel, D. J., Lang, D., et al. 2019, AJ, 157, 168 [Google Scholar]
- Di Cintio, A., Brook, C. B., Dutton, A. A., et al. 2014, MNRAS, 441, 2986 [Google Scholar]
- Di Teodoro, E. M., & Fraternali, F. 2015, MNRAS, 451, 3021 [Google Scholar]
- Downing, E. R., & Oman, K. A. 2023, MNRAS, 522, 3318 [NASA ADS] [CrossRef] [Google Scholar]
- Dutton, A. A., Obreja, A., & Macciò, A. V. 2019, MNRAS, 482, 5606 [NASA ADS] [Google Scholar]
- Elmegreen, B. G. 2002, ApJ, 577, 206 [CrossRef] [Google Scholar]
- Elmegreen, B. G., & Hunter, D. A. 2015, ApJ, 805, 145 [NASA ADS] [CrossRef] [Google Scholar]
- Elson, E. C., de Blok, W. J. G., & Kraan-Korteweg, R. C. 2012, AJ, 143, 1 [NASA ADS] [CrossRef] [Google Scholar]
- Flores, R. A., & Primack, J. R. 1994, ApJ, 427, L1 [NASA ADS] [CrossRef] [Google Scholar]
- Fragkoudi, F., Di Matteo, P., Haywood, M., et al. 2017, A&A, 606, A47 [NASA ADS] [CrossRef] [EDP Sciences] [Google Scholar]
- Ghosh, S., & Jog, C. J. 2018, New Astron., 63, 38 [CrossRef] [Google Scholar]
- Girelli, G., Pozzetti, L., Bolzonella, M., et al. 2020, A&A, 634, A135 [NASA ADS] [CrossRef] [EDP Sciences] [Google Scholar]
- Gnedin, O. Y., & Zhao, H. 2002, MNRAS, 333, 299 [NASA ADS] [CrossRef] [Google Scholar]
- Governato, F., Zolotov, A., Pontzen, A., et al. 2012, MNRAS, 422, 1231 [Google Scholar]
- Healy, J., de Blok, W. J. G., Maccagni, F. M., et al. 2024, A&A, 687, A254 [NASA ADS] [CrossRef] [EDP Sciences] [Google Scholar]
- Hopkins, P. F., Quataert, E., & Murray, N. 2012, MNRAS, 421, 3488 [NASA ADS] [CrossRef] [Google Scholar]
- Hu, W., Barkana, R., & Gruzinov, A. 2000, Phys. Rev. Lett., 85, 1158 [NASA ADS] [CrossRef] [Google Scholar]
- Huchtmeier, W. K., Karachentsev, I. D., & Karachentseva, V. E. 2001, A&A, 377, 801 [NASA ADS] [CrossRef] [EDP Sciences] [Google Scholar]
- Hunter, D. A., Elmegreen, B. G., Oh, S. -H., et al. 2011, AJ, 142, 121 [NASA ADS] [CrossRef] [Google Scholar]
- Hunter, D. A., Ficut-Vicas, D., Ashley, T., et al. 2012, AJ, 144, 134 [CrossRef] [Google Scholar]
- Hunter, D. A., Elmegreen, B. G., Goldberger, E., et al. 2021, AJ, 161, 71 [NASA ADS] [CrossRef] [Google Scholar]
- Jonas, J., & MeerKAT Team 2016, MeerKAT Science: On the Pathway to the SKA, 1 [Google Scholar]
- Józsa, G. I. G., Kenn, F., Klein, U., & Oosterloo, T. A. 2007, A&A, 468, 731 [NASA ADS] [CrossRef] [EDP Sciences] [Google Scholar]
- Józsa, G. I. G., Kenn, F., Oosterloo, T. A., & Klein, U. 2012, Astrophysics Source Code Library, [record ascl:1208.008] [Google Scholar]
- Kaldare, R., Colless, M., Raychaudhury, S., & Peterson, B. A. 2003, MNRAS, 339, 652 [NASA ADS] [CrossRef] [Google Scholar]
- Kamphuis, P. 2024, Astrophysics Source Code Library, [record ascl:2407.002] [Google Scholar]
- Kamphuis, P., Józsa, G. I. G., Oh, S. H., et al. 2015, MNRAS, 452, 3139 [NASA ADS] [CrossRef] [Google Scholar]
- Karachentsev, I. D., Karachentseva, V. E., Suchkov, A. A., & Grebel, E. K. 2000, A&AS, 145, 415 [NASA ADS] [CrossRef] [EDP Sciences] [Google Scholar]
- Karachentsev, I. D., Sharina, M. E., Dolphin, A. E., et al. 2002, A&A, 385, 21 [CrossRef] [EDP Sciences] [Google Scholar]
- Kennicutt, R. C. Jr. 1989, ApJ, 344, 685 [CrossRef] [Google Scholar]
- Kennicutt, R. C., & Evans, N. J. 2012, ARA&A, 50, 531 [NASA ADS] [CrossRef] [Google Scholar]
- Kereš, D., Katz, N., Weinberg, D. H., & Davé, R. 2005, MNRAS, 363, 2 [Google Scholar]
- Khademi, M., Yang, Y., Hammer, F., & Nasiri, S. 2021, A&A, 654, A7 [NASA ADS] [CrossRef] [EDP Sciences] [Google Scholar]
- Koribalski, B. S., Staveley-Smith, L., Kilborn, V. A., et al. 2004, AJ, 128, 16 [Google Scholar]
- Koribalski, B. S., Wang, J., Kamphuis, P., et al. 2018, MNRAS, 478, 1611 [NASA ADS] [CrossRef] [Google Scholar]
- Koribalski, B. S., Staveley-Smith, L., Westmeier, T., et al. 2020, Ap&SS, 365, 118 [Google Scholar]
- Lazar, A., Bullock, J. S., Boylan-Kolchin, M., et al. 2020, MNRAS, 497, 2393 [NASA ADS] [CrossRef] [Google Scholar]
- Lelli, F., McGaugh, S. S., & Schombert, J. M. 2016, AJ, 152, 157 [Google Scholar]
- Leroy, A. K., Walter, F., Brinks, E., et al. 2008, AJ, 136, 2782 [Google Scholar]
- López-Sánchez, Á. R., Koribalski, B. S., van Eymeren, J., et al. 2012, MNRAS, 419, 1051 [CrossRef] [Google Scholar]
- Mac Low, M. -M., & Ferrara, A. 1999, ApJ, 513, 142 [NASA ADS] [CrossRef] [Google Scholar]
- Marasco, A., Oman, K. A., Navarro, J. F., Frenk, C. S., & Oosterloo, T. 2018, MNRAS, 476, 2168 [NASA ADS] [CrossRef] [Google Scholar]
- Martin, D. C., Fanson, J., Schiminovich, D., et al. 2005, ApJ, 619, L1 [Google Scholar]
- Martinsson, T. P. K., Verheijen, M. A. W., Westfall, K. B., et al. 2013, A&A, 557, A131 [NASA ADS] [CrossRef] [EDP Sciences] [Google Scholar]
- Meurer, G. R., Carignan, C., Beaulieu, S. F., & Freeman, K. C. 1996, AJ, 111, 1551 [Google Scholar]
- Meurer, G. R., Hanish, D. J., Ferguson, H. C., et al. 2006, ApJS, 165, 307 [NASA ADS] [CrossRef] [Google Scholar]
- Navarro, J. F., Eke, V. R., & Frenk, C. S. 1996, MNRAS, 283, L72 [NASA ADS] [Google Scholar]
- Niemeyer, J. C. 2020, Progr. Part. Nucl. Phys., 113, 103787 [Google Scholar]
- Oh, S. -H., de Blok, W. J. G., Walter, F., Brinks, E., & Kennicutt, R. C. Jr. 2008, AJ, 136, 2761 [NASA ADS] [CrossRef] [Google Scholar]
- Oh, S. -H., de Blok, W. J. G., Brinks, E., Walter, F., & Kennicutt, R. C. Jr. 2011, AJ, 141, 193 [NASA ADS] [CrossRef] [Google Scholar]
- Oh, S. -H., Hunter, D. A., Brinks, E., et al. 2015, AJ, 149, 180 [CrossRef] [Google Scholar]
- Oman, K. A., Navarro, J. F., Fattahi, A., et al. 2015, MNRAS, 452, 3650 [CrossRef] [Google Scholar]
- Pence, W. D., & Blackman, C. P. 1984, MNRAS, 210, 547 [NASA ADS] [CrossRef] [Google Scholar]
- Pontzen, A., & Governato, F. 2012, MNRAS, 421, 3464 [NASA ADS] [CrossRef] [Google Scholar]
- Read, J. I., & Gilmore, G. 2005, MNRAS, 356, 107 [NASA ADS] [CrossRef] [Google Scholar]
- Read, J. I., Agertz, O., & Collins, M. L. M. 2016a, MNRAS, 459, 2573 [NASA ADS] [CrossRef] [Google Scholar]
- Read, J. I., Iorio, G., Agertz, O., & Fraternali, F. 2016b, MNRAS, 462, 3628 [NASA ADS] [CrossRef] [Google Scholar]
- Read, J. I., Walker, M. G., & Steger, P. 2019, MNRAS, 484, 1401 [NASA ADS] [CrossRef] [Google Scholar]
- Rocha, M., Peter, A. H. G., Bullock, J. S., et al. 2013, MNRAS, 430, 81 [NASA ADS] [CrossRef] [Google Scholar]
- Romano, M., Nanni, A., Donevski, D., et al. 2023, A&A, 677, A44 [NASA ADS] [CrossRef] [EDP Sciences] [Google Scholar]
- Romeo, A. B., & Falstad, N. 2013, MNRAS, 433, 1389 [NASA ADS] [CrossRef] [Google Scholar]
- Ryan-Weber, E., Koribalski, B. S., Staveley-Smith, L., et al. 2002, AJ, 124, 1954 [Google Scholar]
- Sales, L. V., Wetzel, A., & Fattahi, A. 2022, Nat. Astron., 6, 897 [NASA ADS] [CrossRef] [Google Scholar]
- Sánchez-Salcedo, F. J. 2006, MNRAS, 365, 555 [CrossRef] [Google Scholar]
- Santos-Santos, I. M. E., Navarro, J. F., Robertson, A., et al. 2020, MNRAS, 495, 58 [NASA ADS] [CrossRef] [Google Scholar]
- Sardone, A., Pisano, D. J., Pingel, N. M., et al. 2021, ApJ, 910, 69 [NASA ADS] [CrossRef] [Google Scholar]
- Schruba, A., Leroy, A. K., Walter, F., et al. 2012, AJ, 143, 138 [NASA ADS] [CrossRef] [Google Scholar]
- Sorgho, A., Carignan, C., Pisano, D. J., et al. 2019, MNRAS, 482, 1248 [NASA ADS] [CrossRef] [Google Scholar]
- Spergel, D. N., & Steinhardt, P. J. 2000, Phys. Rev. Lett., 84, 3760 [NASA ADS] [CrossRef] [Google Scholar]
- Swaters, R. A., Madore, B. F., van den Bosch, F. C., & Balcells, M. 2003, ApJ, 583, 732 [Google Scholar]
- Swaters, R. A., Sancisi, R., van Albada, T. S., & van der Hulst, J. M. 2009, A&A, 493, 871 [NASA ADS] [CrossRef] [EDP Sciences] [Google Scholar]
- Tollet, E., Macciò, A. V., Dutton, A. A., et al. 2016, MNRAS, 456, 3542 [CrossRef] [Google Scholar]
- Toomre, A. 1964, ApJ, 139, 1217 [Google Scholar]
- Tulin, S., & Yu, H. -B. 2018, Phys. Rep., 730, 1 [NASA ADS] [CrossRef] [Google Scholar]
- Tully, R. B., Courtois, H. M., & Sorce, J. G. 2016, AJ, 152, 50 [Google Scholar]
- Veronese, S., de Blok, W. J. G., Healy, J., et al. 2025, A&A, 693, A97 [NASA ADS] [CrossRef] [EDP Sciences] [Google Scholar]
- Walter, F., Brinks, E., de Blok, W. J. G., et al. 2008, AJ, 136, 2563 [Google Scholar]
- Whiting, A. B., Hau, G. K. T., & Irwin, M. 2002, ApJS, 141, 123 [Google Scholar]
- Whiting, A. B., Hau, G. K. T., Irwin, M., & Verdugo, M. 2007, AJ, 133, 715 [NASA ADS] [CrossRef] [Google Scholar]
- Wright, E. L., Eisenhardt, P. R. M., Mainzer, A. K., et al. 2010, AJ, 140, 1868 [Google Scholar]
All Tables
Parameters of the MeerKAT observations and properties of the highest and lowest resolution data cubes.
Basic H I Properties of ESO444–G084 and [KKS2000]23 at different angular resolutions and column density sensitivities.
Derived rotation velocities (Vrot) of ESO444–G084 and asymmetric drift-corrected velocities (Vc) with associated errors (Verrors).
Derived rotation velocities (Vrot) of [KKS2000]2 and asymmetric drift-corrected velocities (Vc) with associated errors (Verrors).
All Figures
|
Fig. 1. MeerKAT H I column density contours from different H I resolution cubes of ESO444–G084 (left) and [KKS2000]23 (right) are overlaid on DECaLS greyscale images in the gri bands. Each contour level represents the H I column density at S/N = 3 for each spatial resolution. The colour bar values indicate the average beam size corresponding to each spatial resolution. The ellipses in the lower-left corner of each map denote the beam sizes at different resolutions, while the black horizontal line represents the scale in kpc. |
| In the text | |
|
Fig. 2. High-resolution maps of ESO444–G084. Top left: H I column density maps from the highest resolution cubes. Top right: GALEX FUV images. Bottom left: velocity field models (pink contours) and observed (white contours) overlaid on velocity field maps (observed). Bottom right: dispersion map models (pink contours) overlaid on the data. The velocity field and dispersion map models were derived from the kinematic analysis described in Section 5. Contours for the velocity field are set at 526.7, 541.7, 556.7, 571.7, 586.7, 601.7, 616.7, 631.7, and 646.7 km s−1, and contours for the velocity dispersion are set at 5, 7, 8, 10, and 12 km s−1. The ellipses in the lower right corner of each map represent the beam sizes. |
| In the text | |
|
Fig. 3. High-resolution maps of [KKS2000]23. Top left: H I column density maps from the highest resolution cubes. Top right: GALEX FUV images. Bottom left: velocity field models (pink contours) and observed (white contours) overlaid on velocity field maps (observed). Bottom right: dispersion map models (pink contours) overlaid on the data. The velocity field and dispersion map models were derived from the kinematic analysis described in Section 5. Contours for the velocity field are set at 980.9, 994.7, 1008.4, 1022.2, 1035.9, 1049.7, 1063.4, 1077.2, and 1090.9 km s−1, and contours for the velocity dispersion are set at 5, 7, 8, 10, and 12 km s−1. The ellipses in the lower right corner of each map represent the beam sizes. |
| In the text | |
|
Fig. 4. Integrated H I spectra of ESO444–G084 (left) and [KKS2000]23 (right) from MeerKAT (black solid line) and HIPASS (black dashed line, Koribalski et al. 2004). The black arrow on each figure shows the kinematic systemic velocity of each galaxy derived in Section 5. The horizontal dashed grey lines indicate the zero level. These profiles are derived from the high-resolution data. |
| In the text | |
|
Fig. 5. Observed rotation curves (grey) and asymmetric drift-corrected rotation curves (black) for ESO444–G084 (left) and [KKS2000]23 (right). |
| In the text | |
|
Fig. 6. Best-fit kinematic parameters of ESO444–G084 derived from the H I data cube using TiRiFiC. The panels display inclination angle, position angle, H I surface density, radial velocity, and rotation velocity. The blue and red lines correspond to the approaching and receding sides, respectively. The dashed line represents high resolution, while the dotted line represents mid-resolution. The black arrows represent the 90th percentile stellar radius obtained from the WISE 3.4 μm band surface brightness profile. |
| In the text | |
|
Fig. 7. Best-fit kinematic parameters of [KKS2000]23 derived from the H I data cube using PyFAT and TiRiFiC. The panels display inclination angle, position angle, H I surface density, radial velocity, and rotation velocity. The blue and red lines correspond to the approaching and receding sides, respectively. The dashed line represents high resolution, while the dotted line represents mid-resolution. The black arrows represent the 90th percentile stellar radius obtained from the WISE 3.4 μm band surface brightness profile. |
| In the text | |
|
Fig. 8. Individual channel maps of ESO444-G084 from the MeerKAT high-resolution cube. Blue contours represent the channel maps from the 3D modelling, while the red contours show the observed data. Contour levels denote values of (3, 6, 9, 12)×σ. Black crosses represent the kinematic centre of the observed data. |
| In the text | |
|
Fig. 9. Individual channel maps of [KKS2000]23 from the MeerKAT high-resolution cube. Blue contours represent the channel maps from the 3D modelling, while the red contours show the observed data. Contour levels denote values of (3, 6, 9, 12)×σ. Black crosses represent the kinematic centre of the observed data. |
| In the text | |
|
Fig. 10. Top: moment-0 map of ESO444-G084 from the MeerKAT high-resolution cube, displaying grey arrows that indicate the positions of slices along which the position–velocity diagrams (bottom) were extracted. The arrows indicate the locations of the PV slices, with one aligned along the kinematic major axis (A) to capture the bulk of rotational motion and another along the minor axis (B) to examine deviations from pure rotation. Additional slices (C and D) were chosen to explore variations in the H I kinematics and overall disk structure. The red contours represent the data, while the blue contours represent the model. The contour levels are set at (3, 6, 9, 15, 18) × σ. |
| In the text | |
|
Fig. 11. Top: moment-0 map of [KKS2000]23 from the MeerKAT high-resolution cube, displaying grey arrows that indicate the positions of slices along which the position–velocity diagrams (bottom) were extracted. The arrows indicate the locations of the PV slices, with one aligned along the kinematic major axis (A) to capture the bulk of rotational motion and another along the minor axis (B) to examine deviations from pure rotation. Additional slices (C and D) were chosen to explore variations in the H I kinematics and overall disk structure. The red contours represent the data, while the blue contours represent the model. The contour levels are set at (3, 6, 9, 15, 18) × σ. |
| In the text | |
|
Fig. 12. Isothermal (ISO) mass modelling results for ESO444–G084. The decomposition for both galaxies was performed under two different assumptions of the mass-to-light ratio, as indicated in each panel. The blue circles represent the derived rotation curve, while the magenta lines show the fitted rotation curve. The green dashed lines indicate the dark matter contribution to the rotation velocities, while the red dot-dashed and cyan dashed lines correspond to the rotational velocities of the gas and stellar components, respectively. The black arrows represent the 90th percentile stellar radius obtained from the WISE 3.4 μm band surface brightness profile. |
| In the text | |
|
Fig. 13. Isothermal (ISO) mass modelling results for [KKS2000]23. The decomposition for both galaxies was performed under two different assumptions of the mass-to-light ratio, as indicated in each figure. The blue circles represent the derived rotation curve, while the magenta lines show the fitted rotation curve. The green dashed lines indicate the dark matter contribution to the rotation velocities, while the red dot-dashed and cyan dashed lines correspond to the rotational velocities of the gas and stellar components, respectively. The black arrows represent the 90th percentile stellar radius obtained from the WISE 3.4 μm band surface brightness profile. |
| In the text | |
|
Fig. 14. Best-fit rotation velocities from the ISO mass model are shown in black, and the rotation curve derived using Equation (13) is shown in red. The black arrows represent the 90th percentile stellar radius obtained from the WISE 3.4 μm band surface brightness profile. |
| In the text | |
|
Fig. 15. MeerKAT high resolution maps of the Qgas parameter and Σgas/Σcrit for ESO444-G084 (top) and [KKS2000]23 (bottom). The black contours present values of Q<1 while the blue contours show Σgas/Σcrit>1. Note: The colour scale for Q is limited to a maximum of Q = 2 for visual clarity; values above this appear saturated in red. The arrow on the colour bar indicates this saturation. The apparent flattening in the outer regions is a visual effect and does not imply that Q is physically constant. |
| In the text | |
|
Fig. 16. Spatial distribution of uncertainties associated with the Toomre Qgas parameter (left panels) and the Σgas/Σcrit ratio (right panels) for ESO444–G084 (top) and [KKS2000]23 (bottom). The beam size is shown in the bottom-right of each panel. |
| In the text | |
|
Fig. 17. High-resolution MeerKAT H I column density maps (black contours), GALEX FUV (cyan contours), and Hα (crimson contours) of ESO444–G084 (left) and [KKS2000]23 (right) overlaid on DECaLS optical maps. The H I column density contours are set at (2.0, 2.5, 4.0)×1021 cm−2 for ESO444–G084 and (1.0, 2.0, 2.5)×1021 cm−2 for [KKS2000]23. Hα contours are drawn at intensity levels of (70, 90, 110) for ESO444–G084 and (0.02, 0.04, 0.06) for [KKS2000]23. The GALEX FUV contours are plotted at (0.003, 0.005, 0.008, 0.01) for ESO444–G084 and (0.02, 0.04, 0.06) for [KKS2000]23. Hα and FUV contours are arbitrary units. |
| In the text | |
Current usage metrics show cumulative count of Article Views (full-text article views including HTML views, PDF and ePub downloads, according to the available data) and Abstracts Views on Vision4Press platform.
Data correspond to usage on the plateform after 2015. The current usage metrics is available 48-96 hours after online publication and is updated daily on week days.
Initial download of the metrics may take a while.