Fig. 7.
Download original image
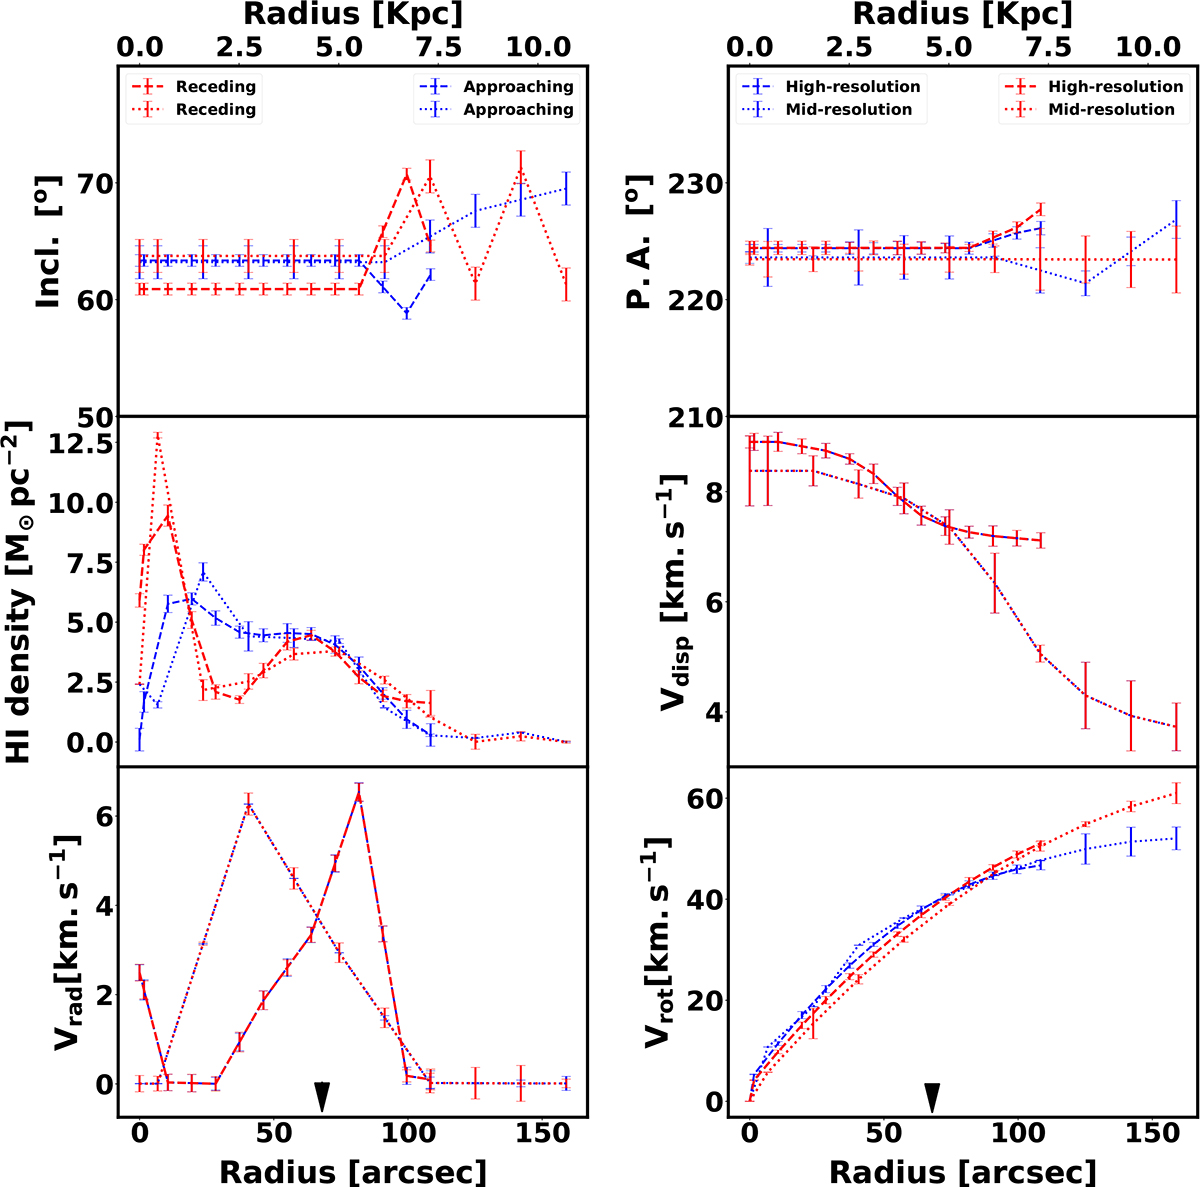
Best-fit kinematic parameters of [KKS2000]23 derived from the H I data cube using PyFAT and TiRiFiC. The panels display inclination angle, position angle, H I surface density, radial velocity, and rotation velocity. The blue and red lines correspond to the approaching and receding sides, respectively. The dashed line represents high resolution, while the dotted line represents mid-resolution. The black arrows represent the 90th percentile stellar radius obtained from the WISE 3.4 μm band surface brightness profile.
Current usage metrics show cumulative count of Article Views (full-text article views including HTML views, PDF and ePub downloads, according to the available data) and Abstracts Views on Vision4Press platform.
Data correspond to usage on the plateform after 2015. The current usage metrics is available 48-96 hours after online publication and is updated daily on week days.
Initial download of the metrics may take a while.