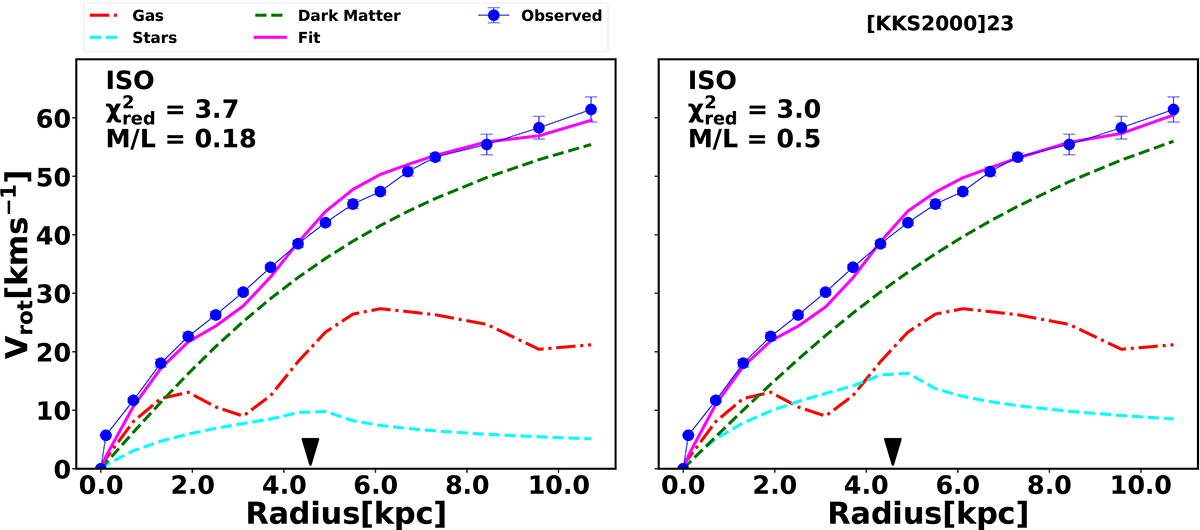
Fig. 13.
Download original image
Isothermal (ISO) mass modelling results for [KKS2000]23. The decomposition for both galaxies was performed under two different assumptions of the mass-to-light ratio, as indicated in each figure. The blue circles represent the derived rotation curve, while the magenta lines show the fitted rotation curve. The green dashed lines indicate the dark matter contribution to the rotation velocities, while the red dot-dashed and cyan dashed lines correspond to the rotational velocities of the gas and stellar components, respectively. The black arrows represent the 90th percentile stellar radius obtained from the WISE 3.4 μm band surface brightness profile.
Current usage metrics show cumulative count of Article Views (full-text article views including HTML views, PDF and ePub downloads, according to the available data) and Abstracts Views on Vision4Press platform.
Data correspond to usage on the plateform after 2015. The current usage metrics is available 48-96 hours after online publication and is updated daily on week days.
Initial download of the metrics may take a while.