Open Access
Fig. 8.
Download original image
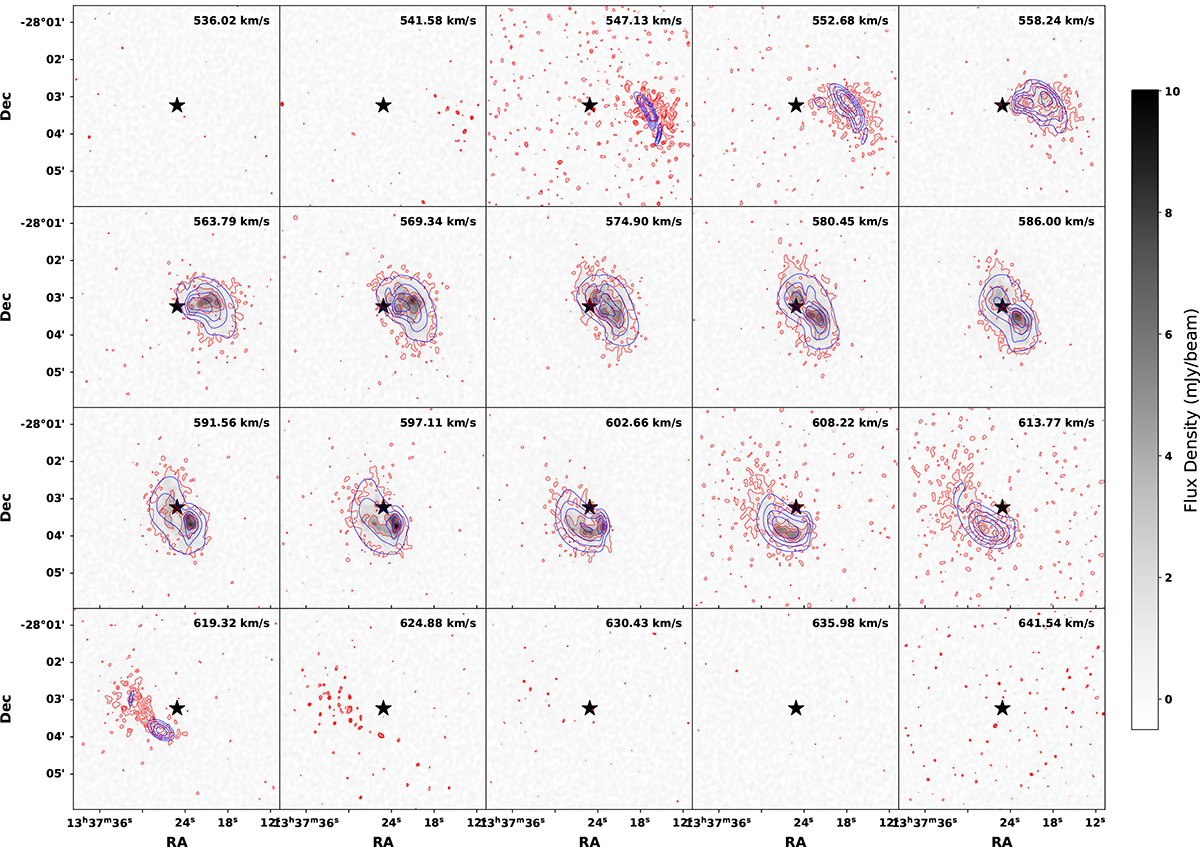
Individual channel maps of ESO444-G084 from the MeerKAT high-resolution cube. Blue contours represent the channel maps from the 3D modelling, while the red contours show the observed data. Contour levels denote values of (3, 6, 9, 12)×σ. Black crosses represent the kinematic centre of the observed data.
Current usage metrics show cumulative count of Article Views (full-text article views including HTML views, PDF and ePub downloads, according to the available data) and Abstracts Views on Vision4Press platform.
Data correspond to usage on the plateform after 2015. The current usage metrics is available 48-96 hours after online publication and is updated daily on week days.
Initial download of the metrics may take a while.