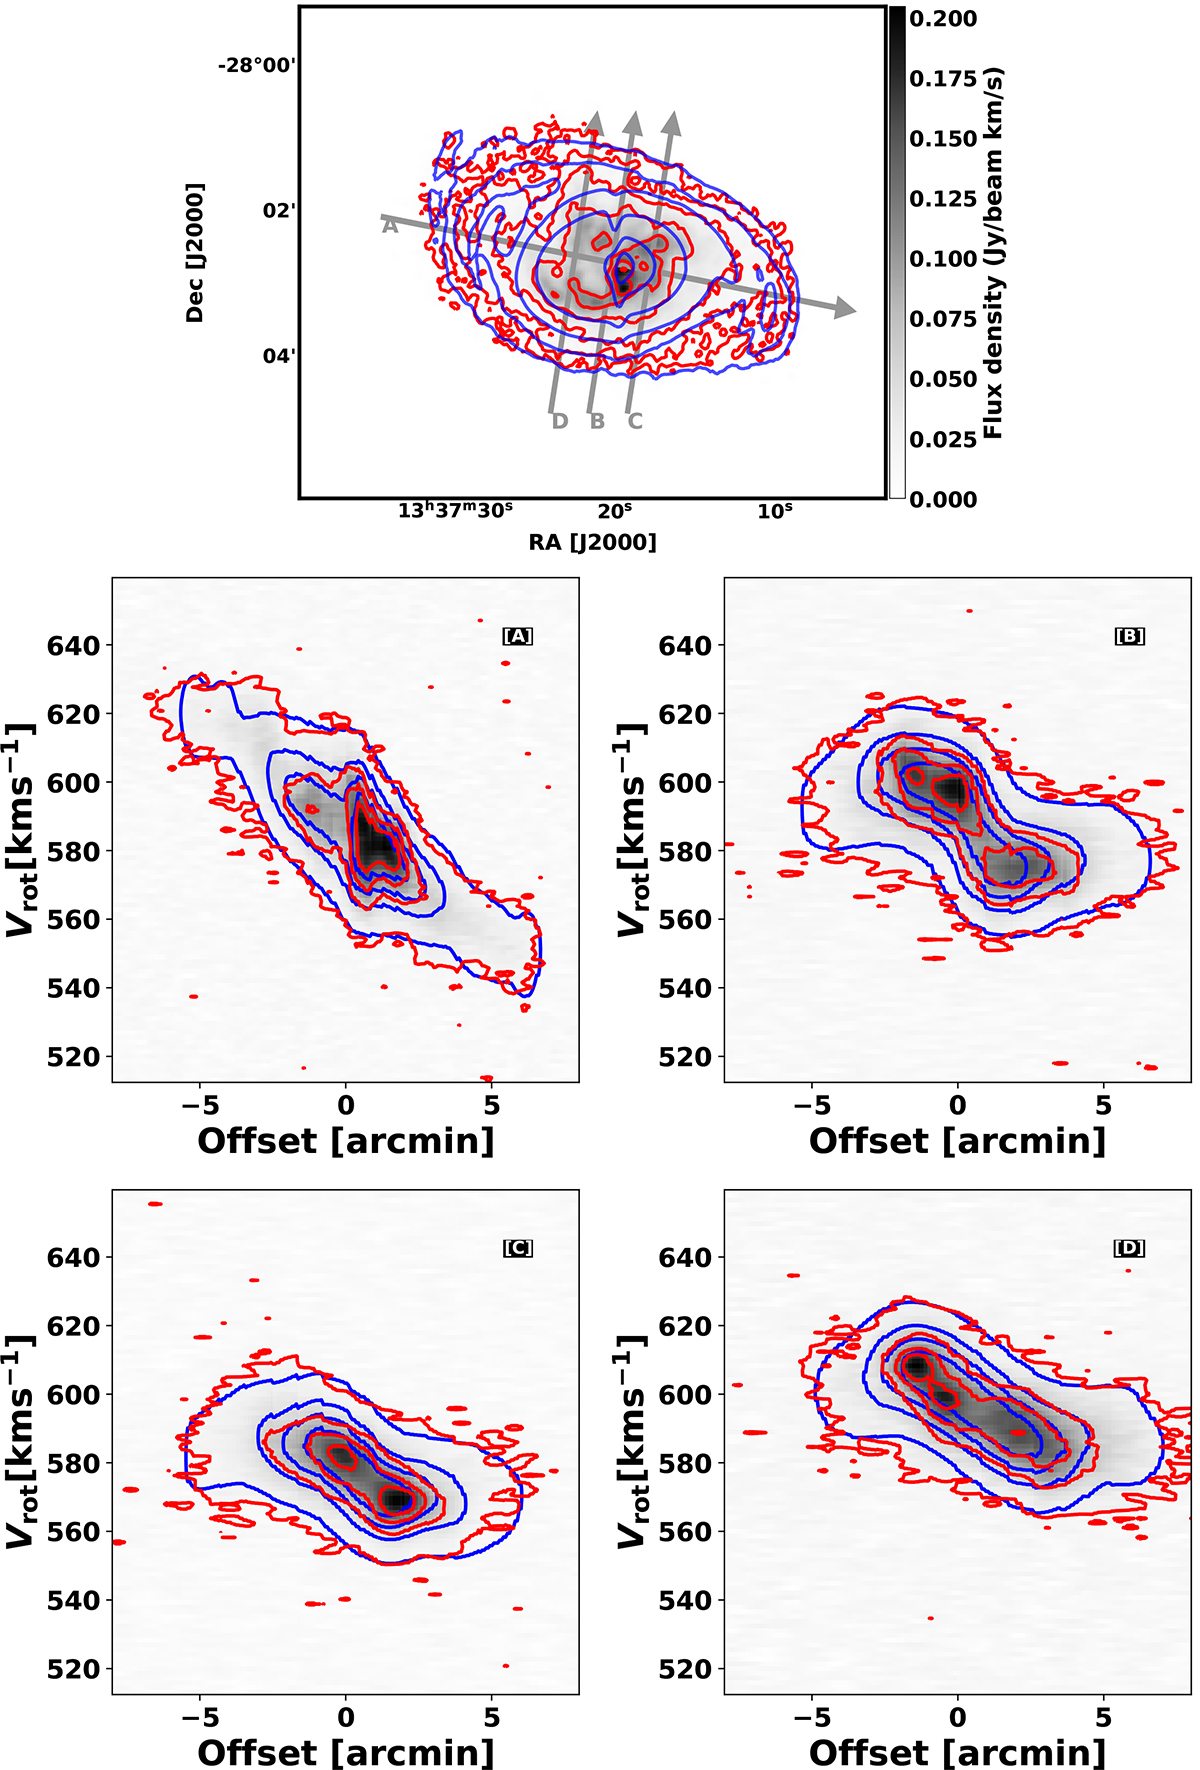
Fig. 10.
Download original image
Top: moment-0 map of ESO444-G084 from the MeerKAT high-resolution cube, displaying grey arrows that indicate the positions of slices along which the position–velocity diagrams (bottom) were extracted. The arrows indicate the locations of the PV slices, with one aligned along the kinematic major axis (A) to capture the bulk of rotational motion and another along the minor axis (B) to examine deviations from pure rotation. Additional slices (C and D) were chosen to explore variations in the H I kinematics and overall disk structure. The red contours represent the data, while the blue contours represent the model. The contour levels are set at (3, 6, 9, 15, 18) × σ.
Current usage metrics show cumulative count of Article Views (full-text article views including HTML views, PDF and ePub downloads, according to the available data) and Abstracts Views on Vision4Press platform.
Data correspond to usage on the plateform after 2015. The current usage metrics is available 48-96 hours after online publication and is updated daily on week days.
Initial download of the metrics may take a while.