Fig. 4.
Download original image
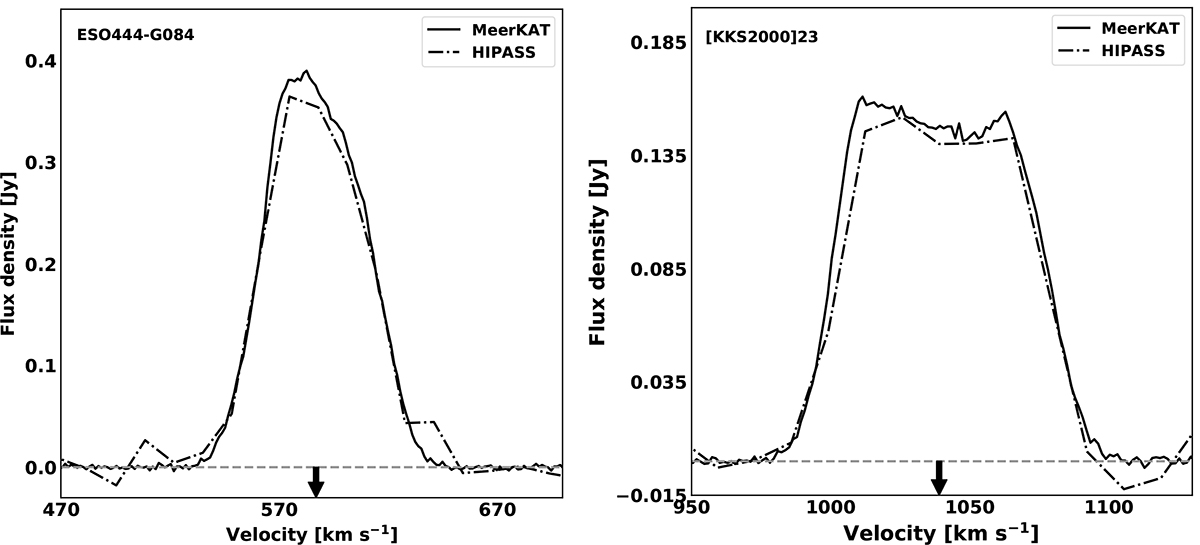
Integrated H I spectra of ESO444–G084 (left) and [KKS2000]23 (right) from MeerKAT (black solid line) and HIPASS (black dashed line, Koribalski et al. 2004). The black arrow on each figure shows the kinematic systemic velocity of each galaxy derived in Section 5. The horizontal dashed grey lines indicate the zero level. These profiles are derived from the high-resolution data.
Current usage metrics show cumulative count of Article Views (full-text article views including HTML views, PDF and ePub downloads, according to the available data) and Abstracts Views on Vision4Press platform.
Data correspond to usage on the plateform after 2015. The current usage metrics is available 48-96 hours after online publication and is updated daily on week days.
Initial download of the metrics may take a while.