Open Access
Fig. 14.
Download original image
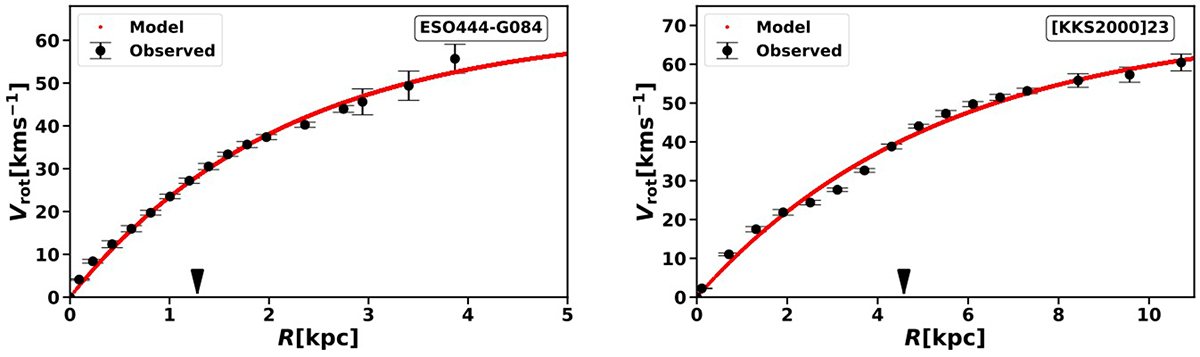
Best-fit rotation velocities from the ISO mass model are shown in black, and the rotation curve derived using Equation (13) is shown in red. The black arrows represent the 90th percentile stellar radius obtained from the WISE 3.4 μm band surface brightness profile.
Current usage metrics show cumulative count of Article Views (full-text article views including HTML views, PDF and ePub downloads, according to the available data) and Abstracts Views on Vision4Press platform.
Data correspond to usage on the plateform after 2015. The current usage metrics is available 48-96 hours after online publication and is updated daily on week days.
Initial download of the metrics may take a while.