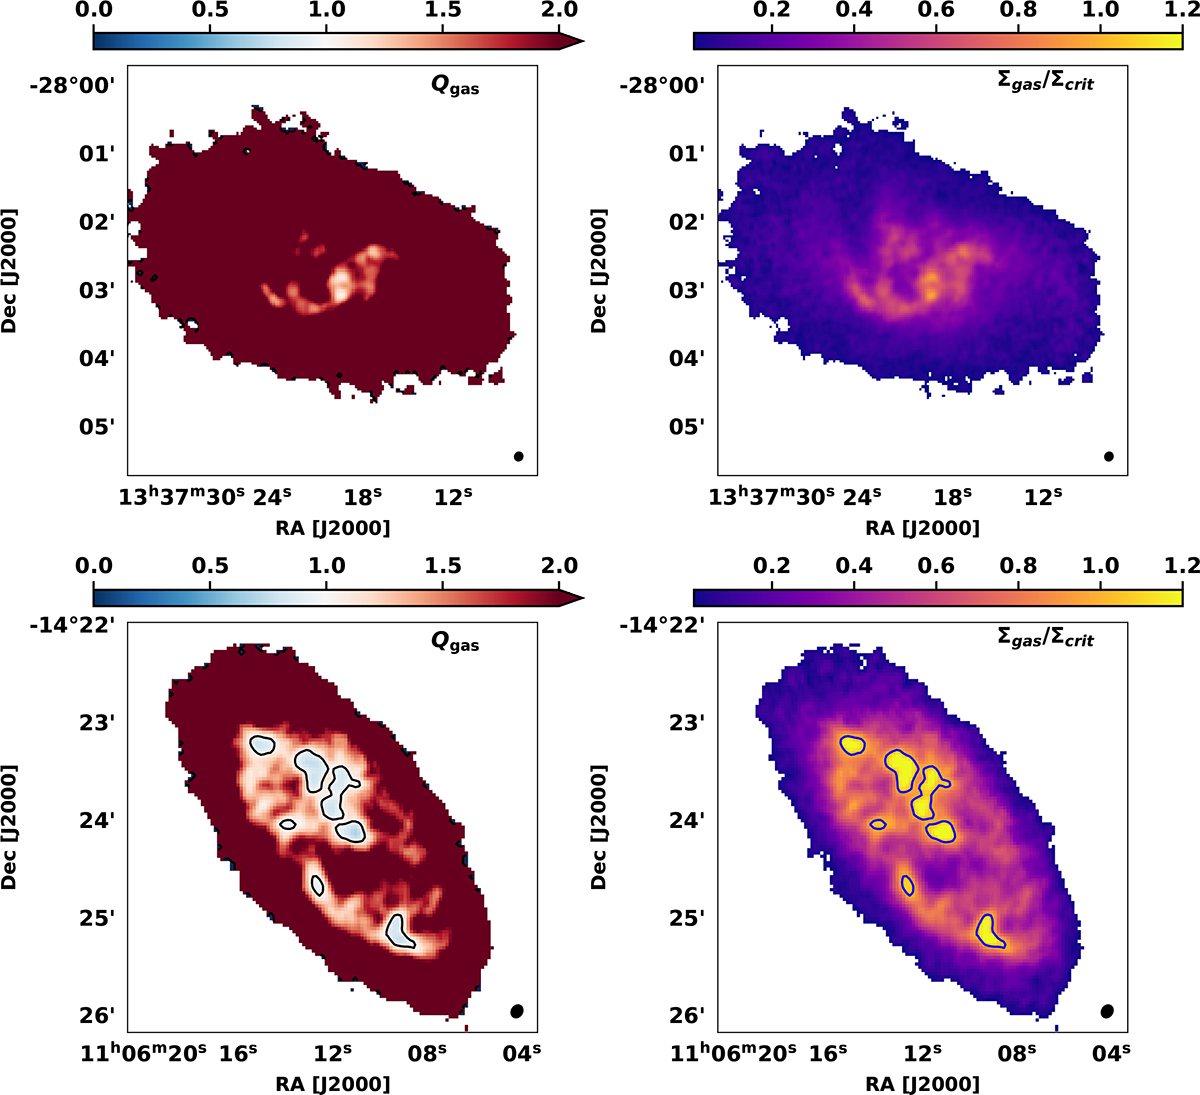
Fig. 15.
Download original image
MeerKAT high resolution maps of the Qgas parameter and Σgas/Σcrit for ESO444-G084 (top) and [KKS2000]23 (bottom). The black contours present values of Q<1 while the blue contours show Σgas/Σcrit>1. Note: The colour scale for Q is limited to a maximum of Q = 2 for visual clarity; values above this appear saturated in red. The arrow on the colour bar indicates this saturation. The apparent flattening in the outer regions is a visual effect and does not imply that Q is physically constant.
Current usage metrics show cumulative count of Article Views (full-text article views including HTML views, PDF and ePub downloads, according to the available data) and Abstracts Views on Vision4Press platform.
Data correspond to usage on the plateform after 2015. The current usage metrics is available 48-96 hours after online publication and is updated daily on week days.
Initial download of the metrics may take a while.