Fig. 3.
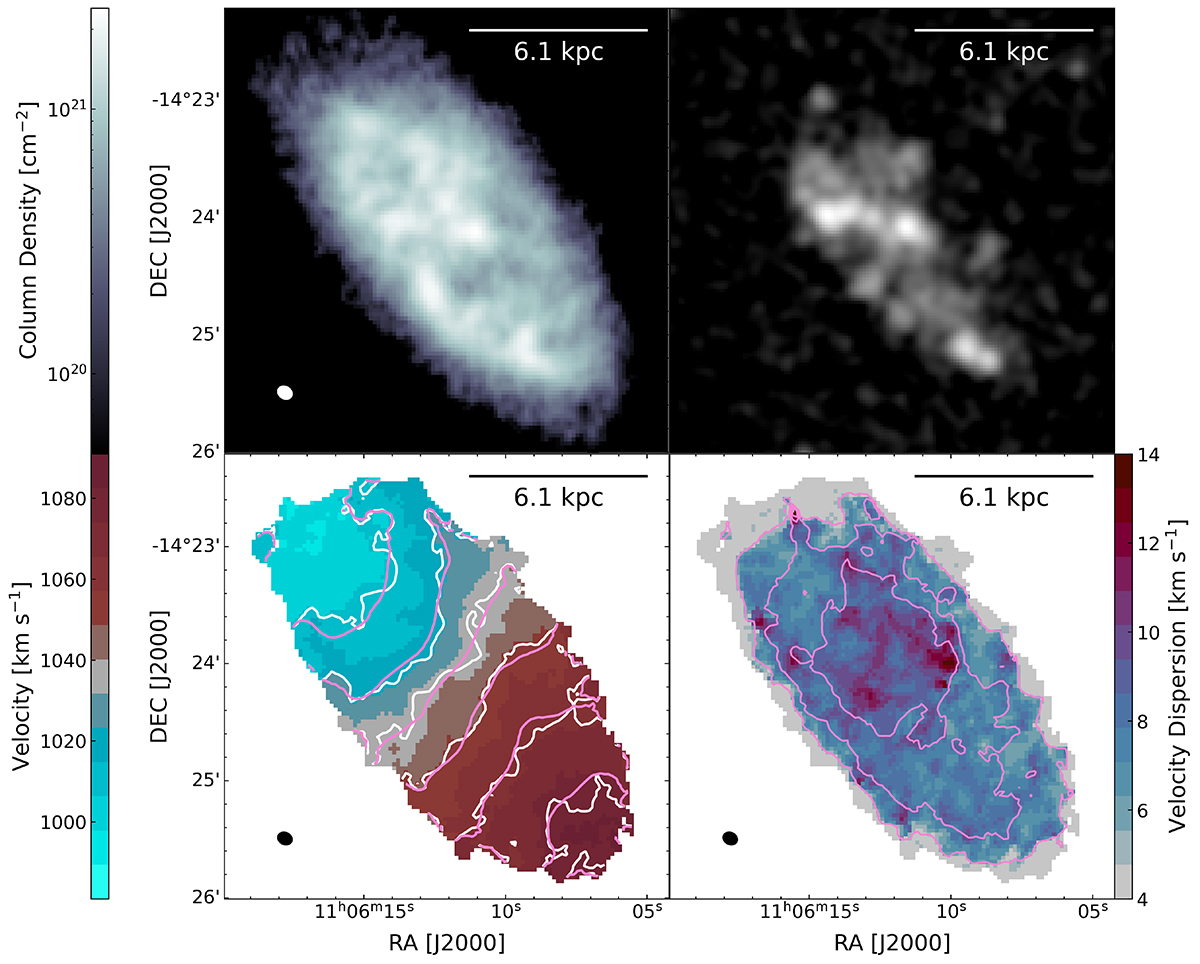
Download original image
High-resolution maps of [KKS2000]23. Top left: H I column density maps from the highest resolution cubes. Top right: GALEX FUV images. Bottom left: velocity field models (pink contours) and observed (white contours) overlaid on velocity field maps (observed). Bottom right: dispersion map models (pink contours) overlaid on the data. The velocity field and dispersion map models were derived from the kinematic analysis described in Section 5. Contours for the velocity field are set at 980.9, 994.7, 1008.4, 1022.2, 1035.9, 1049.7, 1063.4, 1077.2, and 1090.9 km s−1, and contours for the velocity dispersion are set at 5, 7, 8, 10, and 12 km s−1. The ellipses in the lower right corner of each map represent the beam sizes.
Current usage metrics show cumulative count of Article Views (full-text article views including HTML views, PDF and ePub downloads, according to the available data) and Abstracts Views on Vision4Press platform.
Data correspond to usage on the plateform after 2015. The current usage metrics is available 48-96 hours after online publication and is updated daily on week days.
Initial download of the metrics may take a while.