| Issue |
A&A
Volume 695, March 2025
|
|
|---|---|---|
| Article Number | A250 | |
| Number of page(s) | 16 | |
| Section | Extragalactic astronomy | |
| DOI | https://doi.org/10.1051/0004-6361/202451731 | |
| Published online | 25 March 2025 | |
Insight into the starburst nature of Galaxy GN-z11 with JWST MIRI spectroscopy
1
Centro de Astrobiología (CAB), CSIC-INTA, Ctra. de Ajalvir km 4, Torrejón de Ardoz, E-28850 Madrid, Spain
2
Space Telescope Science Institute (STScI), 3700 San Martin Drive, Baltimore, MD 21218, USA
3
DARK, Niels Bohr Institute, University of Copenhagen, Jagtvej 155A, 2200 Copenhagen, Denmark
4
Department of Astronomy, University of Geneva, Chemin Pegasi 51, 1290 Versoix, Switzerland
5
Departamento de Física de la Tierra y Astrofísica, Facultad de Ciencias Físicas, Universidad Complutense de Madrid, E-28040 Madrid, Spain
6
Department of Astronomy, Stockholm University, Oscar Klein Centre, AlbaNova University Centre, 106 91 Stockholm, Sweden
7
Centro de Astrobiología (CAB), CSIC-INTA, Camino Viejo del Castillo s/n, 28692 Villanueva de la Cañada, Madrid, Spain
8
Max-Planck-Institut für Astronomie, Königstuhl 17, 69117 Heidelberg, Germany
9
Cosmic Dawn Centre (DAWN), Copenhagen, Denmark
10
European Space Agency, Space Telescope Science Institute, Baltimore, Maryland, USA
11
DTU Space, Technical University of Denmark, Elektrovej 327, 2800 Kgs., Lyngby, Denmark
12
Kapteyn Astronomical Institute, University of Groningen, P.O. Box 800 9700 AV Groningen, The Netherlands
13
Telespazio UK for the European Space Agency, ESAC, Camino Bajo del Castillo s/n, 28692 Villanueva de la Cañada, Spain
14
Steward Observatory, University of Arizona, 933 North Cherry Avenue, Tucson, AZ 85721, USA
15
Leiden Observatory, Leiden University, PO Box 9513 2300 RA Leiden, The Netherlands
16
UK Astronomy Technology Centre, Royal Observatory Edinburgh, Blackford Hill, Edinburgh EH9 3HJ, UK
⋆ Corresponding author; This email address is being protected from spambots. You need JavaScript enabled to view it.
Received:
31
July
2024
Accepted:
10
December
2024
Abstract
This paper presents a deep MIRI/JWST medium-resolution spectroscopy (MRS) covering the rest-frame optical spectrum of the GN-z11 galaxy. The [O III] 5008 Å and Hα emission lines are detected and spectroscopically resolved. The line profiles are well modeled by a narrow Gaussian component with intrinsic full widths at half maximum of 189 ± 25 and 231 ± 52 km s−1, respectively. We do not find any evidence of a dominant broad Hα emission line component tracing a broad-line region in a type 1 active galactic nucleus (AGN). The existence of an accreting black hole dominating the optical continuum and emission lines of GN-z11 is not compatible with the measured Hα and [O III] 5008 Å luminosities. If the well-established relations for low-z AGNs apply in GN-z11, the [O III] 5008 Å and Hα luminosities would imply extremely high super-Eddington ratios (λE > 290), and bolometric luminosities ∼20 times those derived from the UV/optical continuum. However, a broad (∼430–470 km s−1) and weak (< 20–30%) Hα line component, tracing a minor AGN contribution in the optical, cannot be completely ruled out with the sensitivity of the current data. The physical and excitation properties of the ionized gas are consistent with a low-metallicity starburst with a star formation rate of 24 ± 3 M⊙ yr−1. The electron temperature of the ionized gas is Te (O++) = 14 000 ± 2100 K, while the direct-Te gas-phase metallicity is 12 + log(O/H) = 7.91 ± 0.07 (Z = 0.17 ± 0.03 Z⊙). The optical line ratios locate GN-z11 in the starburst or AGN region, but they are more consistent with those of local low-metallicity starbursts and high-z luminous galaxies detected at redshifts similar to GN-z11. We conclude that the MRS optical spectrum of GN-z11 is consistent with that of a massive, compact, and low-metallicity starburst galaxy. Its high star formation and stellar mass surface densities are close to those of the densest stellar clusters, and we therefore speculate that GN-z11 might undergo a feedback-free, highly efficient starburst phase. Additional JWST data are needed to validate this scenario and other recently proposed alternatives to explain the existence of bright compact galaxies in the early Universe.
Key words: galaxies: high-redshift / galaxies: ISM / galaxies: individual: GN-z11 / galaxies: starburst
© The Authors 2025
 Open Access article, published by EDP Sciences, under the terms of the Creative Commons Attribution License (https://creativecommons.org/licenses/by/4.0), which permits unrestricted use, distribution, and reproduction in any medium, provided the original work is properly cited.
This article is published in open access under the Subscribe to Open model. This email address is being protected from spambots. You need JavaScript enabled to view it. to support open access publication.
1. Introduction
The James Webb Space Telescope (JWST; Gardner et al. 2023) is revolutionizing our knowledge of the formation of galaxies in the epoch of reionization (EoR) and beyond. It currently places the spectroscopically detection frontier of galaxies up to a redshift of about 14.2 (Carniani et al. 2024, 2025). The detection of strong optical emission lines, such as Hβ, [O III] 4960,5008 Å, and Hα, together with weaker ultraviolet (UV) and optical lines, is starting to reveal the physical properties of galaxies at a redshift beyond 6 (e.g., Cameron et al. 2023a). Star-forming galaxies (SFGs) are commonly characterized by emission lines with high equivalent widths (EWs), with rest-frame values up to 3000 Å (e.g., Boyett et al. 2024). Their spectral energy distribution (SED) and high EW lines are indicative of young stellar populations, < 10 Myr and intermediate stellar masses, log(M* [M⊙]) < 9 (e.g., Matthee et al. 2023; Rinaldi et al. 2023; Tang et al. 2023). The metallicities (Z) of these SFGs range from metal poor (0.02 Z ⊙; Vanzella et al. 2023a) up to one-third solar (e.g., Langeroodi et al. 2023; Curti et al. 2023; Nakajima et al. 2023; Heintz et al. 2023; Sanders et al. 2024; Morishita et al. 2024; Hsiao et al. 2024a), high electron temperatures (Te > 104 K; e.g., Sanders et al. 2024; Hsiao et al. 2024a) and densities (ne > 100 cm−3; e.g., Isobe et al. 2023a; Abdurro’uf et al. 2024), and high photon ionization efficiencies (log(ζion) (Hz erg−1) ≥ 25.5; e.g., Tang et al. 2023; Álvarez-Márquez et al. 2024; Rinaldi et al. 2024). Moreover, active galactic nuclei (AGNs) associated with low-mass black holes (BH; 6 < log(MBH [M⊙]) < 7) have been inferred in the EoR and in numbers larger than previously thought (e.g., Greene et al. 2024; Harikane et al. 2023a; Kocevski et al. 2023; Maiolino et al. 2024a; Kokorev et al. 2023; Juodžbalis et al. 2024). Some of the properties exhibited by these AGNs suggest accretion properties different from those known in low-z AGNs (Maiolino et al. 2024b; Kokubo & Harikane 2024), while the nature and contribution of AGNs in the so-called little red dots (LRDs) identified by JWST are also under discussion (Pérez-González et al. 2024; Iani et al. 2024).
The JWST has photometrically detected a large number of galaxies at redshift above 10 (e.g., Finkelstein et al. 2023; Pérez-González et al. 2023; Robertson et al. 2023), but only a handful of them were spectroscopically confirmed with the detection of the Lyα break or UV and optical emission lines (Curtis-Lake et al. 2023; Harikane et al. 2023b; Arrabal Haro et al. 2023; Bunker et al. 2023; Hsiao et al. 2024b; Zavala et al. 2024; Castellano et al. 2024; Calabro et al. 2024; Carniani et al. 2024). The physical properties of these primordial galaxies are still poorly known because the rest-frame spectral range (< 0.4 μm) covered by NIRCam and NIRSpec is limited. At these redshifts, the rest-frame optical emission lines and continuum moves into the mid-infrared (Álvarez-Márquez et al. 2019), which is the spectral range of MIRI (Rieke et al. 2015; Wright et al. 2015, 2023). Recent studies detected the bright optical lines, [O III] 4960,5008 Å and Hα in some of these primordial galaxies, which highlights the crucial role of MIRI in constraining the nature and physical properties of galaxies during the first 500 Myr of the Universe (Álvarez-Márquez et al. 2024; Hsiao et al. 2024a; Zavala et al. 2024).
The source GN-z11 was discovered by HST and Spitzer based on spectroscopy and multiwavelength photometry (Oesch et al. 2014, 2016). JWST NIRSpec confirmed a spectroscopic redshift of 10.6034 ± 0.0013 (Bunker et al. 2023). JWST NIRCam imaging revealed that GN-z11 is an extremely compact galaxy at UV wavelengths, with an effective half-light radius (Re) of 64 ± 20 pc (Tacchella et al. 2023). It is composed of an unresolved central source and a second component defined by a Sérsic profile with Re = 200 pc and index n = 0.9. Additionally, it has a low-surface-brightness haze about 0 4 to the northeast of the galaxy (Tacchella et al. 2023). A tentative rotation has been inferred from the spatial analysis of the C III] 1907,1909 Å lines in the NIRSpec integral field spectroscopy (IFS; Xu et al. 2024). JWST multiwavelength photometry and spectroscopy provide consistent star formation rates (SFRs) and stellar masses in the range of 20–30 M⊙ yr−1 and 108.7 − 9.1 M⊙ (Bunker et al. 2023; Tacchella et al. 2023), respectively. Millimeter NOEMA observations did not lead to a detection of the rest-frame 160 μm continuum, nor of [C II] 158 μm emission in GN-z11, placing 3σ upper limits of log(Mdust [M⊙]) < 6.9 and log(Mmol, [C II] [M⊙]) < 9.3 on the dust and gas masses (Fudamoto et al. 2024), respectively. These results are consistent with a negligible dust attenuation derived from SED fitting and Balmer decrement analyses (Bunker et al. 2023; Tacchella et al. 2023). Using medium-resolution NIRSpec observations, Maiolino et al. (2024c) suggested that GN-z11 hosts an AGN with a black hole mass of log(MBH [M⊙]) = 6.2 ± 0.3 that accretes material at about five times its Eddington rate. This conclusion was based on the presence of high-excitation (> 60 eV), high critical density (> 105 cm−3), and broad (430–470 km s−1) semi-forbidden and permitted emission lines in the UV spectrum. Further claims of an AGN come from the detection of a continuum excess (blue bump) in the rest-frame 3000–3550 Å spectral range that could originate from complex Fe II emission (Ji et al. 2024a). However, a super-Eddington type 1 AGN scenario for GN-z11 is not supported by cosmological simulations (Bhatt et al. 2024), nor by the low 3σ upper limit from deep X-ray Chandra observations (LX (2–10 keV) < 3 × 1043 erg s−1; Maiolino et al. 2024c) that is a factor of about 5 lower than the expected emission of a type 1 AGN given a BH mass of log(MBH [M⊙]) = 6.2 ± 0.3. NIRSpec spectroscopy also shows GN-z11 with a supersolar N/O abundance, and a series of papers have searched for possible scenarios that could explain that overabundance: (i) intense and densely clustered star formation with a high concentration of Wolf-Rayet stars (Senchyna et al. 2024), (ii) a proto-globular cluster hosting supermassive stars (Charbonnel et al. 2023), (iii) stellar collisions in a dense stellar cluster or a tidal disruption event (Cameron et al. 2023a), (iv) an intermittent star formation history with a quiescent phase lasting about 100 Myr that separates two strong starbursts (Kobayashi & Ferrara 2024), and (v) the formation of second-generation stars from pristine gas and asymptotic giant branch ejecta in a massive globular cluster (D’Antona et al. 2023). Finally, Maiolino et al. (2024d) have suggested the presence of population III stars in the halo of GN-z11.
This paper presents the detection of the brightest optical emission lines, [O III] 5008 Å and Hα, in the GN-z11 galaxy at a redshift of 10.6. Section 2 introduces the MRS observations and calibrations, together with the [O III] 5008 Å and Hα spectra and fluxes. Section 3 presents the results, and it includes subsections discussing the dust attenuation, SFR, and burstiness (Sect. 3.1), the photon production efficiency and Lyα escape fraction (Sect. 3.2), emission line ratios and diagnostic diagrams (Sect. 3.3), the ISM metallicity and physical conditions (Sect. 3.4), ionized gas kinematics and the gas and dynamical masses (Sect. 3.5), and the mass-metallicity relation (Sect. 3.6). Section 4 discusses the AGN and starburst scenarios for GN-z11. Finally, Section 5 gives the summary and conclusion of the paper. Throughout this paper, we assume a Chabrier initial mass function (IMF; Chabrier 2003), vacuum emission line wavelengths, and a flat ΛCDM cosmology with Ωm = 0.310 and H0 = 67.7 km s−1 Mpc−1 (Planck Collaboration VI 2020).
2. Data, calibration, and emission line spectrum
2.1. MIRI observations and data calibration
GN-z11 was observed with the Medium Resolution Spectrograph (MRS; Wells et al. 2015; Argyriou et al. 2023) on 13 March 2024 as part of the cycle 2 JWST program ID 2926 (PI: L. Colina). The observations were performed with the MRS short and medium bands that cover the wavelength ranges of 4.90–6.63 μm and 7.51–10.13 μm for channels 1 and 2, respectively. The MRS channels 1 and 2 cover the optical rest-frame spectrum at a redshift of 10.6, including the main optical emission lines, such as Hβ, [O III] 4960,5008 Å, Hα, [N II] 6550,6585 Å, and [S II] 6718,6733 Å. The total on-source integration time corresponds to 25 248 seconds (7 hours) per MRS band, distributed in 24 dither positions that combine the positive and negative dither patterns optimized for point-like sources. For each dither position, a total of two integrations with 22 groups each were obtained using the SLOWR1 readout mode.
The MRS observations were processed with version 1.16.0 of the JWST calibration pipeline and context 1293 of the Calibration Reference Data System (CRDS). We followed the standard MRS pipeline procedure (Bushouse et al. 2024), with additional customized steps to improve the quality of the final MRS calibrated products (see Álvarez-Márquez et al. 2024, 2023 for details). The final channel 1 and 2 cubes have a spatial and spectral sampling of 0.13″ × 0.13″ × 0.8 nm and 0.17″ × 0.17″ × 1.3 nm (Law et al. 2023), respectively, and a resolving power of about 3500 (Labiano et al. 2021; Jones et al. 2023).
2.2. MRS spectra and emission line fluxes
There is no evidence of spatially extended line emission in the MRS cubes (see Figure 1). This is consistent with the small size of GN-z11 and the effective radius of 0 016 ± 0
 005 that was derived from NIRCam images (Tacchella et al. 2023). This size is smaller than the point spread function (PSF) full width at half maximum (FWHM) of the MRS channels 1 and 2 (∼0
 3–0
3–0 4, Argyriou et al. 2023), and therefore, GN-z11 is considered spatially unresolved in the MRS observations. We extracted the 1D integrated spectra of GN-z11 using a circular aperture with a radius equal to 0
 25 and 0
 3 for channel 1 and 2 (see the dashed cyan circles in Figure 1), respectively. We also extracted 20 1D background spectra using the same apertures at random positions of the MRS FoV clean of any GN-z11 emission. We combined these spectra to generate the 1D median and standard deviation of the local background for channels 1 and 2. The median, which is compatible with zero, was subtracted from the GN-z11 spectra with the goal of removing any systematic residual feature left in the MRS calibration process. The standard deviation was assumed to be the 1σ uncertainty of the GN-z11 spectra. As the GN-z11 is considered spatially unresolved on the MRS observations, we implemented an aperture correction to derive the total [O III] 5008 Å and Hα spectra of GN-z11. For the selected apertures in channels 1 and 2, the aperture-correction factor is 1.64 following the MRS PSF (Argyriou et al. 2023; Patapis in prep.).
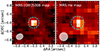 |
Fig. 1. MRS [O III] 5008 Å (left) and Hα (right) emission line maps. The [O III] 5008 Å and Hα line maps are generated by integrating a narrow velocity range, −150 < v [km s−1] < 150, around the peak of each emission line. The dashed cyan circles show the aperture chosen to extract the 1D spectra. The gray area represents the MRS spatial resolution (PSF FWHM) at the observed wavelength of each emission line. These line maps demonstrate that GN-z11 is spatially unresolved in the MRS observations. |
We detected the optical rest-frame [O III] 5008 Å and Hα lines in the MRS spectrum of GN-z11 and established upper limits to the Hβ, [O III] 4960 Å, [N II] 6585 Å, and [S II] 6718,6733 Å lines (see Figure 2). The flux of [O III] 5008 Å and Hα was calculated by integrating each emission line in the velocity range of −250 < v [km s−1] < 300 and taking a redshift of 10.602 as reference. This velocity range delimits the spectral range at which the [O III] 5008 Å and Hα lines have a positive flux (see the red area in Figure 2). The integrated [O III] 5008 Å and Hα lines fluxes are 136 ± 14 and 68 ± 9 × 10⁻¹⁹ erg s−1 cm−2, with signal-to-noise ratios of 10 and 8, respectively. The 3σ upper limits of the Hβ, [O III] 4960 Å, [N II] 6585 Å, and [S II] 6718,6733 Å emission lines were calculated using the same velocity range as for [O III] 5008 Å and Hα. The nondetection of [O III] 4960 Å line is compatible with the theoretical [O III] 5008-to-[O III] 4960 flux ratio of 2.98. The Hβ upper limit is also compatible with a nondetection considering the Hα flux, case B recombination, and no dust attenuation (see Sect. 3.1). The emission line fluxes and upper limits of GN-z11 are summarized in Table 1.
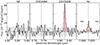 |
Fig. 2. View of the rest-frame optical spectrum of GN-z11 by zooming in the Hβ, [O III] 4960,5008 Å, and Hα emission lines. The continuous black line shows the 1D extracted MRS spectrum. The gray area shows the ±1σ noise calculated from the standard deviation of the local background. The red area shows the spectral range used to calculate the integrated line flux. The vertical dashed black line shows the wavelength of the peak of each emission line considering a redshift of 10.602. |
Integrated emission line fluxes and ratios, results of the [O III] 5008 Å and Hα emission line fits, and derived physical properties of GN-z11.
2.3. [O III] 5008 Å and Hα emission line profiles
The MRS provides the highest spectral resolution of all the JWST instruments, with a resolving power from 4000 to 3000 in channels 1 and 2 (Labiano et al. 2021; Jones et al. 2023). Specifically, the spectral resolution (FWHM) at the observed wavelengths of the redshifted [O III] 5008 Å and Hα lines corresponds to 86 ± 9 km s−1 and 91 ± 9 km s−1, respectively. This spectral resolution, together with the significant detection (8–10σ) of the lines, allowed us to explore the emission line profiles, and therefore, the kinematic properties of GN-z11.
The [O III] 5008 Å and Hα emission lines were spectrally resolved (see Figure 2). We performed a one-component line fit to characterize the [O III] 5008 Å and Hα emission line profiles. For the fit, we considered the two emission lines independently, each modeled by a single Gaussian component without any initial constrains (see Figure 3). The final uncertainties in the fit parameters, such as FWHM and redshift, were obtained as the standard deviation of all the individual measurements of 1000 bootstrapped spectra after adding a random Gaussian noise equal to the RMS to the original spectrum. Table 1 presents the [O III] 5008 Å and Hα FWHMs and the redshifts derived from the fits. The redshift of GN-z11 is 10.6022 ± 0.0004, calculated from the [O III] 5008 Å emission line. It is compatible with the value derived from the Hα, and it agrees within the uncertainties with the previously reported value based on the combination of the R100 and R1000 NIRSpec observations (10.6034 ± 0.0013, Bunker et al. 2023).
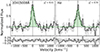 |
Fig. 3. MRS [O III] 5008 Å and Hα emission line fits. The left and right panels show the one-component Gaussian fits, together with the fit residuals, for the [O III] 5008 Å and Hα emission lines, respectively. The continuous black line shows the 1D extracted MRS spectrum. The gray area shows the ±1σ uncertainty calculated from the standard deviation of the local background. The green dashed line shows the one-component Gaussian function that fits the spectra best. The black vertical dashed line is the wavelength at the peak of each emission line considering a redshift of 10.602. The |

The [O III] 5008 Å line profile shows a slight flux excess at velocities ranging from 100 to 350 km s−1 (see Figure 3), which might trace a redshifted faint secondary component, as already identified in other high-z galaxies (e.g. Topping et al. 2024; Tang et al. 2023; Marconcini et al. 2024). However, the significance of this secondary component is low (2σ for a two-component Gaussian fit), and its confirmation requires deeper MRS observations.
2.4. NIRSpec ancillary emission line fluxes
To derive the line ratios and diagnostic diagrams involving the [O II] 3727,3730 Å, [O III] 4364 Å, and Hγ lines, we used the published lines fluxes from the NIRSpec R100 spectrum measured using a five-pixel extraction (see Table 1 from Bunker et al. 2023). The agreement between the NIRSpec R100 spectrum and the NIRCam photometry (Tacchella et al. 2023) after aperture corrections has been demonstrated to be excellent, and within 5% (Bunker et al. 2023). Therefore, we did not implement any normalization factor to the NIRSpec line fluxes when we combined with the aperture-corrected MRS [O III] 5008 Å and Hα fluxes. We only used the relative uncertainties associated with the specific observations. The additional uncertainty due to the current knowledge of the NIRSpec and MIRI absolute spectrophotometry was not taken into account. In general, this is estimated to be at the 5% and 10% level for NIRSpec IFS and MRS JWST observing modes (Rigby et al. 2023)1, respectively.
3. Results
3.1. Dust attenuation, SFR, and burstiness
Previous analyses of NIRSpec spectroscopy and NIRCam photometry derived a low (AV = 0.17 ± 0.03 mag, Bunker et al. 2023) or even negligible (AV = 0.08  mag, Tacchella et al. 2023) dust attenuation in GN-z11. The MRS spectroscopy enabled us to revisit these measurements and extend them into the optical wavelengths using the Hα emission line. The observed Hα/Hβ, Hα/Hγ, and Hα/Hδ line ratios are > 1.5, 5.7 ± 1.0, and 10.8 ± 2.5, respectively. These Balmer line ratios agree within the uncertainties with case B recombination, 2.80 ± 0.07, 5.93 ± 0.09, and 10.68 ± 0.17, respectively, for a Te = 14 000 ± 2100 K and ne = 1000 cm−3 (see Sect. 3.4). These results are compatible with no dust attenuation in GN-z11, and we therefore assumed an AV = 0 throughout this paper.
The instantaneous SFR derived from the total Hα luminosity, SFR(Hα), is 56 ± 8, 34 ± 5, 24 ± 3, and 22 ± 3 M⊙ yr−1 for metallicities equal to solar (Kennicutt & Evans 2012), 0.28 Z⊙ (Reddy et al. 2018), 0.1 Z⊙ (Theios et al. 2019), and 0.05 Z⊙ (Reddy et al. 2022), respectively. These values agree with those derived from the UV luminosity. Following Calzetti (2013) and an UV luminosity density of 1.7 × 1029 erg s−1 Hz−1 at 1500 Å (Bunker et al. 2023), we derived a SFR(UV) of 15, 22, and 51 M⊙ yr−1 for a solar metallicity and constant star formation over 100, 10, and 2 Myr, respectively. The SFR(UV) decreases to 12 M⊙ yr−1 for a metallicity of 0.1 Z⊙ and a constant star formation over 100 Myr (Theios et al. 2019). The metallicity and star formation history (SFH) highly affect the derivation of the SFR, which increases by a factor of two from 0.1 Z⊙ to solar metallicity, and by a factor of three from 100 to 2 Myr in constant SFHs. For a metallicity of ∼0.1 Z⊙ and a constant SFH over 10 Myr, the SFR in GN-z11 traced by the UV continuum and Hα line is in the range of 18 and 24 M⊙ yr−1. These values are consistent with the SFR previously derived from NIRSpec spectroscopy (Bunker et al. 2023) and NIRCam SED-fitting analysis (Tacchella et al. 2023), 18.8  and 21
  M⊙ yr−1, respectively.
The SFR(Hα)-to-SFR(UV) ratio is often used to study the star-formation burstiness in galaxies (Smit et al. 2016; Atek et al. 2022, and references therein). The motivation is based on the different timescales for the star formation as traced by Hα (< 10 Myr) and the UV continuum (∼100 Myr). We obtained an SFR(Hα)-to-SFR(UV) ratio equal to 2.0 ± 0.3 for a metallicity equal to 0.1 Z⊙, and considering the SFR(Hα) and SFR(UV) derived using a constant SFH over 10 Myr and 100 Myr, respectively. An SFR(Hα)-to-SFR(UV) ratio higher than one implies that GN-z11 is currently in a bursty phase, and it suggests that its stellar population is dominated by young stars (≤10 Myr). However, the measured SFR(Hα)-to-SFR(UV) ratio of GN-z11 places it on a somewhat lower star formation burstiness relative to z > 8 galaxies with an average value of ∼4 (Langeroodi & Hjorth 2024a).
3.2. Photon production efficiency and Lyα escape fraction
The ionizing photon production efficiency, log(ζion), is given as the ratio of the ionizing to the nonionizing UV flux. It can be derived from the Hα and UV continuum luminosities when the ionizing photon escape fraction (fesc, LyC) is known. The SED fitting and Lyα profile analyses of GN-z11 gave fesc, LyC equal to 0.03 (Bunker et al. 2023) and 0.024 (Hayes & Scarlata 2023), respectively. An indirect measurement of the fesc, LyC using the UV slope (βUV) provides a higher value of 0.11 ± 0.09 (Chisholm et al. 2022), but it is compatible within the uncertainties. Given the low fesc, LyC values measured by different methods, we assumed fesc, LyC = 0 throughout this paper.
Following the prescription presented in Álvarez-Márquez et al. (2024), an ionizing photon production efficiency of log(ζion) = 25.66 ± 0.06 Hz erg−1 was obtained based on our MRS Hα luminosity and an UV luminosity density of 1.7 × 1029 erg s−1 Hz−1 at 1500 Å (Bunker et al. 2023). This value agrees with the previous value derived from the NIRSpec Hγ luminosity (25.67 ± 0.02 Hz erg−1; Bunker et al. 2023). The photon production efficiency of GN-z11 is significantly higher than the canonical value (25.2 ± 0.1 Hz erg−1; Robertson et al. 2023), but it follows the envelope of the value inferred from intermediate-redshift galaxies of log(ζion) and extrapolated as a function of redshift (25.46 ± 0.28 Hz erg−1, Matthee et al. 2017). The log(ζion) value in GN-z11 is typical of EoR sources (e.g., Atek et al. 2024; Fujimoto et al. 2023; Tang et al. 2023; Morishita et al. 2023; Rinaldi et al. 2024; Álvarez-Márquez et al. 2024; Morishita et al. 2024; Simmonds et al. 2024) and of intermediate-redshift galaxies, 2 < z < 5, with the highest specific SFR, log(sSFR[yr−1]) ∼ −7.5, (Castellano et al. 2023). Compared with galaxies at z > 10, GN-z11 has similar values as the GHZ2/GLASS-z12 galaxy at a redshift of 12.34 (25.7 Hz erg−1, Calabro et al. 2024), but it is significantly higher than MACS0647-JD galaxy at a redshift of 10.17 (25.3 ± 0.1 Hz erg−1, Hsiao et al. 2024a). The similarity of GN-z11 with the photon production efficiency of the resolved young stellar cluster detected in the strongly lensed z ∼ 6 Sunrise arc (Vanzella et al. 2023b) and the spatially resolved strong-lens galaxy RXCJ0600-z6-3, (Giménez-Arteaga et al. 2024) suggests that GN-z11 might be formed by a combination of many young stellar clusters with ages at their maximum photon production efficiency (see Sect. 4.2 for more details).
The Lyα escape fraction was derived by combining our Hα with existing Lyα measurements. The Lyα emission line was detected in medium-resolution (R ∼ 1000) NIRSpec observations with a total flux of 23 ± 3 × 10⁻¹⁹ erg s−1 cm−2 (Bunker et al. 2023). Assuming a case B recombination Lyα/Hα line ratio of 9.28 (for Te = 14 000 K and ne = 1000 cm−3; see Sect. 3.4), we derived a Lyα escape fraction of 0.04 ± 0.01 not corrected for the effect of the intergalactic medium. This value agrees with the previously reported value using the Hγ (0.03 , Bunker et al. 2023).
3.3. Emission line ratios and diagnostic diagrams
We combined the MRS [O III] 5008 Å and Hα line fluxes and upper limits of [N II] 6585 Å and [S II] 6718,6733 Å with previous NIRSpec R100 [O III] 4364 Å, [O II] 3727,3730 Å, and Hγ line fluxes (see Sect. 2.4 for more details) to derive the commonly used line ratios. The following emission line ratios were used in the diagnostic diagrams:
![Mathematical equation: $$ \begin{aligned} \mathrm{R2}&= \log ([\mathrm O\,II ]3727, 3730\,\AA /\mathrm{H} \beta ) \\ \mathrm{R3}&= \log ([\mathrm O\,III ]5008\,\AA /\mathrm{H} \beta ) \\ \mathrm{R23}&= \log (([\mathrm O\,III ]5008\,\AA + [\mathrm O\,II ]3727, 3730\,\AA )/\mathrm{H} \beta ) \\ \mathrm{O32}&= \log ([\mathrm O\,III ]4960,5008\,\AA /[\mathrm O\,II ]3727, 3730\,\AA ) \\ \mathrm{O33}&= \log ([\mathrm O\,III ]5008\,\AA /[\mathrm O\,III ]4364\,\AA ) \\ \mathrm O3H\gamma&= \log ([\mathrm O\,III ]4364\,\AA /\mathrm{H} \gamma ) \\ \mathrm{N2}&= \log ([\mathrm N\,II ]6585\,\AA / \mathrm{H} \alpha ) \\ \mathrm{S2}&= \log ([\mathrm S\,II ]6718,6733\,\AA / \mathrm{H} \alpha ), \\ \end{aligned} $$](/articles/aa/full_html/2025/03/aa51731-24/aa51731-24-eq15.gif)
where Hβ was derived from the Hα assuming a case B recombination Hα/Hβ line ratio of 2.80 (for Te = 14 000 K and ne = 1000 cm−3; see Sect. 3.4), and the [O III] 4960 Å was derived from [O III] 5008 Å using the theoretical value of 2.98. The line ratios along with their associated uncertainties are listed in Table 1.
Figure 4 presents the position of GN-z11 on the R3−R2, O32−R23, O3Hγ−O32 and O3Hγ−O33 diagrams. For comparison, we include the line ratios of galaxies available at z > 8: GN-z8-LAE (z = 8.3; Navarro-Carrera et al. 2024), CEERS-1019 (z = 8.7; Marques-Chaves et al. 2024a), MACS1149-JD1 (z = 9.1; Stiavelli et al. 2023), GN-z9p4 (z = 9.4; Schaerer et al. 2024), RXJ2129-z95 (z = 9.5; Williams et al. 2023), MACS0647-JD (z = 10.2: Abdurro’uf et al. 2024), and GHz2 (z = 12.3; Calabro et al. 2024). Samples of SFGs and type 1 AGNs at different redshifts are also presented. On the one hand, we included z > 3 SFGs identified in large JWST surveys (CEERS, Sanders et al. 2024; JADES, Bunker et al. 2023; Cameron et al. 2023a; and GLASS, Mascia et al. 2023) as well as individual targets (Nakajima et al. 2023) and the stacked FRESCO subsample of [O III] line emitters at z > 6.8 (Meyer et al. 2024). For completeness, we also included the ratios for the JADES stacked subsamples at z ∼ 6 and z ∼ 8 from Cameron et al. (2023a). On the other hand, we included a sample of high-z (z > 5) type 1 AGNs observed with the JWST (Bunker et al. 2023; Curti et al. 2023; Kokorev et al. 2023; Nakajima et al. 2023; Furtak et al. 2024; Juodžbalis et al. 2024; Übler et al. 2024). Finally, we also show a reference sample of known low-redshift metal-poor star-forming galaxies (12 + log(O/H) < 8.0; Izotov et al. 2006; Izotov & Thuan 2011; Izotov et al. 2016, 2024).
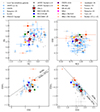 |
Fig. 4. Line ratio diagrams. This figure shows the position of GN-z11 (red star) on the R2–R3, R23–O32, O32–O3Hγ and O32–O33 diagrams. JWST-detected z > 8 galaxies are represented as filled circles. The blue and red markers represent the high-z SFGs and type 1 AGNs from different samples, respectively. Further details of these samples are presented in Sect. 3.3. The local low-metallicity subsample (gray markers), drawn from Izotov et al. (2006), Izotov & Thuan (2011), Izotov et al. (2016, 2019, 2024), was selected to be 12 + log(O/H) < 8. The JADES subsample, drawn from Bunker et al. (2023) and Cameron et al. (2023a), was selected to be z > 3. The dashed lines represent the separation between the AGN-dominant and the AGN+SFGs regions presented by Mazzolari et al. (2024). When no Hγ data were available, we considered Hγ = Hα/5.93. |
Although high-z galaxies identified as type 1 AGNs and low-metallicity SFGs at high and low redshift overlap in the R3−R2 and O32−R23 diagrams to some extent, a large fraction of SFGs populate the region with R3 < 0.8 and O3 < 1.25, while most AGNs have values above these limits. Type 1 AGNs and SFGs are also clearly separated in the recent O3Hγ−O32 and O3Hγ−O33 diagnostic diagrams (Mazzolari et al. 2024). Most confirmed type 1 AGNs show a O3Hγ > − 0.5 with a large fraction of the high-z SFGs and the low-z SFGs below that value. The position of GN-z11 in these diagrams, with ratios 0.75 ± 0.07 (R3), 1.32 ± 0.05 (O32) and −0.71 ± 0.14 (O3Hγ) within the range of values covered by local low-metallicity and high-z SFGs, favors a starburst nature for the ionizing source. However, ionization models are able to reproduce the range of observed line ratios covered by both AGNs and SFGs with the ionizing spectrum of an AGN when low-metallicity, high electron density, and large ionization parameters are invoked (Nakajima et al. 2022; Calabro et al. 2024; Mazzolari et al. 2024). Therefore, the position of GN-z11 in these diagrams should not be taken by itself as the unambiguous identification of a starburst as the dominant ionizing source in this galaxy, and additional tracers should be considered.
We also obtained upper limits for the [N II] 6585 Å and [S II] 6718,6733 Å emission lines (see Table 1). We therefore explored the position of GN-z11 in the traditional BPT diagrams (Baldwin et al. 1981; Kewley et al. 2001; Kauffmann et al. 2003). In addition to the R3 value of 0.75, 3σ upper limits for the N2 and S2 line ratios of −0.4 and −0.3 were derived, respectively. These values place GN-z11 in the starburst or composite region in the R3−N2 diagram, and in the starburst to Seyfert transition region in the R3−S2 diagram. GN-z11 has a gas-phase metallicity of 12 + log(O/H) = 7.91. There is a strong decrease in the nitrogen and sulfur lines relative to hydrogen for lower metallicities (e.g., Cameron et al. 2023a), and therefore, the actual N2 and S2 upper limits cannot place stringent constraints using these diagnostics. Deeper MRS observations are needed to measure the [N II] 6585 Å and [S II] 6718,6733 Å fluxes or to establish stricter upper limits, which would help us to determine the exact position of GN-z11 in these traditional BPT diagrams.
3.4. Gas-phase metallicity and physical conditions (Te, U)
The significant detection of the [O III] 5008 Å line with the MRS, together with the published [O III] 4364 Å flux (Bunker et al. 2023), allowed us to derive the Te of the O++ region using the [O III] 5008/[O III] 4364 flux ratio and the metallicity applying the direct-Te method. We assumed a ne = 1000 cm−3 based on the redshift evolution of the electron density presented in Abdurro’uf et al. (2024). According to this relation, the electron density of the ISM in galaxies increases with redshift (∝(1+z)1.2 ± 0.04). For the redshift of GN-z11 (z = 10.602), the predicted electron density is ∼1000 cm−3, which agrees with the value (log(ne [cm−3]) = 2.9 ± 0.5) in MACS0647-JD at z = 10.2 (Abdurro’uf et al. 2024; see also Isobe et al. 2023a). We did not consider any uncertainty in the ne determination as the Te is insensitive to density changes for ne ≲ 105 cm−3. The electron density we assumed for the optical emitting gas in GN-z11 is at least two orders of magnitude lower than the one derived from the UV lines, which are higher than 105 cm−3, and as high as 109 cm−3 (Maiolino et al. 2024c). At these high densities, the measured [O III] 5008/[O III] 4363 ratio would be produced in an ionized medium with very low electron temperatures, 8100 K and 4600 K for electron densities of 106 and 1010 cm−3, respectively. However, these low temperatures are not compatible with those derived from the [O III] 4363/[Ne III] 3869 ratio, which cover the range 10 500–23 600 K for different metallicities (Cameron et al. 2023b). Differences in the electron densities derived from the UV and optical lines have been previously found in galaxies at low (Mingozzi et al. 2022), intermediate (Acharyya et al. 2019), and high (Ji et al. 2024b, Crespo-Gómez in prep.) redshifts. These differences in the density are understood as evidence for a stratified interstellar medium (ISM) in which the lower-ionization optical lines trace more extended, lower-density ionized regions, while the higher-ionization UV lines probe the inner and more densely ionized gas clouds. This stratification has been observed in galaxies with a well-identified AGN (GS_3073 at z = 5.5, Ji et al. 2024b) and with an extremely compact starburst (RXCJ2248-ID at z = 6.1, Topping et al. 2024; Crespo-Gómez, in prep.). Thus, the stratification of the ionized ISM, covering a wide range of electron densities, appears to be independent of the ionizing source, which can be either a young massive starburst or an AGN (Pascale et al. 2023; Ji et al. 2024a).
We obtained an electron temperature for the O++ region of Te [O++] = 14 000 ± 2100 K considering an O33 ratio of 1.77 ± 0.14 and an ne of 1000 cm−3 using the getTemDen module from the code Pyneb (Luridiana et al. 2015). Following the Te [O+] = 0.7 × Te [O++] + 3000 K relation presented by Campbell et al. (1986), we obtained an electron temperature for the low-ionization zone of Te [O+] = 12 800 ± 1500 K. We derived a compatible value (i.e., 13 400 K) when we applied the Te [O++] − Te [O+] relation for low-metallicity galaxies (i.e., Z ∼ 0.1 Z⊙) presented in Izotov et al. (2006). We also used the Langeroodi & Hjorth (2024b) nonparametric calibration of the Te [O++] − Te [O+] relation to estimate the Te [O+] based on the directly measured Te [O++], R2, and R3. We found Te [O+] = 15 000 ± 450 K.
The ionic O+/H+ and O++/H+ abundances were calculated using Pyneb for the Te appropriate to each ion and the R2 and R3 line ratios (see Table 1), respectively. We assumed the total oxygen abundance to be the sum of these two phases, as the contribution of O+ + + was found to be negligible even in high-ionization sources (Berg et al. 2018, 2021). This procedure yielded a 12 + log(O/H) value of 7.91 ± 0.07, which corresponds to 0.17 ± 0.03 Z⊙, assuming a solar metallicity value of 12 + log(O/H) = 8.69 (Asplund et al. 2009)2. We obtained similar results, 0.16 ± 0.02 Z⊙, when we used the expressions from Pérez-Montero (2017) based on the R2 and R3 ratios. A slightly lower metallicity, 0.08 ± 0.02 Z⊙, was derived when we used the metallicity indicator proposed by Izotov et al. (2019), which combines R23 and O32 to improve the accuracy in the low-metallicity regime. The Izotov et al. (2019) relation was derived for 12 + log(O/H) < 7.5, and therefore, our value is based on an extrapolation. Additional empirical relations based on local analogs of high-z galaxies presented in Bian et al. (2018) yield a slightly higher metallicity of 12 + log(O/H) = 8.05 ± 0.15 (i.e., ∼0.23 Z⊙). Using the genesis-metallicity (Langeroodi & Hjorth 2024b), adopting the nonparametric electron temperature measurements mentioned above, we found 12 + log(O/H) = 7.86 ± 0.11, which is fully compatible with the values from the direct-Te method.
For completeness, we considered the hypothesis that the ionization of the nebular emission traced by the oxygen lines might be due to an AGN and followed the so-called Te-AGN method (Dors et al. 2020a and Dors 2021) to derive the metallicity. This method is a modification of the Te direct method for HII regions considering a different Te [O++] − Te [O+] relation. Following this method and using the O32 ratio, we obtained Te [O+] = 9400 K and Te [O++] = 14 100 K. When we considered that the O+/H+ + O++/H+ abundance traces ∼80% of the total O/H abundance in AGNs (Dors et al. 2020b), we obtained a metallicity of 12 + log(O/H) = 7.93. This value agrees with those obtained assuming HII ionization, and therefore, the HII and AGN ionization processes both predict the same metallicity in GN-z11.
Although we considered different methods based on multiple line ratios in this section, we observe that all of them give similar metallicities, with values ranging between 0.08 and 0.23 Z⊙. These results strengthen the value obtained with Pyneb (i.e., 12 + log(O/H) = 7.91 ± 0.07), which we assumed as the fiducial value. A combined ALMA and JWST analysis of the JADES-GS-z14-0 galaxy at z = 14.2 shows a metallicity similar to that of GN-z11 (0.17 Z⊙; Carniani et al. 2025). The bright galaxies (MUV = −21.8–−20.8) GN-z11 and JADES-GS-z14-0 already present an enriched ISM 300–440 Myr after the Big Bang. Together with their estimated high stellar and dynamical masses (∼109 M⊙), this suggests that massive and efficient stellar build-up occurred at even earlier times in the Universe.
The detection of [O III] 5008 Å for GN-z11 allowed us to compute its O32 ratio (1.32 ± 0.05), which is a commonly used tracer of the ionization parameter. Based on the O32 − log(U) expressions presented in Díaz et al. (2000) and Papovich et al. (2022), we obtained an ionization parameter log(U) of −2.06 ± 0.06 and −1.81 ± 0.02, respectively. Using the metallicity-dependent calibration presented in Berg et al. (2019), which is based on CLOUDY models, we obtained a similar value (−1.97 ± 0.06) adopting 0.1 Z⊙. These results agree with a previous value (log(U) = −2.3 ± 0.9) derived from SED fitting (Bunker et al. 2023). We also observe that the ionization parameter log(U) ∼ − 2 of GN-z11 agrees with those values found in other z > 8 galaxies. In particular, Zavala et al. (2024) found log(U) = −1.8 ± 0.3 for GHZ2 at z = 12.3, while Hsiao et al. (2024a) obtained log(U) = −2.0 ± 0.1 for MACS0647-JD at z = 10.2.
3.5. Ionized gas kinematics, and gas and dynamical masses
The [O III] 5008 Å and Hα emission lines are well modeled by a one-component Gaussian fit, with intrinsic FWHMs of 189 ± 25 and 231 ± 52 km s−1 (see Figure 3), respectively. These FWHMs are narrower by about a factor of two than the FWHMs (430–470 km s−1) of the Mg II and N IV] UV emission lines obtained from a medium-resolution (R ∼ 1000) NIRSpec spectrum (Maiolino et al. 2024c). There is therefore no evidence that a dominant broad Hα component is associated with the broad line regions (BLR) of a type 1 AGN with a BH mass of log(MBH[M⊙]) = 6.2 ± 0.3, as previously inferred from the UV lines (see Maiolino et al. 2024c and Sect. 4.1 for a more detailed discussion). However, for an FWHM of 470–430 km s−1 and a BH mass of log(MBH[M⊙]) = 6.2, the expected flux of a broad Hα component associated with the BLR is about 2–3 × 10⁻¹⁸ erg s−1 cm−2. An Hα component like this is below the detection limit (∼2σ) of the current MRS observation, and therefore, a nondominant weak broad Hα component associated with the BLR cannot be ruled out in this work. This hypothetical component, if present, would represent a small fraction (< 20–30 %) of the total flux of the Hα line.
A good correlation exists between the velocity dispersion of the stellar distribution and the width of the [O III] 5008 Å line, even in type 1 AGNs (e.g., Greene & Ho 2005a; Le et al. 2023). The dynamical mass can therefore be derived from the width of the [O III] 5008 Å systemic component (FWHM of 189 ± 25 km s−1) under the hypothesis that the mass enclosed within the compact size of GN-z11 (64 ± 20 pc, Tacchella et al. 2023) is virialized, and with a nonsignificant rotational component. Following Álvarez-Márquez et al. (2024), a dynamical mass of 1.1 ± 0.4 × 10⁹ M⊙ was measured for GN-z11. This value agrees with the estimated stellar masses derived from the NIRSpec R100 spectrum (M* = 5.4 × 10⁸ M⊙; Bunker et al. 2023) and NIRCam multiwavelength SED fitting (M* = 1.3
 × 109 M⊙; Tacchella et al. 2023), and it suggests that the dynamical mass in this compact source is dominated by the stellar component. An upper limit to the dynamical mass of 3.5 ± 0.3 × 10⁹ M⊙ is obtained if the size of the [O III] emitting gas corresponds to that of the extended component (196 ± 12 pc) that was identified in the NIRCam images (Tacchella et al. 2023).
The total amount of ionized gas can be derived from the Hα luminosity and when we assume that all the Hα emitting gas is emitted in the low-density regions. Following Dopita & Sutherland (2003), and considering an electron density of 103 cm−3, we obtained a total ionized gas mass of ∼2 × 10⁷ M⊙. The mass in ionized gas represents a small fraction (< 2 %) of the total mass in the galaxy and is higher than the 3σ upper limit of the dust mass (log(Mdust[M⊙]) < 6.9) obtained from deep NOEMA imaging (Fudamoto et al. 2024). The amount of molecular mass based on the 3σ [C II] 158 μm upper limit corresponds to < 2 × 10⁹ M⊙ (Fudamoto et al. 2024). In addition, the size (Strömgren radius) of the ionized nebula can also be estimated in the ideal case of a medium with a constant density, and assuming an ionizing escaping fraction equal to zero. For an average electron density of 103 cm−3, a radius of 64 pc was obtained. Although this size agrees well with the effective radius of GN-z11 (Tacchella et al. 2023), it might represent a lower limit to the radius of an ionized nebula with a lower density and lower surface brightness (∼300 pc for a density of 102 cm−3). Evidence for an extended ionized nebula around GN-z11 at distances of 0.8 kpc (Bunker et al. 2023) and even a low surface brightness up to 0 4 (i.e., 1.6 kpc) have been claimed from NIRSpec Lyα integral field spectroscopy (Maiolino et al. 2024d). Deeper integral field spectroscopy with the JWST is required to identify the presence and structure of this low surface brightness and extended ionized nebula with optical lines.
3.6. Mass-metallicity relation
We investigated the chemical evolutionary stage of GN-z11 in the context of its location in the mass-metallicity diagram. Figure 5 shows the position of GN-z11 and other z > 7 galaxies in the mass-metallicity diagram. This includes galaxies at cosmic dawn such as MACS1149-JD1 at z = 9.11 (Stiavelli et al. 2023), RXJ2129-z95 at z = 9.51 (Williams et al. 2023), MACS0647–JD at z = 10.17 (Hsiao et al. 2024a), CEERS–1019 at z = 8.7 (Nakajima et al. 2023; Marques-Chaves et al. 2024a), GN-z9p4 at z = 9.38 (Schaerer et al. 2024), GHz2 at z = 12.3 (Zavala et al. 2024), JADES-GS-z9-0 at z = 9.43 (Laseter et al. 2024; Curti et al. 2024a), and other 7 < z < 9 galaxies from Langeroodi et al. (2023), Nakajima et al. (2023), Curti et al. (2024b), and Morishita et al. (2024). The highest-z inference of the mass-metallicity relation available in the literature, at z ∼ 8 (Langeroodi et al. 2023), is shown as the red line and the shaded red region.
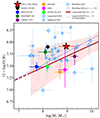 |
Fig. 5. Mass-metallicity diagram for z > 7 galaxies. The large red star shows the measured stellar mass and gas-phase metallicity for GN-z11. The colored circles show the location of the remaining z > 9 galaxies, compiled from the literature: MACS1149-JD1 (Stiavelli et al. 2023), RXJ2129-z95 (Williams et al. 2023), MACS0647–JD (Hsiao et al. 2024a), CEERS–1019 (Nakajima et al. 2023; Marques-Chaves et al. 2024a), GN-z9p4 (Schaerer et al. 2024), GHz2 (Zavala et al. 2024), and JADES-GS-z9-0 (Laseter et al. 2024; Curti et al. 2024a). The empty blue symbols indicate the mass and metallicity of the 7 < z < 9 galaxies, compiled from Langeroodi et al. (2023) (pluses), Nakajima et al. (2023) (stars), Curti et al. (2024b) (squares), and Morishita et al. (2024) (triangles). The dashed blue line shows the best-fit mass-metallicity relation based on a sample of direct-method metallicity measurements at 3 < z < 9.5 (Morishita et al. 2024). The solid red line and the shaded red region show the best-fit mass-metallicity relation and its uncertainty at z ∼ 8 as measured by Langeroodi et al. (2023). GN-z11 agrees with the best-fit mass-metallicity relation at z ∼ 8, consistent with little to no evolution in the normalization of the mass-metallicity relation at z > 6. The stellar mass of GN-z11 is a mean of the values presented in Bunker et al. (2023) and Tacchella et al. (2023). |
The stellar mass and gas-phase metallicity of GN-z11 agree with the best-fit mass-metallicity relation at z ∼ 8. In general, this applies to the z > 9 galaxies shown in Figure 5, all of which are scattered around the z ∼ 8 relation and are consistent with this relation within 1σ. This suggests that the normalization of the mass-metallicity relation does not evolve noticeably at z > 8. This interpretation is consistent with previous results based on numerical and semi-analytical simulations (see e.g., Ma et al. 2016; Ucci et al. 2023; Marszewski et al. 2024) and with recent observational JWST NIRSpec results (Langeroodi et al. 2023; Curti et al. 2024b; Nakajima et al. 2023), all of which suggest that the redshift evolution of the normalization of the mass-metallicity relation slows down significantly at redshifts above z = 6.
4. Discussion. The nature of GN-z11
The new MRS measurements of the [O III] 5008 Å and Hα lines establish the electron temperature and metallicity of the ionized gas. The derived direct-Te gas-phase metallicity of GN-z11 follows the mass-metallicity relation for galaxies above redshift 8. The ratios of the optical emission lines in GN-z11 are in the range of values that are typically measured in low-z low-metallicity and high-z star-forming galaxies, favoring the starburst nature of GN-z11 (see also Tacchella et al. 2023; Bunker et al. 2023). However, previous diagnostics based on the ratios of some ultraviolet lines and their widths suggest that GN-z11 could host an AGN (Maiolino et al. 2024c, Ji et al. 2024a). In this section, we discuss the AGN and starburst scenarios of GN-z11 from the perspective of the new MRS observations.
4.1. A type 1 AGN?
The presence of a type 1 AGN in GN-z11 has been proposed based on the detection of some UV emission lines in the medium-resolution (R ∼ 1000) NIRSpec spectrum (Maiolino et al. 2024c). The lines trace the relatively broad semiforbidden (FWHM = 470 ± 50 km s−1, N IV] 1487 Å) and permitted lines (FWHM = 430 ± 65 km s−1, Mg II 2800 Å), and some lines emitted in regions with high electron densities (> 105 cm−3, [N IV] 1483,1486 Å, N III] multiplets). These properties are compatible with the scenario in which the line emission comes from a broad line region (BLR) around a black hole with a mass log(MBH[M⊙]) = 6.2 ± 0.3. The differences in the width (FWHM) of the UV lines, with the semiforbidden (N IV] 1486 Å) and permitted (Mg II 2800 Å) lines broader than the optical forbidden lines ([O II] 3727,3729 Å and [Ne III] 3870 Å), have been interpreted as evidence for a narrow-line Seyfert 1 (NLS1) type AGN in GN-z11 (Maiolino et al. 2024c). Further, to explain the continuum at rest-frame wavelengths 3000–4000 Å, a scenario invoking the presence of two different ionized regions was considered: a hot and dense BLR that dominates the broad Balmer emission, and a colder, less dense gas that emits the narrow forbidden lines and also contributes (but subdominantly) to the Balmer emission (Ji et al. 2024a). The presence of high-energy photons (above 64 eV) has been identified by the detection of the [Ne IV] 2422,2424 Å emission line. This is considered as an unambiguous tracer of AGN radiation (Maiolino et al. 2024c). However, recent NIRSpec integral field spectroscopy identified extended [Mg IV] 4.487 μm (ionization potential of 80 eV) emission in some low−z luminous infrared starburst galaxies with high SFR surface densities (Pereira-Santaella et al. 2024). The line ratios are consistent with shocks with velocities of about 100–130 km s−1. These shocks could also produce strong [Ne IV] 2422,2424 Å emission, around 10% of Hβ emission (Pereira-Santaella, private comm.). Thus, while AGNs naturally produce high-energy radiation, shocks could also produce high-energy photons capable of ionizing lines such as [Ne IV] 2422,2424 Å.
In the following, we explore whether a dominant type 1 AGN might be present and the scenario of two ionized regions in the light of our new MRS observations. We first discuss the implications derived from the hypothesis that the Hα line is fully emitted in a BLR around a massive black hole. We further discuss whether the MRS data favor the hypothesis of two different ionized regions.
4.1.1. Width of the Hα line emission and BH mass
The high spectral resolution of the MRS allowed us to resolve the Hα line and establish its intrinsic line width and luminosity. The mass of the potential BH was estimated following the well-established empirical relation between the BH mass and the Hα FWHM and luminosity (Shen et al. 2011; see also Bosman et al. 2024). A good agreement was demonstrated between the BH mass estimates based on the Mg II 2800 Å and Hα lines in the 107–109 M⊙ mass range (Matsuoka et al. 2013). This was recently also confirmed for the luminous quasar J1120+0641 at a redshift of 7.1. The Hα MRS measurements agree very well with previous Mg II estimates (1.52 ± 0.17) × 109 M⊙ and (1.35 ± 0.04) × 109 M⊙ (Bosman et al. 2024), respectively.
Under the hypothesis that the luminosity and width of the Hα line in GN-z11 were entirely produced in a high-density broad line region (BLR) through radiation from an AGN, the BH mass in GN-z11 would be 6 × 10⁵ M⊙ for an Hα FWHM of 231 ± 52 km s−1. The derived BH mass is lower by about a factor of three than the value of log(MBH[M⊙]) = 6.2 ± 0.3 (Maiolino et al. 2024c) estimated from the lower-resolution NIRSpec spectrum and the Mg II 2800 Å line, but it is compatible within the uncertainties. The agreement apparently supports the presence of a low-mass type 1 AGN in the nucleus of GN-z11. The BH mass value would only be correct under the assumption that the known Hα to BH mass relation is still valid for a narrow Hα line such as measured in GN-z11. The same applies to the empirical relation between the mass of a BH and the Mg II 2800 Å line properties established for low-redshift type 1 AGNs (Vestergaard & Osmer 2009). However, there is no empirical evidence that the relation of the emission line to BH mass can be directly extrapolated to the narrow Hα emission line detected in GN-z11. As presented in the following sections, the empirical evidence for a ∼0.6−1.4 × 10⁶ M⊙ BH with radiation properties similar to those of low-z AGNs is not supported by the luminosities of the [O III] 5008 Å and Hα lines.
4.1.2. Hα versus X-ray and optical luminosities
Following the scenario in which the Hα, optical continuum, and X-ray 2–10 keV emission is dominated by an AGN, the presence of a type 1 AGN appears to contradict two well-known relations for low-z AGNs: (i) the Hα to the 2–10 keV X-ray emission (Ho et al. 2001; Jin et al. 2012), and (ii) the Hα to optical continuum flux at 5100 Å (Greene & Ho 2005b).
GN-z11 has not been detected in X-rays, but a 3σ upper limit of 3 × 1043 erg s−1 has been derived for its 2–10 keV luminosity (LX(2–10 keV)) assuming the typical photon index for narrow-line Seyfert 1 galaxies (NLS1; Maiolino et al. 2024b). Following the LX(2–10 keV)-to-L(Hα) relation, the expected LX(2–10 keV) would be in the range of 1.2−1.8 × 1044 erg s−1, that is, higher by a factor of 4–6 than the current 3σ upper limit for GN-z11. However, the estimated X-ray emission in high-z type 1 AGNs is highly uncertain (Maiolino et al. 2024b), and therefore, the discrepancy identified in GN-z11 has to be taken with caution. The recent analysis of deep Chandra X-ray 2–10 keV observations for the high-z JWST-detected type 1 AGNs indicates that most of them are not detected. This places strong upper limits on their LX(2–10 keV) luminosities (Maiolino et al. 2024c). These AGNs appear to be fainter by one to two orders of magnitude than their low-z counterparts. A similar conclusion was derived for little red dots (LRDs) in the lensing cluster A2744 that contains AGNs (Ananna et al. 2024). The sources that are not detected in X-rays imply that either the BH is less massive than previously thought or that the accretion of material proceeds with a corona that does not emit strongly in X-rays. In summary, the results derived for GN-z11 and those for the high-z JWST-detected AGNs suggest that if a type 1 AGN is present, the X-ray spectrum does not follow the standard SED of low-z counterparts. On the other hand, type 2 AGNs are underluminous in X-rays relative to Hα, with a median LX(2–10 keV)/L(Hα) = 2 (Ho et al. 2001). GN-z11 with a LX(2–10 keV)/L(Hα) < 2.8 could also be consistent with hosting a type 2 low-luminosity AGN. Thus, based on the Hα to X-ray emission, neither the presence nor the absence of an AGN can be concluded.
In the optical, there is a well-established correlation between the Hα and the 5100 Å luminosities for type 1 AGNs that covers a wide range of Hα luminosities (1041–1044 erg s−1, Greene & Ho 2005b). This correlation indicates that the optical continuum measured at 5100 Å traces the far-UV ionizing continuum that produces the optical emission lines. Following Greene & Ho (2005b), the predicted flux at the redshifted optical continuum is 0.24 μJy, which is well above the extrapolated continuum flux of 0.10 μJy from the NIRCam imaging (Tacchella et al. 2023) and NIRSpec spectrum (Bunker et al. 2023). This result does not support the idea that GN-z11 has a standard type 1 AGN in its nucleus that dominates the nebular emission that is traced by the Hα line. Further arguments supporting this conclusion come from the predicted AGN bolometric luminosity and accretion rate derived from the continuum and line flux measurements.
4.1.3. AGN bolometric luminosities and BH Eddington ratios
Assuming the observed UV-optical continuum and optical emission lines are produced by the radiation of an AGN, we derived its bolometric luminosity by applying different bolometric correction factors to the continuum luminosities (Netzer 2019) and the Hβ and [O III] 5008 Å lines (Pennell et al. 2017; Netzer 2019). Taking NIRCam F150W and F356W (Tacchella et al. 2023) observed fluxes and the 5.9 μm flux extrapolated from the best SED model (Tacchella et al. 2023; Bunker et al. 2023) as proxies of the rest-frame luminosity at 1400 Å, 3000 Å, and 5100 Å, respectively, we obtained a bolometric luminosity of ∼1.3 × 1045 erg s−1, which agrees with a previous estimate (Maiolino et al. 2024c). However, the AGN bolometric luminosity derived from the Hβ (given as Hα/2.80) and [O III] 5008 Å luminosities corresponds to 22–33 × 1045 erg s−1, which is higher by factors 17–25 than expected from the continuum emission. This already indicates that even if a 6 × 10⁵ M⊙ mass AGN is present in GN-z11, it cannot dominate the nebular emission as measured by the optical emission lines. On the contrary, it appears to play a minor role in the ionization of the surrounding interstellar medium. Moreover, the predicted Eddington ratio for accretion derived from the emission line luminosities also supports this conclusion. Following Bosman et al. (2024),
 (1)
(1)
the derived Eddington ratio has an extremely high (unrealistic) value of ∼290–440 for a BH mass of 6 × 10⁵ M⊙. These accretion ratios are higher by factors 30–60 than those derived from the continuum windows, ∼7.5–9 above Eddington (see also Maiolino et al. 2024c) when we assume that the UV-optical continuum is entirely produced by an AGN radiation. Recent cosmological simulations of the formation of galaxies and massive black holes do not support the existence of black holes that radiate at super-Eddington ratios at high redshifts (Bhatt et al. 2024). These simulations predict an extremely low probability (< 0.2 %) of a black hole at z = 10–11 with a mass of 106 M⊙ that emits at rates of about five times Eddington. We note, however, that these simulations do not exclude a massive black hole that might be a minor contributor to the luminosity of GN-z11.
4.1.4. Gas metallicity and AGN radiation
AGN models with a low optical to X-ray power-law index (α = −1.5) reproduce the observed high-ionization [Ne IV] 2422,2424/[Ne III] 3870 and He II1640/Hδ line ratios (Isobe et al. 2023b). An estimate of the metallicity of the ionized gas based on these AGN models, on the value for the ionization parameter (U) derived from the ultraviolet N IV] 1483,1486/N III] 1750 ratio, and on the [O III] 4363 Å/[O II] for the metallicity predicts oxygen abundances that are close to and above solar, that is, 12 + log(O/H) = 8.58–9.23 (Isobe et al. 2023b). This value is clearly inconsistent with our metallicity measurements (7.91–7.93; Sect. 3.4) from the [O III] and using the Te and Te-AGN direct methods. The metallicity derivation based on some AGN radiation models and UV lines therefore does not support the presence of an AGN.
4.1.5. Stratification and kinematics of the line-emitting regions
Under the hypothesis of an AGN, a scenario invoking two different ionized regions has been proposed to explain the observed continuum at rest-frame wavelengths 3000–4000 Å (Ji et al. 2024a): A hot and dense ionized gas in the BLR would dominate the Balmer emission, and a colder and less dense gas in the narrow-line region (NLR) or host galaxy would emit the forbidden lines and also contribute (but be subdominant) to the Balmer emission. The differences in the width (FWHM) of the UV lines, with the semiforbidden (N IV] 1486 Å; 470 ± 50 km s−1) and permitted (Mg II 2800 Å; 430 ± 65 km s−1) lines broader (430–470 km s−1) relative to the forbidden lines ([O II] 3727,3729 Å; 368 ± 50 km s−1, [Ne III] 3870 Å; 340 ± 30 km s−1, and [Ne IV] 2422,2424 Å; 380 ± 100 km s−1) could support this scenario and has been suggested as evidence for a narrow-line Seyfert 1 (NLS1) type AGN in GN-z11 (Maiolino et al. 2024c). However, our [O III] 5008 Å and Hα spectroscopy supports neither the NLS1 nature of GN-z11 nor the presence of two ionized regions, with different kinematics. As already mentioned (see Sect. 3.5), the [O III] 5008 Å line width FWHM (189 ± 25 km s−1) is narrower by a factor of about 2 than the previous NIRSpec values derived for the forbidden lines. This discrepancy is understood as caused by the lower spectral resolution and detection level of the forbidden lines identified in the NIRSpec spectrum. In particular, the spectral resolution of the MRS corresponds to an FWHM of 86 ± 9 km s−1, which is higher by a factor of 2–3 than the NIRSpec spectrum (FWHM estimated between 143 and 273 km s−1Maiolino et al. 2024c). In addition, the width of the Hα line is consistent with that of the [O III] 5008 Å line, which supports the conclusion that the kinematics of the ionized gas that is traced by the two lines is not associated with the velocities expected in broad-line AGNs.
The density stratification of the ionized medium in compact high-z galaxies could be common and may not necessarily be associated with the presence of an AGN. Regions of high density (6.4–31 × 104 cm−3) have been identified in the lensed starburst galaxy RXCJ2248-ID at a redshift of 6.1 from the UV lines (Topping et al. 2024), and densities of about 4 × 102 cm−3 are derived from the optical and infrared [O III] line ratios (Crespo-Gómez et al., in prep.). Moreover, NIRCam rest-frame UV images of RXCJ2248-ID show two compact clumps of less than 22 pc (effective radius) and separated by 220 pc, while the broad-line components are detected in the [O III] 5008 Å and Hα lines from NIRSpec slit spectroscopy (Topping et al. 2024). Further NIRSpec integral field spectroscopy revealed that the optical line emission, including the broad component, is dominated by one of the clumps (Crespo-Gómez et al., in prep.). In summary, the scenario of a (0.6–1.4 × 10⁶ M⊙) type 1 accreting BH located at the center of GN-z11 that acts as the dominant energy source to ionize the surrounding interstellar medium is not supported by the kinematics, luminosity, and metallicity measurements derived from our new high spectral resolution Hα and [O III] 5008 Å spectroscopy.
4.2. GN-z11 as an extreme low-metallicity feedback-free starburst
In the starburst scenario, the MRS [O III] 5008 Å and Hα luminosities in GN-z11 are compatible with a low-metallicity (0.17 ± 0.03 Z⊙) starburst that formed stars at a rate of 24 ± 3 M⊙ yr−1 over the past few million years. The dynamical mass (1.1 ± 0.4 × 10⁹ M⊙) derived from the [O III] 5008 Å line supports the conclusion that the mass is dominated by the stellar component. Combined with the very compact size of the galaxy (Re = 64 ± 20 pc; Tacchella et al. 2023), these results characterize GN-z11 as a system with extremely high SFR and stellar mass surface densities, ΣSFR = 9.33 × 10² M⊙ yr−1 kpc−2 and Σ* = 3.6 × 10⁴ M⊙ pc−2, respectively (see Table 2). The GN-z11 compactness, mass, and surface densities are within the range of those measured in other extreme galaxies that were recently detected with JWST at redshifts above 8 (see Figure 6): GN-z8-LAE (z = 8.3; Navarro-Carrera et al. 2024), CEERS-1019 (z = 8.7; Marques-Chaves et al. 2024a), MACS1149-JD1 (z = 9.1; Bradač et al. 2024; Stiavelli et al. 2023; Álvarez-Márquez et al. 2024), GN-z9p4 (z = 9.4; Schaerer et al. 2024), RXJ2129 (z = 9.5; Williams et al. 2023), MACS0647-JD (z = 10.2; Hsiao et al. 2023, 2024b), GHz2 (z = 12.3; Zavala et al. 2024; Calabro et al. 2024; Castellano et al. 2024), and GS-z14-0 (z = 14.3; Helton et al. 2024). All these galaxies are far more compact (×3–10) than the average high-z galaxy of the same stellar mass according to the mass−size relation derived for galaxies at redshifts 4–10 (see Figure 6, Langeroodi & Hjorth 2023).
Physical parameters characterizing the starburst in GN-z11 and high-z galaxies in the early Universe.
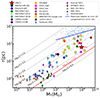 |
Fig. 6. Mass-radius relation for GN-z11 including young star clusters in the nearby starbursts (NGC253, Leroy et al. 2018; M82, McCrady et al. 2003; McCrady & Graham 2007), low-z blue compact (ESO338-IG04, Östlin et al. 2007) and low-metallicity (SBS0335-052E, Adamo et al. 2010) galaxies. We also plot the values for high-z clusters (Sunburst, Vanzella et al. 2022; Sunrise, Vanzella et al. 2023b; SPT0615-JD1, Adamo et al. 2024), clumps (SMACS0723, Claeyssens et al. 2023), extremely UV-bright SFG (J1316+2614, Marques-Chaves et al. 2024b), and luminous galaxies at redshifts above 8 (GN-z8-LAE, Navarro-Carrera et al. 2024; CEERS-1019, Marques-Chaves et al. 2024a; MACS1149-JD1, Bradač et al. 2024; GN-z9p4, (Curti et al. 2024a; Schaerer et al. 2024); RXJ2129-z95, Williams et al. 2023; MACS0647-JD, Hsiao et al. 2023; GHz2, Calabro et al. 2024; GS-z14-0, Helton et al. 2024). The mass−size relation derived for z = 4–10 galaxies identified with the JWST (Langeroodi & Hjorth 2023) is shown (blue line) as reference. The dotted lines represent the constant stellar mass surface density in units of M⊙ pc−2. The line of log10Σ = 5.5 (in red) indicates the observed maximum value in clusters and the nucleus of galaxies, which was also predicted in dense systems under ineffective feedback-regulated conditions (Grudić et al. 2019). The stellar mass of GN-z11 is the average of the values presented in Bunker et al. (2023) and Tacchella et al. (2023). |
The stellar surface density of GN-z11 and of these galaxies when the Universe was younger than 600 Myr (see Figure 6) is in the range measured in compact clusters detected in strongly lensed high-z galaxies such as the Sunburst (z = 2.37, Vanzella et al. 2022) and Sunrise (z ∼ 6,Vanzella et al. 2023a), clumps in high-z (z ∼ 6.4–8.5) lensed galaxies behind SMACS0723 (Claeyssens et al. 2023), and the Cosmic Gems arc (SPT0615-JD1 at z ∼ 10.2, Adamo et al. 2024), and they are lower by only a factor of ∼10–100 than the maximum density observed in compact stellar clusters and nuclei of galaxies (Σ* = 3 × 10⁵ M⊙ pc−2Hopkins et al. 2010; Grudić et al. 2019; Crocker et al. 2018). Young massive clusters with Σ* = 104–105 M⊙ pc−2 have also been identified in the nearby starburst galaxies M82 (McCrady et al. 2003, McCrady & Graham 2007) and NGC 253 (Leroy et al. 2018), as well as in the blue compact dwarf galaxy ESO338-IG04 (Östlin et al. 2007).
Thus, since the effective radius of GN-z11 and high-z galaxies may represent an upper limit to their size, their already high surface densities could trace a young massive cluster, or, more likely, the assembly of many young stellar clusters, as predicted in radiation-hydrodynamic simulations (Garcia et al. 2023). The unusually supersolar N/O derived for GN-z11 and the similarities with the abundance patterns of globular clusters have indeed led several authors to suggest a link between GN-z11 and a few other high-z strong N-emitters with the formation of globular clusters in the early Universe (Senchyna et al. 2024, Charbonnel et al. 2023, Isobe et al. 2023b, Marques-Chaves et al. 2024a, Schaerer et al. 2024). Its compactness (in terms of Σ*) further supports this scenario. These assemblies of massive clusters have already been identified in low-z star-forming galaxies as well as at high-z. Star-forming clumps with a median effective radius of 58 pc were measured in the Lyα Reference Sample (LARS) of galaxies (Messa et al. 2019). These clumps are stellar cluster complexes containing multiple individual clusters, each with a radius of 1–10 pc. This also appears to be the case in the SPT0615-JD1 galaxy at z = 10.2, where five clusters, each with an effective radius of 1 pc, ages younger than 35 Myr, and an intrinsic stellar mass of 0.6–3 × 10⁶ M⊙, have been identified within 70 pc (Adamo et al. 2024).
In addition, the star formation surface density in GN-z11 and in other luminous galaxies at redshift above 8.5 (see Table 2) is unusually high, and some galaxies lie just below the maximum Eddington rate expected in radiation-supported starbursts (ΣSFR = 1 × 10³ M⊙ kpc−2,Thompson et al. 2005, Andrews & Thompson 2011), and it is well above those of high-z galaxies identified by the JWST at redshifts above 5 (1 < ΣSFR < 300 M⊙ kpc−2, Morishita et al. 2024). The ΣSFR are only similar to and even higher than those measured in the nuclear regions of low-z luminous infrared galaxies (Sánchez-García et al. 2022) and in high-z massive dusty star-forming galaxies (e.g., Hodge et al. 2015, Oteo et al. 2016).
The question is how systems such as GN-z11 might have been generated at this early epoch in the Universe. According to recent analytic models, massive low-metallicity galaxies at redshifts of 10 and above are expected to have densities of a few ×103 cm−3 and mass surface densities of ∼3 × 10³ M⊙ pc−2. For these high densities, the free-fall time is very short, shorter than 1 Myr, and the gas accreted from the halos of these galaxies is converted into stars with a high efficiency of close to one and with high rates of ∼65 M⊙ yr−1, that is, these galaxies would be in a free-fall starburst phase (Dekel et al. 2023; Li et al. 2023). Moreover, as a result of the extreme mass concentration, the stellar winds and supernova explosions would not be able to overcome the binding gravitational energy, outflows are expected to be weak and to be unable to halt the star formation process, which means that galaxies would be in a feedback-free burst (FFB) phase. The values of the compactness index (C5 = (M*/105 M⊙)/Rhm [pc]) with a half-mass radius Rhm = 1.7 × Re (Krause et al. 2016) that were measured in GN-z11 and other high-z galaxies (see Table 2) are well above the limits (C5 ∼ 1–10) and the combined effect of stellar winds and supernovae would not be able to expel the gas efficiently. When only energetic hypernovae were invoked, the expulsion of gas could take place for a compactness index above 30, which is in the range of values measured in these high-z galaxies. The presence of bright hypernovae and/or pair-instability supernovae was invoked to explain the O/Fe abundance in GN-z11 (Nakane et al. 2024). In the free-fall feedback-free starburst scenario, galaxies at dawn are expected to be compact (Re ∼ 0.3 kpc), bursty on timescales of 10 Myr, and to consist of thousands of star clusters, each with masses of 106 M⊙, that at the end of this phase span about 100 Myr (Li et al. 2023). In addition, these early starbursts would have a low gas mass fraction (< 5%) and a low metallicity (0.1 Z⊙).
The properties measured in GN-z11 are consistent with those expected in the free-fall feedback-free starburst scenario. The metallicity measured in GN-z11 is 0.17 ± 0.03 Z⊙, and the stellar mass is within the uncertainties the main (even dominant) component of the dynamical mass (see Sect. 3.5). The recent star formation rate traced by the Hα line corresponds to 24 ± 3 M⊙ yr−1 (see Sect. 3.1) in a small region with an effective radius of 64 ± 20 pc (Tacchella et al. 2023). The predicted electron density of the ionized medium is about 103 cm−3, as derived from the variation in the electron density with redshift, and it is consistent with the density measured in the galaxy MACS0647-JD1 at redshift 10.2 (see Section 3.4). Following Dekel et al. (2023), a free-fall time of 1.6 Myr was obtained for GN-z11 assuming an average gas density of 103 cm−3. A similar value, ∼1.9 Myr, was derived for a total gas mass equal to that of the ionized gas, that is, 2 × 10⁷ M⊙ (see Sect. 3.5), that is is enclosed in the effective radius of 64 pc. This free-fall time is even shorter (∼0.4 Myr) for a mass equal to the total stellar mass. Finally, a compactness index of 85 was derived for GN-z11. This C5 value requires a very high SF efficiency (∼0.7, Marques-Chaves et al. 2024b) for gas expulsion even when the presence of hypernovae is invoked.
The negligible nebular dust attenuation measured with the available hydrogen Balmer lines (see Sect. 3.1) is also compatible with the low dust attenuation predicted in the FFB scenario. Since dust is mostly produced by supernovae, no significant dust is expected during the short FFB phase. During the post FFB phase, the supernova outflows would remove the dust and residual gas and would generate a compact blue luminous galaxy (Dekel et al. 2023; Li et al. 2023). Moreover, according to this scenario, dust attenuation would diminish with redshift, favoring the detection of UV luminous galaxies early in the Universe, at redshifts 10 and above (Li et al. 2023). The predictions of the low dust attenuation are not unique in FFBs. Alternative scenarios invoke the existence of radiative-driven dusty outflows in a super-Eddington luminous starburst that would clear the galaxy from dust (Ferrara et al. 2023; Fiore et al. 2023; Ziparo et al. 2023). According to this scenario, the radiation pressure efficiency increases by large factors (100–1000) in dusty environments, and therefore, the effective Eddington luminosity is reduced by similar factors (Fiore et al. 2023). Thus, for a given starburst, the condition of a super-Eddington dusty outflow translates into a minimum specific star formation rate (sSFR = SFR/M*) of 13 Gyr−1; Fiore et al. 2023). GN-z11 with an sSFR of 25 Gyr−1 (see Table 1) would be experiencing a radiation-driven dusty outflow that clears the galaxy from dust. Very deep NOEMA observations have been unable to detect either [C II]158 μm or continuum dust emission at rest-frame 160 μm (Fudamoto et al. 2024), suggesting that GN-z11 is a dust-poor system. However, the derived upper limits for the continuum emission are still above the predicted fluxes in the dusty outflow scenario. Thus, the origin of the low dust attenuation in GN-z11 derived from the SED and hydrogen Balmer lines is still unclear. Deeper NOEMA continuum observations are needed to constrain the temperature and amount of dust.
The MRS spectroscopy shows a flux excess in the red part of the [O III] 5008 Å emission line profile, suggesting the presence of a faint secondary red component at velocities 100–300 km s−1 that is detected at a low significance (< 2σ). SNe produced in earlier generations of clusters in the compact starburst regions during the 100 Myr long phase, that is, clusters in a post-feedback-free phase, would generate winds with extremely high velocities of 700 km s−1 to 3300 km s−1 for star formation efficiencies of 0.2–1 (Li et al. 2023). These winds could be traced by broad emission lines with an FWHM of 1400 km s−1 to 6600 km s−1. These predicted broad lines cannot be detected with the current set of data, and deeper spectroscopy with the JWST is required. The prediction of this scenario applies to all (collisional and recombination) optical emission lines, that is, [O III] 5008 and Hα, and it would therefore be able to distinguish high-velocity winds or outflows in the dense (∼103 cm−3) interstellar medium of the galaxy at the sensitivity of our MRS spectrum from the emission of an extremely dense (> 109 cm−3) broad-line region around a low-mass black hole that is only present in the Hα recombination line.
In summary, GN-z11 shows characteristics that are not unique and are shared with other galaxies that were identified by the JWST in the early Universe at cosmic dawn, that is, at redshifts ∼8.5 and above. The surface density of the stellar mass and star formation in these galaxies is very extreme and close to that observed in young massive stellar clusters. Under the starburst hypothesis, we speculated about a potential formation scenario, the feedback-free phase, which involves a highly efficient star formation, even close to one, in a low-metallicity very dense environment. While the properties measured in GN-z11 are consistent with the predictions of the feedback-free scenario, a confirmation of the predicted high-velocity winds in the [O III] and Hα lines if the starburst includes previous generations of clusters in a post-feedback-free phase requires deeper spectroscopy with JWST.
5. Summary and conclusions
We reported new MIRI medium-resolution spectroscopic observations of the high-z galaxy GN-z11 that cover the rest-frame optical spectrum. We detected the [O III] 5008 Å and Hα emission lines with signal-to-noise ratios of 10 and 8, respectively. The combination of the MRS [O III] 5008 Å and Hα lines and the previously reported UV and optical lines from NIRSpec observations (Bunker et al. 2023) allowed us to study the ISM physical properties and the ionization nature of GN-z11. The main results are summarized below.
-
The [O III] 5008 Å and Hα emission lines are resolved and well modeled by a one-Gaussian component with FWHMs of 189 ± 25 and 231 ± 52 km s−1, respectively. Their FWHMs are narrower by about a factor of two than the FWHMs of the semiforbidden (FWHM = 470 ± 50 km s−1, N IV] 1487 Å) and permitted ultraviolet lines (FWHM = 430 ± 65 km s−1, Mg II 2800 Å) that were reported previously using medium-resolution (R ∼ 1000) NIRSpec spectroscopy. There is therefore no evidence of a dominant broad Hα component associated with the broad-line regions (BLR) of a type 1 AGN. However, a broad (∼430–470 km s−1) and weak (< 2−3 × 10⁻¹⁸ erg s−1 cm−2) Hα line, if present, would be at the 2σ detection level in our current MRS observations. Therefore, a minor broad Hα component associated with the BLR of an AGN cannot be ruled out in this work, and deeper MRS spectroscopy is required to confirm it conclusively.
-
The ISM is characterized by a negligible or zero dust attenuation, an electron temperature of 14 000 ± 2100 K, an ionization parameter (U) in the −1.81 to −2.06 range, and a direct-Te gas-phase metallicity of 12 + log(O/H) = 7.91 ± 0.07 (0.17 ± 0.03 Z⊙). GN-z11 is located in the SFG/AGN region in the R3−R2, O32−R23, O3Hγ−O32 and O3Hγ−O33 diagrams, although it is more compatible with local low-metallicity and high-z SFGs. A total ionized gas mass of ∼2 × 10⁷ M⊙ was inferred from the Hα luminosity. Its Strömgren sphere was estimated to have a radius of 64 pc for an average electron density of 103 cm−3, similar to the compact size of the UV continuum source (Tacchella et al. 2023).
-
A dynamical mass of (1.1 ± 0.4) × 109 M⊙ was derived assuming GN-z11 is virialized. This value is consistent within the uncertainties with previous stellar mass estimates (Bunker et al. 2023; Tacchella et al. 2023), suggesting that the dynamical mass in GN-z11 is dominated by the stellar component. The stellar mass and direct-Te gas-phase metallicity place GN-z11 on the best-fit mass-metallicity relation for galaxies at z ∼ 8.
-
Assuming a young starburst is the ionizing source in GN-z11, we derived an SFR of 24 ± 3 M⊙ yr−1 from the Hα luminosity and considered a metallicity of 0.1 Z⊙. The Hα SFR agrees within the uncertainties with the UV SFR and with previous values that were derived from multiwavelength SED fitting (Tacchella et al. 2023) and other Balmer lines (Bunker et al. 2023). The photon-production efficiency and the Lyα escape fraction of GN-z11 are log(ζion) = 25.66 ± 0.06 Hz erg−1 and fesc, LyC = 0.04 ± 0.01, respectively. These values agree very well with previous derivations (Bunker et al. 2023) and are within the range measured in most of the EoR galaxies observed to date.
-
No accreting black hole that dominates the optical continuum and emission lines of GN-z11, and following the relations that were clearly established for low-z AGNs, is supported by the MRS Hα and [O III] 5008 Å luminosities and line profiles. If the Hα line is entirely produced in a high-density BLR and the standard Hα−BH mass relation of low-z type 1 AGNs applies, we estimated the black hole mass to be 6
 × 105 M⊙, which is lower by a factor of two than the mass inferred based on the UV emission lines of log(MBH[M⊙]) = 6.2±0.3 (Maiolino et al. 2024c). If the UV-optical continuum and optical emission lines were produced by an accreting BH, the AGN bolometric luminosities derived from the [O III] 5008 Å and Hα lines would be higher by factors of 17–25 than those derived from the UV and optical continuum. Moreover, the Eddington ratio for accretion (λE) derived from the [O III] 5008 Å and Hα luminosities would have extremely high (unrealistic) values, 290–440. In addition, the presence of an AGN radiation dominating the Hα emission is not supported by the measured L(Hα)/LX(2–10 keV) and L(Hα)/L(5100 Å) ratios, which deviates from the well-established relations in low-z AGNs.
 -
The stellar mass and size place GN-z11 well below the mass-size relation derived for galaxies at redshifts 4–10 (Langeroodi & Hjorth 2023). The corresponding stellar mass surface density of 3.6 × 10⁴ M⊙ pc−2 is close to that of the densest stellar clusters and young clusters detected in intermediate- and high-z galaxies. This high stellar surface density, together with the extreme SFR surface density (933 M⊙ kpc−2) and low gas-phase metallicity (0.17 ± 0.03 Z⊙), suggest the presence of multiple young low-metallicity stellar clusters as the main ionization source.
-
The high SFR and stellar mass surface densities (ΣSFR and Σ*) in GN-z11, together with its small size (Re), compactness (C5), and low metallicity, are consistent with the scenario of a free-fall feedback-free starburst at cosmic dawn (Dekel et al. 2023).
The nature of GN-z11 and its dominant energy source were investigated with the new [O III] 5008 Å and Hα measurements. The properties of GN-z11, its compactness, low metallicity, and high stellar mass surface brightness are shared by other luminous galaxies at cosmic dawn, that is, at redshifts above 8.5. We propose that these galaxies might be transitioning through a highly efficient star formation phase, in which they convert the available low-metallicity gas into stars during short periods of time in a free-fall feedback-free process, as recently suggested by Dekel et al. (2023) and Li et al. (2023). Since the feedback-free phase is bursty, this scenario predicts very broad (> 1000 km s−1) weak secondary components in the [O III] 5008 Å and Hα lines that are caused by supernovae feedback from previous generations of clusters within the compact starburst region. The MRS spectroscopy shows a flux excess in the red part of the [O III] 5008 Å emission line profile, suggesting the presence of a possible secondary line component that is detected at a low significance (< 2σ). Deeper rest-frame optical spectroscopy and imaging of GN-z11 with JWST are needed to further elucidate whether the predicted broad components are present in the forbidden and recombination lines, and if there are older stellar populations from previous bursts.
Additional information on the absolute flux calibrations in the JWST instruments: https://jwst-docs.stsci.edu/jwst-calibration-status
If the electron density were as high as the lower limit derived from the UV lines (105 cm−3), the direct-Te metallicity would move from 0.17 to 0.54 Z⊙.
Acknowledgments
The authors thank to the anonymous referee for useful comments. J.A-M., L.Colina, A.C.G., C.P.-J., L.Costantin acknowledge support by grants PIB2021-127718NB-100, A.A-H. by grant PID2021-124665NB-I00, and P.G.P-G and L.Costantin by grant PID2022-139567NBI00 from the Spanish Ministry of Science and Innovation/State Agency of Research MCIN/AEI/10.13039/501100011033 and by “ERDF A way of making Europe”. A.C.G. acknowledges support by JWST contract B0215/JWST-GO-02926. J.M., A.B., and G.O. acknowledges support from the Swedish National Space Administration (SNSA). K.I.C., P.R., and E.I acknowledge funding from the Netherlands Research, the Netherlands Research School for Astronomy (NOVA), and the Dutch Research Council (NWO) through the award of the Vici Grant VI.C.212.036. LB and F.W. acknowledge support from the ERC Advanced Grant 740246 (Cosmic_Gas). R.A.M. acknowledges support from the Swiss National Science Foundation (SNSF) through project grant 200020_207349. This work was supported by research grants (VIL16599, VIL54489) from VILLUM FONDEN. The project that gave rise to these results received the support of a fellowship from the “la Caixa” Foundation (ID 100010434). The fellowship code is LCF/BQ/PR24/12050015. This work is based on observations made with the NASA/ESA/CSA James Webb Space Telescope. The data were obtained from the Mikulski Archive for Space Telescopes at the Space Telescope Science Institute, which is operated by the Association of Universities for Research in Astronomy, Inc., under NASA contract NAS 5-03127 for JWST; and from the European JWST archive (eJWST) operated by the ESDC. This research made use of Photutils, an Astropy package for detection and photometry of astronomical sources (Bradley et al. 2022).
References
- Abdurro’uf, Larson, R. L., Coe, D., et al. 2024, ApJ, 973, 47 [Google Scholar]
- Acharyya, A., Kewley, L. J., Rigby, J. R., et al. 2019, MNRAS, 488, 5862 [NASA ADS] [CrossRef] [Google Scholar]
- Adamo, A., Zackrisson, E., Östlin, G., & Hayes, M. 2010, ApJ, 725, 1620 [NASA ADS] [CrossRef] [Google Scholar]
- Adamo, A., Bradley, L. D., Vanzella, E., et al. 2024, Nature, 632, 513 [NASA ADS] [CrossRef] [Google Scholar]
- Álvarez-Márquez, J., Colina, L., Marques-Chaves, R., et al. 2019, A&A, 629, A9 [NASA ADS] [CrossRef] [EDP Sciences] [Google Scholar]
- Álvarez-Márquez, J., Crespo Gómez, A., Colina, L., et al. 2023, A&A, 671, A105 [NASA ADS] [CrossRef] [EDP Sciences] [Google Scholar]
- Álvarez-Márquez, J., Colina, L., Crespo Gómez, A., et al. 2024, A&A, 686, A85 [NASA ADS] [CrossRef] [EDP Sciences] [Google Scholar]
- Ananna, T. T., Bogdán, Á., Kovács, O. E., Natarajan, P., & Hickox, R. C. 2024, ApJ, 969, L18 [NASA ADS] [CrossRef] [Google Scholar]
- Andrews, B. H., & Thompson, T. A. 2011, ApJ, 727, 97 [NASA ADS] [CrossRef] [Google Scholar]
- Argyriou, I., Glasse, A., Law, D. R., et al. 2023, A&A, 675, A111 [NASA ADS] [CrossRef] [EDP Sciences] [Google Scholar]
- Arrabal Haro, P., Dickinson, M., Finkelstein, S. L., et al. 2023, ApJ, 951, L22 [NASA ADS] [CrossRef] [Google Scholar]
- Asplund, M., Grevesse, N., Sauval, A. J., & Scott, P. 2009, ARA&A, 47, 481 [NASA ADS] [CrossRef] [Google Scholar]
- Atek, H., Furtak, L. J., Oesch, P., et al. 2022, MNRAS, 511, 4464 [CrossRef] [Google Scholar]
- Atek, H., Labbé, I., Furtak, L. J., et al. 2024, Nature, 626, 975 [NASA ADS] [CrossRef] [Google Scholar]
- Baldwin, J. A., Phillips, M. M., & Terlevich, R. 1981, PASP, 93, 5 [Google Scholar]
- Berg, D. A., Erb, D. K., Auger, M. W., Pettini, M., & Brammer, G. B. 2018, ApJ, 859, 164 [CrossRef] [Google Scholar]
- Berg, D. A., Erb, D. K., Henry, R. B. C., Skillman, E. D., & McQuinn, K. B. W. 2019, ApJ, 874, 93 [NASA ADS] [CrossRef] [Google Scholar]
- Berg, D. A., Chisholm, J., Erb, D. K., et al. 2021, ApJ, 922, 170 [CrossRef] [Google Scholar]
- Bhatt, M., Gallerani, S., Ferrara, A., et al. 2024, A&A, 686, A141 [NASA ADS] [CrossRef] [EDP Sciences] [Google Scholar]
- Bian, F., Kewley, L. J., & Dopita, M. A. 2018, ApJ, 859, 175 [CrossRef] [Google Scholar]
- Bosman, S. E. I., Álvarez-Márquez, J., Colina, L., et al. 2024, Nat. Astron., 8, 1054 [NASA ADS] [CrossRef] [Google Scholar]
- Boyett, K., Bunker, A. J., Curtis-Lake, E., et al. 2024, MNRAS, 535, 1796 [NASA ADS] [CrossRef] [Google Scholar]
- Bradač, M., Strait, V., Mowla, L., et al. 2024, ApJ, 961, L21 [CrossRef] [Google Scholar]
- Bradley, L., Sipőcz, B., Robitaille, T., et al. 2022, https://doi.org/10.5281/zenodo.6825092 [Google Scholar]
- Bunker, A. J., Saxena, A., Cameron, A. J., et al. 2023, A&A, 677, A88 [NASA ADS] [CrossRef] [EDP Sciences] [Google Scholar]
- Bushouse, H., Eisenhamer, J., Dencheva, N., et al. 2024, https://doi.org/10.5281/zenodo.10870758 [Google Scholar]
- Calabro, A., Castellano, M., Zavala, J. A., et al. 2024, ArXiv e-prints [arXiv:2403.12683] [Google Scholar]
- Calzetti, D. 2013, in Secular Evolution of Galaxies, eds. J. Falcón-Barroso, & J. H. Knapen, 419 [Google Scholar]
- Cameron, A. J., Saxena, A., Bunker, A. J., et al. 2023a, A&A, 677, A115 [NASA ADS] [CrossRef] [EDP Sciences] [Google Scholar]
- Cameron, A. J., Katz, H., Rey, M. P., & Saxena, A. 2023b, MNRAS, 523, 3516 [NASA ADS] [CrossRef] [Google Scholar]
- Campbell, A., Terlevich, R., & Melnick, J. 1986, MNRAS, 223, 811 [NASA ADS] [CrossRef] [Google Scholar]
- Carniani, S., Hainline, K., D’Eugenio, F., et al. 2024, ArXiv e-prints [arXiv:2405.18485] [Google Scholar]
- Carniani, S., D’Eugenio, F., Ji, X., et al. 2025, A&A, in press, https://doi.org/10.1051/0004-6361/202452451 [Google Scholar]
- Castellano, M., Belfiori, D., Pentericci, L., et al. 2023, A&A, 675, A121 [NASA ADS] [CrossRef] [EDP Sciences] [Google Scholar]
- Castellano, M., Napolitano, L., Fontana, A., et al. 2024, ApJ, 972, 143 [Google Scholar]
- Chabrier, G. 2003, PASP, 115, 763 [Google Scholar]
- Charbonnel, C., Schaerer, D., Prantzos, N., et al. 2023, A&A, 673, L7 [NASA ADS] [CrossRef] [EDP Sciences] [Google Scholar]
- Chisholm, J., Saldana-Lopez, A., Flury, S., et al. 2022, MNRAS, 517, 5104 [CrossRef] [Google Scholar]
- Claeyssens, A., Adamo, A., Richard, J., et al. 2023, MNRAS, 520, 2180 [NASA ADS] [CrossRef] [Google Scholar]
- Crocker, R. M., Krumholz, M. R., Thompson, T. A., Baumgardt, H., & Mackey, D. 2018, MNRAS, 481, 4895 [NASA ADS] [CrossRef] [Google Scholar]
- Curti, M., D’Eugenio, F., Carniani, S., et al. 2023, MNRAS, 518, 425 [Google Scholar]
- Curti, M., Witstok, J., Jakobsen, P., et al. 2024a, A&A, submitted [arXiv:2407.02575] [Google Scholar]
- Curti, M., Maiolino, R., Curtis-Lake, E., et al. 2024b, A&A, 684, A75 [NASA ADS] [CrossRef] [EDP Sciences] [Google Scholar]
- Curtis-Lake, E., Carniani, S., Cameron, A., et al. 2023, Nat. Astron., 7, 622 [NASA ADS] [CrossRef] [Google Scholar]
- D’Antona, F., Vesperini, E., Calura, F., et al. 2023, A&A, 680, L19 [NASA ADS] [CrossRef] [EDP Sciences] [Google Scholar]
- Dekel, A., Sarkar, K. C., Birnboim, Y., Mandelker, N., & Li, Z. 2023, MNRAS, 523, 3201 [NASA ADS] [CrossRef] [Google Scholar]
- Díaz, A. I., Castellanos, M., Terlevich, E., & Luisa García-Vargas, M. 2000, MNRAS, 318, 462 [CrossRef] [Google Scholar]
- Dopita, M. A., & Sutherland, R. S. 2003, Astrophysics of the Diffuse Universe (Berlin, New York: Springer) [Google Scholar]
- Dors, O. L. 2021, MNRAS, 507, 466 [NASA ADS] [CrossRef] [Google Scholar]
- Dors, O. L., Maiolino, R., Cardaci, M. V., et al. 2020a, MNRAS, 496, 3209 [NASA ADS] [CrossRef] [Google Scholar]
- Dors, O. L., Freitas-Lemes, P., Amôres, E. B., et al. 2020b, MNRAS, 492, 468 [NASA ADS] [CrossRef] [Google Scholar]
- Ferrara, A., Pallottini, A., & Dayal, P. 2023, MNRAS, 522, 3986 [NASA ADS] [CrossRef] [Google Scholar]
- Finkelstein, S. L., Bagley, M. B., Ferguson, H. C., et al. 2023, ApJ, 946, L13 [NASA ADS] [CrossRef] [Google Scholar]
- Fiore, F., Ferrara, A., Bischetti, M., Feruglio, C., & Travascio, A. 2023, ApJ, 943, L27 [NASA ADS] [CrossRef] [Google Scholar]
- Fudamoto, Y., Oesch, P. A., Walter, F., et al. 2024, MNRAS, 530, 340 [NASA ADS] [CrossRef] [Google Scholar]
- Fujimoto, S., Arrabal Haro, P., Dickinson, M., et al. 2023, ApJ, 949, L25 [NASA ADS] [CrossRef] [Google Scholar]
- Furtak, L. J., Labbé, I., Zitrin, A., et al. 2024, Nature, 628, 57 [NASA ADS] [CrossRef] [Google Scholar]
- Garcia, F. A. B., Ricotti, M., Sugimura, K., & Park, J. 2023, MNRAS, 522, 2495 [NASA ADS] [CrossRef] [Google Scholar]
- Gardner, J. P., Mather, J. C., Abbott, R., et al. 2023, PASP, 135, 068001 [NASA ADS] [CrossRef] [Google Scholar]
- Giménez-Arteaga, C., Fujimoto, S., Valentino, F., et al. 2024, A&A, 686, A63 [NASA ADS] [CrossRef] [EDP Sciences] [Google Scholar]
- Greene, J. E., & Ho, L. C. 2005a, ApJ, 627, 721 [NASA ADS] [CrossRef] [Google Scholar]
- Greene, J. E., & Ho, L. C. 2005b, ApJ, 630, 122 [NASA ADS] [CrossRef] [Google Scholar]
- Greene, J. E., Labbe, I., Goulding, A. D., et al. 2024, ApJ, 964, 39 [CrossRef] [Google Scholar]
- Grudić, M. Y., Hopkins, P. F., Quataert, E., & Murray, N. 2019, MNRAS, 483, 5548 [CrossRef] [Google Scholar]
- Harikane, Y., Zhang, Y., Nakajima, K., et al. 2023a, ApJ, 959, 39 [NASA ADS] [CrossRef] [Google Scholar]
- Harikane, Y., Ouchi, M., Oguri, M., et al. 2023b, ApJS, 265, 5 [NASA ADS] [CrossRef] [Google Scholar]
- Hayes, M. J., & Scarlata, C. 2023, ApJ, 954, L14 [NASA ADS] [CrossRef] [Google Scholar]
- Heintz, K. E., Brammer, G. B., Giménez-Arteaga, C., et al. 2023, Nat. Astron., 7, 1517 [NASA ADS] [CrossRef] [Google Scholar]
- Helton, J. M., Rieke, G. H., Alberts, S., et al. 2024, ArXiv e-prints [arXiv:2405.18462] [Google Scholar]
- Ho, L. C., Feigelson, E. D., Townsley, L. K., et al. 2001, ApJ, 549, L51 [NASA ADS] [CrossRef] [Google Scholar]
- Hodge, J. A., Riechers, D., Decarli, R., et al. 2015, ApJ, 798, L18 [Google Scholar]
- Hopkins, P. F., Murray, N., Quataert, E., & Thompson, T. A. 2010, MNRAS, 401, L19 [NASA ADS] [Google Scholar]
- Hsiao, T. Y.-Y., Coe, D., Abdurro’uf, et al. 2023, ApJ, 949, L34 [NASA ADS] [CrossRef] [Google Scholar]
- Hsiao, T. Y.-Y., Álvarez-Márquez, J., Coe, D., et al. 2024a, ApJ, 973, 81 [NASA ADS] [CrossRef] [Google Scholar]
- Hsiao, T. Y.-Y., Abdurro’uf, Coe, D., et al. 2024b, ApJ, 973, 8 [NASA ADS] [CrossRef] [Google Scholar]
- Iani, E., Rinaldi, P., Caputi, K. I., et al. 2024, ArXiv e-prints [arXiv:2406.18207] [Google Scholar]
- Isobe, Y., Ouchi, M., Nakajima, K., et al. 2023a, ApJ, 956, 139 [NASA ADS] [CrossRef] [Google Scholar]
- Isobe, Y., Ouchi, M., Tominaga, N., et al. 2023b, ApJ, 959, 100 [NASA ADS] [CrossRef] [Google Scholar]
- Izotov, Y. I., & Thuan, T. X. 2011, ApJ, 734, 82 [NASA ADS] [Google Scholar]
- Izotov, Y. I., Stasińska, G., Meynet, G., Guseva, N. G., & Thuan, T. X. 2006, A&A, 448, 955 [CrossRef] [EDP Sciences] [Google Scholar]
- Izotov, Y. I., Schaerer, D., Thuan, T. X., et al. 2016, MNRAS, 461, 3683 [Google Scholar]
- Izotov, Y. I., Guseva, N. G., Fricke, K. J., & Henkel, C. 2019, A&A, 623, A40 [NASA ADS] [CrossRef] [EDP Sciences] [Google Scholar]
- Izotov, Y. I., Thuan, T. X., & Guseva, N. G. 2024, MNRAS, 527, 3486 [Google Scholar]
- Ji, X., Maiolino, R., Ferland, G., et al. 2024a, ArXiv e-prints [arXiv:2405.05772] [Google Scholar]
- Ji, X., Übler, H., Maiolino, R., et al. 2024b, MNRAS, 535, 881 [NASA ADS] [CrossRef] [Google Scholar]
- Jin, C., Ward, M., & Done, C. 2012, MNRAS, 422, 3268 [Google Scholar]
- Jones, O. C., Álvarez-Márquez, J., Sloan, G. C., et al. 2023, MNRAS, 523, 2519 [Google Scholar]
- Juodžbalis, I., Maiolino, R., Baker, W. M., et al. 2024, Nature, 636, 594 [CrossRef] [Google Scholar]
- Kauffmann, G., Heckman, T. M., Tremonti, C., et al. 2003, MNRAS, 346, 1055 [Google Scholar]
- Kennicutt, R. C., & Evans, N. J. 2012, ARA&A, 50, 531 [NASA ADS] [CrossRef] [Google Scholar]
- Kewley, L. J., Dopita, M. A., Sutherland, R. S., Heisler, C. A., & Trevena, J. 2001, ApJ, 556, 121 [Google Scholar]
- Kobayashi, C., & Ferrara, A. 2024, ApJ, 962, L6 [NASA ADS] [CrossRef] [Google Scholar]
- Kocevski, D. D., Barro, G., McGrath, E. J., et al. 2023, ApJ, 946, L14 [NASA ADS] [CrossRef] [Google Scholar]
- Kokorev, V., Fujimoto, S., Labbe, I., et al. 2023, ApJ, 957, L7 [NASA ADS] [CrossRef] [Google Scholar]
- Kokubo, M., & Harikane, Y. 2024, ArXiv e-prints [arXiv:2407.04777] [Google Scholar]
- Krause, M. G. H., Charbonnel, C., Bastian, N., & Diehl, R. 2016, A&A, 587, A53 [NASA ADS] [CrossRef] [EDP Sciences] [Google Scholar]
- Labiano, A., Argyriou, I., Álvarez-Márquez, J., et al. 2021, A&A, 656, A57 [NASA ADS] [CrossRef] [EDP Sciences] [Google Scholar]
- Langeroodi, D., & Hjorth, J. 2023, ArXiv e-prints [arXiv:2307.06336] [Google Scholar]
- Langeroodi, D., & Hjorth, J. 2024a, ArXiv e-prints [arXiv:2404.13045] [Google Scholar]
- Langeroodi, D., & Hjorth, J. 2024b, ArXiv e-prints [arXiv:2409.07455] [Google Scholar]
- Langeroodi, D., Hjorth, J., Chen, W., et al. 2023, ApJ, 957, 39 [NASA ADS] [CrossRef] [Google Scholar]
- Laseter, I. H., Maseda, M. V., Curti, M., et al. 2024, A&A, 681, A70 [NASA ADS] [CrossRef] [EDP Sciences] [Google Scholar]
- Law, D. D., Morrison, J. E., Argyriou, I., et al. 2023, AJ, 166, 45 [NASA ADS] [CrossRef] [Google Scholar]
- Le, H. A. N., Xue, Y., Lin, X., & Wang, Y. 2023, ApJ, 945, 59 [NASA ADS] [CrossRef] [Google Scholar]
- Leroy, A. K., Bolatto, A. D., Ostriker, E. C., et al. 2018, ApJ, 869, 126 [NASA ADS] [CrossRef] [Google Scholar]
- Li, Z., Dekel, A., Sarkar, K. C., et al. 2023, A&A, 690, A108 [Google Scholar]
- Luridiana, V., Morisset, C., & Shaw, R. A. 2015, A&A, 573, A42 [NASA ADS] [CrossRef] [EDP Sciences] [Google Scholar]
- Ma, X., Hopkins, P. F., Faucher-Giguère, C.-A., et al. 2016, MNRAS, 456, 2140 [NASA ADS] [CrossRef] [Google Scholar]
- Maiolino, R., Scholtz, J., Curtis-Lake, E., et al. 2024a, A&A, 691, A145 [NASA ADS] [CrossRef] [EDP Sciences] [Google Scholar]
- Maiolino, R., Risaliti, G., Signorini, M., et al. 2024b, ArXiv e-prints [arXiv:2405.00504] [Google Scholar]
- Maiolino, R., Scholtz, J., Witstok, J., et al. 2024c, Nature, 627, 59 [NASA ADS] [CrossRef] [Google Scholar]
- Maiolino, R., Übler, H., Perna, M., et al. 2024d, A&A, 687, A67 [NASA ADS] [CrossRef] [EDP Sciences] [Google Scholar]
- Marconcini, C., D’Eugenio, F., Maiolino, R., et al. 2024, MNRAS, 533, 2488 [NASA ADS] [CrossRef] [Google Scholar]
- Marques-Chaves, R., Schaerer, D., Kuruvanthodi, A., et al. 2024a, A&A, 681, A30 [NASA ADS] [CrossRef] [EDP Sciences] [Google Scholar]
- Marques-Chaves, R., Schaerer, D., Vanzella, E., et al. 2024b, A&A, 691, A87 [NASA ADS] [CrossRef] [EDP Sciences] [Google Scholar]
- Marszewski, A., Sun, G., Faucher-Giguère, C.-A., Hayward, C. C., & Feldmann, R. 2024, ApJ, 967, L41 [Google Scholar]
- Mascia, S., Pentericci, L., Calabrò, A., et al. 2023, A&A, 672, A155 [NASA ADS] [CrossRef] [EDP Sciences] [Google Scholar]
- Matsuoka, K., Silverman, J. D., Schramm, M., et al. 2013, ApJ, 771, 64 [Google Scholar]
- Matthee, J., Sobral, D., Best, P., et al. 2017, MNRAS, 465, 3637 [NASA ADS] [CrossRef] [Google Scholar]
- Matthee, J., Mackenzie, R., Simcoe, R. A., et al. 2023, ApJ, 950, 67 [NASA ADS] [CrossRef] [Google Scholar]
- Mazzolari, G., Übler, H., Maiolino, R., et al. 2024, A&A, 691, A345 [NASA ADS] [CrossRef] [EDP Sciences] [Google Scholar]
- McCrady, N., & Graham, J. R. 2007, ApJ, 663, 844 [NASA ADS] [Google Scholar]
- McCrady, N., Gilbert, A. M., & Graham, J. R. 2003, ApJ, 596, 240 [NASA ADS] [CrossRef] [Google Scholar]
- Messa, M., Adamo, A., Östlin, G., et al. 2019, MNRAS, 487, 4238 [NASA ADS] [CrossRef] [Google Scholar]
- Meyer, R. A., Oesch, P. A., Giovinazzo, E., et al. 2024, MNRAS, 535, 1067 [CrossRef] [Google Scholar]
- Mingozzi, M., James, B. L., Arellano-Córdova, K. Z., et al. 2022, ApJ, 939, 110 [NASA ADS] [CrossRef] [Google Scholar]
- Morishita, T., Roberts-Borsani, G., Treu, T., et al. 2023, ApJ, 947, L24 [NASA ADS] [CrossRef] [Google Scholar]
- Morishita, T., Stiavelli, M., Grillo, C., et al. 2024, ApJ, 971, 43 [NASA ADS] [CrossRef] [Google Scholar]
- Nakajima, K., Ouchi, M., Xu, Y., et al. 2022, ApJS, 262, 3 [CrossRef] [Google Scholar]
- Nakajima, K., Ouchi, M., Isobe, Y., et al. 2023, ApJS, 269, 33 [NASA ADS] [CrossRef] [Google Scholar]
- Nakane, M., Ouchi, M., Nakajima, K., et al. 2024, ApJ, 976, 122 [Google Scholar]
- Navarro-Carrera, R., Caputi, K. I., Iani, E., et al. 2024, ArXiv e-prints [arXiv:2407.14201] [Google Scholar]
- Netzer, H. 2019, MNRAS, 488, 5185 [NASA ADS] [CrossRef] [Google Scholar]
- Oesch, P. A., Bouwens, R. J., Illingworth, G. D., et al. 2014, ApJ, 786, 108 [Google Scholar]
- Oesch, P. A., Brammer, G., van Dokkum, P. G., et al. 2016, ApJ, 819, 129 [NASA ADS] [CrossRef] [Google Scholar]
- Östlin, G., Cumming, R. J., & Bergvall, N. 2007, A&A, 461, 471 [NASA ADS] [CrossRef] [EDP Sciences] [Google Scholar]
- Oteo, I., Ivison, R. J., Dunne, L., et al. 2016, ApJ, 827, 34 [Google Scholar]
- Papovich, C., Simons, R. C., Estrada-Carpenter, V., et al. 2022, ApJ, 937, 22 [NASA ADS] [CrossRef] [Google Scholar]
- Pascale, M., Dai, L., McKee, C. F., & Tsang, B. T. H. 2023, ApJ, 957, 77 [NASA ADS] [CrossRef] [Google Scholar]
- Pennell, A., Runnoe, J. C., & Brotherton, M. S. 2017, MNRAS, 468, 1433 [NASA ADS] [CrossRef] [Google Scholar]
- Pereira-Santaella, M., García-Bernete, I., González-Alfonso, E., et al. 2024, A&A, 685, L13 [NASA ADS] [CrossRef] [EDP Sciences] [Google Scholar]
- Pérez-González, P. G., Costantin, L., Langeroodi, D., et al. 2023, ApJ, 951, L1 [CrossRef] [Google Scholar]
- Pérez-González, P. G., Barro, G., Rieke, G. H., et al. 2024, ApJ, 968, 4 [CrossRef] [Google Scholar]
- Pérez-Montero, E. 2017, PASP, 129, 043001 [CrossRef] [Google Scholar]
- Planck Collaboration VI. 2020, A&A, 641, A6 [NASA ADS] [CrossRef] [EDP Sciences] [Google Scholar]
- Reddy, N. A., Shapley, A. E., Sanders, R. L., et al. 2018, ApJ, 869, 92 [NASA ADS] [CrossRef] [Google Scholar]
- Reddy, N. A., Topping, M. W., Shapley, A. E., et al. 2022, ApJ, 926, 31 [NASA ADS] [CrossRef] [Google Scholar]
- Rieke, G. H., Wright, G. S., Böker, T., et al. 2015, PASP, 127, 584 [NASA ADS] [CrossRef] [Google Scholar]
- Rigby, J., Perrin, M., McElwain, M., et al. 2023, PASP, 135, 048001 [NASA ADS] [CrossRef] [Google Scholar]
- Rinaldi, P., Caputi, K. I., Costantin, L., et al. 2023, ApJ, 952, 143 [NASA ADS] [CrossRef] [Google Scholar]
- Rinaldi, P., Caputi, K. I., Iani, E., et al. 2024, ApJ, 969, 12 [NASA ADS] [CrossRef] [Google Scholar]
- Robertson, B. E., Tacchella, S., Johnson, B. D., et al. 2023, Nat. Astron., 7, 611 [NASA ADS] [CrossRef] [Google Scholar]
- Sánchez-García, M., Pereira-Santaella, M., García-Burillo, S., et al. 2022, A&A, 659, A102 [NASA ADS] [CrossRef] [EDP Sciences] [Google Scholar]
- Sanders, R. L., Shapley, A. E., Topping, M. W., Reddy, N. A., & Brammer, G. B. 2024, ApJ, 962, 24 [NASA ADS] [CrossRef] [Google Scholar]
- Schaerer, D., Marques-Chaves, R., Xiao, M., & Korber, D. 2024, A&A, 687, L11 [NASA ADS] [CrossRef] [EDP Sciences] [Google Scholar]
- Senchyna, P., Plat, A., Stark, D. P., et al. 2024, ApJ, 966, 92 [NASA ADS] [CrossRef] [Google Scholar]
- Shen, Y., Richards, G. T., Strauss, M. A., et al. 2011, ApJS, 194, 45 [Google Scholar]
- Simmonds, C., Tacchella, S., Hainline, K., et al. 2024, MNRAS, 527, 6139 [Google Scholar]
- Smit, R., Bouwens, R. J., Labbé, I., et al. 2016, ApJ, 833, 254 [NASA ADS] [CrossRef] [Google Scholar]
- Stiavelli, M., Morishita, T., Chiaberge, M., et al. 2023, ApJ, 957, L18 [NASA ADS] [CrossRef] [Google Scholar]
- Tacchella, S., Eisenstein, D. J., Hainline, K., et al. 2023, ApJ, 952, 74 [NASA ADS] [CrossRef] [Google Scholar]
- Tang, M., Stark, D. P., Chen, Z., et al. 2023, MNRAS, 526, 1657 [NASA ADS] [CrossRef] [Google Scholar]
- Theios, R. L., Steidel, C. C., Strom, A. L., et al. 2019, ApJ, 871, 128 [NASA ADS] [CrossRef] [Google Scholar]
- Thompson, T. A., Quataert, E., & Murray, N. 2005, ApJ, 630, 167 [Google Scholar]
- Topping, M. W., Stark, D. P., Senchyna, P., et al. 2024, MNRAS, 529, 3301 [NASA ADS] [CrossRef] [Google Scholar]
- Übler, H., Maiolino, R., Pérez-González, P. G., et al. 2024, MNRAS, 531, 355 [CrossRef] [Google Scholar]
- Ucci, G., Dayal, P., Hutter, A., et al. 2023, MNRAS, 518, 3557 [Google Scholar]
- Vanzella, E., Castellano, M., Bergamini, P., et al. 2022, A&A, 659, A2 [NASA ADS] [CrossRef] [EDP Sciences] [Google Scholar]
- Vanzella, E., Loiacono, F., Bergamini, P., et al. 2023a, A&A, 678, A173 [NASA ADS] [CrossRef] [EDP Sciences] [Google Scholar]
- Vanzella, E., Claeyssens, A., Welch, B., et al. 2023b, ApJ, 945, 53 [NASA ADS] [CrossRef] [Google Scholar]
- Vestergaard, M., & Osmer, P. S. 2009, ApJ, 699, 800 [Google Scholar]
- Wells, M., Pel, J. W., Glasse, A., et al. 2015, PASP, 127, 646 [NASA ADS] [CrossRef] [Google Scholar]
- Williams, H., Kelly, P. L., Chen, W., et al. 2023, Science, 380, 416 [NASA ADS] [CrossRef] [Google Scholar]
- Wright, G. S., Wright, D., Goodson, G. B., et al. 2015, PASP, 127, 595 [NASA ADS] [CrossRef] [Google Scholar]
- Wright, G. S., Rieke, G. H., Glasse, A., et al. 2023, PASP, 135, 048003 [NASA ADS] [CrossRef] [Google Scholar]
- Xu, Y., Ouchi, M., Yajima, H., et al. 2024, ArXiv e-prints [arXiv:2404.16963] [Google Scholar]
- Zavala, J. A., Castellano, M., Akins, H. B., et al. 2024, ArXiv e-prints [arXiv:2403.10491] [Google Scholar]
- Ziparo, F., Ferrara, A., Sommovigo, L., & Kohandel, M. 2023, MNRAS, 520, 2445 [NASA ADS] [CrossRef] [Google Scholar]
All Tables
Integrated emission line fluxes and ratios, results of the [O III] 5008 Å and Hα emission line fits, and derived physical properties of GN-z11.
Physical parameters characterizing the starburst in GN-z11 and high-z galaxies in the early Universe.
All Figures
|
Fig. 1. MRS [O III] 5008 Å (left) and Hα (right) emission line maps. The [O III] 5008 Å and Hα line maps are generated by integrating a narrow velocity range, −150 < v [km s−1] < 150, around the peak of each emission line. The dashed cyan circles show the aperture chosen to extract the 1D spectra. The gray area represents the MRS spatial resolution (PSF FWHM) at the observed wavelength of each emission line. These line maps demonstrate that GN-z11 is spatially unresolved in the MRS observations. |
| In the text | |
|
Fig. 2. View of the rest-frame optical spectrum of GN-z11 by zooming in the Hβ, [O III] 4960,5008 Å, and Hα emission lines. The continuous black line shows the 1D extracted MRS spectrum. The gray area shows the ±1σ noise calculated from the standard deviation of the local background. The red area shows the spectral range used to calculate the integrated line flux. The vertical dashed black line shows the wavelength of the peak of each emission line considering a redshift of 10.602. |
| In the text | |
|
Fig. 3. MRS [O III] 5008 Å and Hα emission line fits. The left and right panels show the one-component Gaussian fits, together with the fit residuals, for the [O III] 5008 Å and Hα emission lines, respectively. The continuous black line shows the 1D extracted MRS spectrum. The gray area shows the ±1σ uncertainty calculated from the standard deviation of the local background. The green dashed line shows the one-component Gaussian function that fits the spectra best. The black vertical dashed line is the wavelength at the peak of each emission line considering a redshift of 10.602. The |
| In the text | |
|
Fig. 4. Line ratio diagrams. This figure shows the position of GN-z11 (red star) on the R2–R3, R23–O32, O32–O3Hγ and O32–O33 diagrams. JWST-detected z > 8 galaxies are represented as filled circles. The blue and red markers represent the high-z SFGs and type 1 AGNs from different samples, respectively. Further details of these samples are presented in Sect. 3.3. The local low-metallicity subsample (gray markers), drawn from Izotov et al. (2006), Izotov & Thuan (2011), Izotov et al. (2016, 2019, 2024), was selected to be 12 + log(O/H) < 8. The JADES subsample, drawn from Bunker et al. (2023) and Cameron et al. (2023a), was selected to be z > 3. The dashed lines represent the separation between the AGN-dominant and the AGN+SFGs regions presented by Mazzolari et al. (2024). When no Hγ data were available, we considered Hγ = Hα/5.93. |
| In the text | |
|
Fig. 5. Mass-metallicity diagram for z > 7 galaxies. The large red star shows the measured stellar mass and gas-phase metallicity for GN-z11. The colored circles show the location of the remaining z > 9 galaxies, compiled from the literature: MACS1149-JD1 (Stiavelli et al. 2023), RXJ2129-z95 (Williams et al. 2023), MACS0647–JD (Hsiao et al. 2024a), CEERS–1019 (Nakajima et al. 2023; Marques-Chaves et al. 2024a), GN-z9p4 (Schaerer et al. 2024), GHz2 (Zavala et al. 2024), and JADES-GS-z9-0 (Laseter et al. 2024; Curti et al. 2024a). The empty blue symbols indicate the mass and metallicity of the 7 < z < 9 galaxies, compiled from Langeroodi et al. (2023) (pluses), Nakajima et al. (2023) (stars), Curti et al. (2024b) (squares), and Morishita et al. (2024) (triangles). The dashed blue line shows the best-fit mass-metallicity relation based on a sample of direct-method metallicity measurements at 3 < z < 9.5 (Morishita et al. 2024). The solid red line and the shaded red region show the best-fit mass-metallicity relation and its uncertainty at z ∼ 8 as measured by Langeroodi et al. (2023). GN-z11 agrees with the best-fit mass-metallicity relation at z ∼ 8, consistent with little to no evolution in the normalization of the mass-metallicity relation at z > 6. The stellar mass of GN-z11 is a mean of the values presented in Bunker et al. (2023) and Tacchella et al. (2023). |
| In the text | |
|
Fig. 6. Mass-radius relation for GN-z11 including young star clusters in the nearby starbursts (NGC253, Leroy et al. 2018; M82, McCrady et al. 2003; McCrady & Graham 2007), low-z blue compact (ESO338-IG04, Östlin et al. 2007) and low-metallicity (SBS0335-052E, Adamo et al. 2010) galaxies. We also plot the values for high-z clusters (Sunburst, Vanzella et al. 2022; Sunrise, Vanzella et al. 2023b; SPT0615-JD1, Adamo et al. 2024), clumps (SMACS0723, Claeyssens et al. 2023), extremely UV-bright SFG (J1316+2614, Marques-Chaves et al. 2024b), and luminous galaxies at redshifts above 8 (GN-z8-LAE, Navarro-Carrera et al. 2024; CEERS-1019, Marques-Chaves et al. 2024a; MACS1149-JD1, Bradač et al. 2024; GN-z9p4, (Curti et al. 2024a; Schaerer et al. 2024); RXJ2129-z95, Williams et al. 2023; MACS0647-JD, Hsiao et al. 2023; GHz2, Calabro et al. 2024; GS-z14-0, Helton et al. 2024). The mass−size relation derived for z = 4–10 galaxies identified with the JWST (Langeroodi & Hjorth 2023) is shown (blue line) as reference. The dotted lines represent the constant stellar mass surface density in units of M⊙ pc−2. The line of log10Σ = 5.5 (in red) indicates the observed maximum value in clusters and the nucleus of galaxies, which was also predicted in dense systems under ineffective feedback-regulated conditions (Grudić et al. 2019). The stellar mass of GN-z11 is the average of the values presented in Bunker et al. (2023) and Tacchella et al. (2023). |
| In the text | |
Current usage metrics show cumulative count of Article Views (full-text article views including HTML views, PDF and ePub downloads, according to the available data) and Abstracts Views on Vision4Press platform.
Data correspond to usage on the plateform after 2015. The current usage metrics is available 48-96 hours after online publication and is updated daily on week days.
Initial download of the metrics may take a while.