| Issue |
A&A
Volume 687, July 2024
|
|
|---|---|---|
| Article Number | A283 | |
| Number of page(s) | 9 | |
| Section | Extragalactic astronomy | |
| DOI | https://doi.org/10.1051/0004-6361/202347187 | |
| Published online | 23 July 2024 | |
GN-z11: The environment of an active galactic nucleus at z = 10.603
New insights into the most distant Lyα detection
1
Kavli Institute for Cosmology, University of Cambridge, Madingley Road, Cambridge CB3 0HA, UK
e-mail: This email address is being protected from spambots. You need JavaScript enabled to view it.
; This email address is being protected from spambots. You need JavaScript enabled to view it.
2
Cavendish Laboratory, University of Cambridge, 19 JJ Thomson Avenue, Cambridge CB3 0HE, UK
3
Institute of Astronomy, University of Cambridge, Madingley Road, Cambridge CB3 0HA, UK
4
Centro de Astrobiología (CAB), CSIC–INTA, Cra. de Ajalvir Km. 4, 28850 Torrejón de Ardoz, Madrid, Spain
5
Department of Physics and Astronomy, University College London, Gower Street, London WC1E 6BT, UK
6
Scuola Normale Superiore, Piazza dei Cavalieri 7, 56126 Pisa, Italy
7
Harvard University, Center for Astrophysics | Harvard & Smithsonian, 60 Garden St., Cambridge, MA 2138, USA
8
Department of Physics, University of Oxford, Denys Wilkinson Building, Keble Road, Oxford OX1 3RH, UK
9
Sorbonne Université, CNRS, UMR 7095, Institut d’Astrophysique de Paris, 98 bis bd Arago, 75014 Paris, France
10
Centre for Astrophysics Research, Department of Physics, Astronomy and Mathematics, University of Hertfordshire, Hatfield AL10 9AB, UK
11
Department of Astronomy and Astrophysics, University of California, Santa Cruz, 1156 High Street, Santa Cruz, CA 95064, USA
12
Astrophysics Research Institute, Liverpool John Moores University, 146 Brownlow Hill, Liverpool L3 5RF, UK
13
NSF’s National Optical-Infrared Astronomy Research Laboratory, 950 North Cherry Avenue, Tucson, AZ 85719, USA
14
Steward Observatory University of Arizona, 933 N. Cherry Avenue, Tucson, AZ 85721, USA
15
Aix Marseille Université, CNRS, CNES, LAM (Laboratoire d’Astrophysique de Marseille), UMR 7326, 13388 Marseille, France
16
AURA for European Space Agency, Space Telescope Science Institute, 3700 San Martin Drive, Baltimore, MD 21210, USA
17
INAF – Osservatorio Astrofisco di Arcetri, largo E. Fermi 5, 50127 Firenze, Italy
Received:
14
June
2023
Accepted:
1
March
2024
Abstract
Recent observations with the James Webb Space Telescope (JWST) have further refined the spectroscopic redshift of GN-z11, one of the most distant galaxies identified with the Hubble Space Telescope, at z = 10.603. The presence of extremely dense gas (> 1010 cm−3), the detection of high-ionisation lines and of CII*1335 emission, and the presence of an ionisation cone indicate that GN-z11 also hosts an active galactic nucleus. Further photometric and spectroscopic follow-up demonstrates that it lies in a large-scale, overdense structure with possible signatures of Population III stars in its halo. Surprisingly, Lyα has also been detected despite the expected largely neutral intergalactic medium at such a redshift. We exploit recent JWST/NIRSpec integral field unit observations to demonstrate that the Lyα emission in GN-z11 is part of an extended halo with a minimum size of 0.8–3.2 kpc, depending on the definition used to derive the halo size. The surface brightness of the Lyα halo around GN-z11 appears consistent with Lyα halos observed around z ∼ 6 quasars. At the wavelength of Lyα at z ∼ 10.6, we identify three other emission line candidates within the integral field unit field of view with no UV rest-frame counterpart visible in deep images from the JWST/NIRCam. If confirmed, this could be the first evidence that the local region of GN-z11 represents a candidate protocluster core, forming just 400 Myr after the Big Bang. We give a first estimate of the dark matter halo mass of this structure (Mh = 2.96−0.39+0.44 × 10¹⁰ M⊙), which is consistent with a Coma-like cluster progenitor.
Key words: galaxies: halos / galaxies: high-redshift / dark ages / reionization / first stars
These authors contributed equally to this work.
© The Authors 2024
 Open Access article, published by EDP Sciences, under the terms of the Creative Commons Attribution License (https://creativecommons.org/licenses/by/4.0), which permits unrestricted use, distribution, and reproduction in any medium, provided the original work is properly cited.
This article is published in open access under the Subscribe to Open model. This email address is being protected from spambots. You need JavaScript enabled to view it. to support open access publication.
1. Introduction
One of the most intriguing challenges of modern extragalactic astronomy is understanding how the first luminous objects emerged from a dark and neutral Universe less than 300 million years after the Big Bang. This quest to understand Cosmic Dawn has been a scientific objective of many telescopes and instruments since the 1950s (for a review see Ellis 2022). Deep and large photometric near-infrared surveys have been undertaken to identify galaxies during the epoch of reionisation (EoR), at z ≥ 6, using the Lyman break technique (Steidel et al. 1996), a well-known and tested method based on the fact that UV photons emitted at energies higher than Lyα (λ ≤ 1216 Å) are almost completely absorbed by the neutral gas surrounding these galaxies. However, this technique can lead to the selection of interlopers, such as dusty galaxies (e.g., Hayes et al. 2012, Arrabal Haro et al. 2023), brown dwarfs (e.g., Wilkins et al. 2014), and supernovae (e.g., Yan et al. 2023). Therefore, spectroscopic follow-up is crucial to confirm the nature of high-redshift galaxy candidates.
Because of the abundance of ionising photons from primeval galaxies and active galactic nuclei (AGNs) in the early Universe, Lyα is expected to be very strong at high redshifts (equivalent widths ≥80 Å; e.g., Partridge & Peebles 1967; Charlot & Fall 1993) and has been used to spectroscopically confirm some of the most distant galaxies (e.g., Zitrin et al. 2015; Roberts-Borsani et al. 2016; Jung et al. 2022). Several mechanisms are involved in the production of Lyα photons. In the interstellar medium (ISM), young massive stars ionise the neutral hydrogen, leading to the emission of Lyα photons via the recombination of hydrogen atoms. This effect is enhanced by the presence of AGNs. Farther away, in the circumgalactic medium (CGM), Lyα can potentially be excited in shock-heated gas associated with accreting flows. Similarly, outflows can result in Lyα emission in shock-heated gas. Resonant scattering is also an important mechanism for producing Lyα photons since neutral hydrogen is optically thick to these photons (for a review see Ouchi et al. 2020). In addition to the mechanisms discussed above, the formation of Lyα halos could be reinforced by the presence of nearby companions (Bacon et al. 2021; Leonova et al. 2022). Constraining the spatial extent of this strong emission line provides constraints on the ISM and CGM properties, on the nature of the source (star-forming galaxy or AGN), and on the environment of galaxies, especially those found in the early Universe.
The large fraction of neutral hydrogen surrounding galaxies in the EoR reduces the detectability of Lyα emission originating at the earliest epochs (Robertson et al. 2015; De Barros et al. 2017). However, within the last decade, several surprising Lyα detections have been obtained from galaxies deep in the EoR (Zitrin et al. 2015; Hashimoto et al. 2018; Bunker et al. 2023). A recent comparison between James Webb Space Telescope (JWST) observations and simulations suggests an explanation for the detection of Lyα at z ≥ 7: processes driven by interacting galaxies (Witten et al. 2024) located in overdense regions (e.g., Leonova et al. 2022; Jung et al. 2022; Tang et al. 2023; Witstok et al. 2024). The most distant Lyα emission line, detected with NIRSpec/JWST data in a Hubble Space Telescope (HST) selected galaxy (Bouwens et al. 2010), is from GN-z11 at z = 10.6 (Bunker et al. 2023), with an integrated flux of 2.3 × 10⁻¹⁸ erg s−1 cm−2 and an equivalent width (EW) of 18.0 ± 2.0 Å. Interestingly, the presence of extremely dense gas (> 1010 cm−3, typical of the broad line region of AGNs) and the detections of [NeIV]λλ2422,2424 and CII*1335 emission indicate that GN-z11 also hosts an AGN (Maiolino et al. 2024a). Spectroscopic follow-up with integral field unit (IFU) data has recently provided indications of the presence of Population III (PopIII) stars in the vicinity of GN-z11 (Maiolino et al. 2024b), making this galaxy one of the most interesting and intriguing objects in the early Universe.
In this work, we investigate the spatially resolved Lyα emission in the vicinity of GN-z11, the most distant Lyα emitter currently known, by exploiting the recent NIRSpec IFU observations presented in Maiolino et al. (2024b). In Sect. 2 we briefly describe the observations and the data reduction steps taken to obtain our final reduced datacubes. In Sect. 3 we characterise the properties of the Lyα halo, and in Sect. 4 we search for companion galaxies in the local vicinity of GN-z11. Throughout this work we use the AB magnitude system (Oke & Gunn 1983) and assume the Planck Collaboration VI (2020) flat Λcold dark matter cosmology.
2. Observations and data reduction
In this work we used data obtained by the NIRSpec IFU (Jakobsen et al. 2022; Böker et al. 2022), which are presented in full detail in Maiolino et al. (2024b). These data were obtained May 22–23, 2023, under Director Discretionary Time (DDT) programme 4426 (PI: Roberto Maiolino). The observations used a medium cycling pattern with 10 dithers using a total of 3.3 h on source with the medium-resolution grating–filter pair G140M/F100LP and 10.6 h with the medium-resolution grating–filter pair G235M/F170LP. This configuration covers 0.97–1.89 μm and 1.66–3.17 μm, respectively, with a nominal spectral resolution of R ∼ 1000. The detector was set with the improved reference sampling and subtraction pattern (IRS2), which reduces significantly the readout noise (Rauscher et al. 2012).
Despite JWST’s excellent pointing accuracy (i.e., 1σ = 0.1″1, Rigby et al. 2023) and accurate target coordinates using Gaia-aligned astrometry, the observations were not centred properly as the guide star selected by the observatory was a binary system, introducing a large offset (1.4″ towards the SE; Maiolino et al. 2024b). This offset caused GN-z11 to be close to the edge of the field of view (FoV) of the NIRSpec/IFU. As a result, for three dither positions, GN-z11 was located at the edge of FoV, while for the remaining seven dithers varying parts of the region west of GN-z11 were outside the FoV of the instrument. This results in steeply decreasing sensitivity of the observations to the west of GN-z11 (and also beyond 0.7″ north of GN-z11). We re-aligned the astrometry of the NIRSpec/IFU observations to the Gaia-aligned NIRCam. We collapsed the IFU cube in the wavelength range of the NIRCam filter and realigned it with the UV continuum of GN-z11 in the NIRCam observations (Tacchella et al. 2023).
The full data reduction is described in Maiolino et al. (2024b), here we briefly describe the process. The raw data were processed with the JWST Science Calibration pipeline2 version 1.8.2 under CRDS context jwst_1068.pmap. We made a number of modifications to the reduction steps to improve the data reduction (see Perna et al. 2023 for more details). The final cubes were created using ‘drizzle’ method setting the spatial pixel scale to 0.06″ to match the pixel scale of the NIRCam images. For this step, we used an official patch to correct a known bug3.
3. Properties of the most distant Lyα halo
In order to map the individual emission lines we first subtracted the background spectrum. We created the master background by producing a median spectrum of object-free spaxels with a running median filter of 25 channels to avoid any noise spikes. This master background was subtracted from each spaxel in the cube. To create the Lyα map, we collapsed the channels within ±400 km s−1 centred on the peak of the Lyα emission line from Bunker et al. (2023) (channels 695–703, ∼1.4115 − 1.4152 μm) and subtracted the continuum image (created by taking the channels immediately redwards of the Lyα emission line and taking the median flux). We smoothed the Lyα image with a Gaussian kernel with a sigma of 1.5 pixels (0.09″). We show this Lyα image in the left column of Fig. 1 (2, 3, 4, and 5σ levels; with the noise level estimated using the object free central region of the cube) plotted over the NIRCam F277W image. We also indicate the region of the data cube with no more than 70% of the dither positions (because of the observatory guiding problem) and we highlight the region with < 30% of the dither positions.
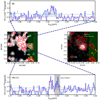 |
Fig. 1. Overview of the Lyα around GN-z11. Middle left: map of the Lyα emission with dashed red contours representing the 2, 3, 4, and 5σ levels. Middle right: JWST/NIRCam F277W continuum image with the Lyα emission map overlaid as dashed red contours (2, 3, 4, and 5σ levels). The dotted green lines indicate where fewer than 70% of the dither positions cover the area, and the green shading the area covered by fewer than 30% of the dithers. We show extracted spectra from the two Lyα blobs to confirm the Lyα map morphology in the top and bottom panels. The best fit to the emission line is shown as a dashed red line, and the noise is shown as a dotted black line. We highlight the spectral region affected by the data artefact at the edge of the FoV as a grey-shaded region. |
The Lyα is extended in the NE direction, with a secondary spatial peak 0.4″ (i.e., 1.6 kpc) away from the location of the GN-z11 continuum peak (see Fig. 1). We also detect an extension of the Lyα to the SW of the continuum centre of GN-z11 on a scale of 0.2 arcsec, similar to the previous reports of this extension in the MSA observations in Bunker et al. (2023). The finding of extended CIII]λ1909 emission in this direction, with a funnel-shaped geometry (Maiolino et al. 2024a), indicates that the SW Lyα extension is tracing the AGN ionisation cone. However, the Lyα extension in the cone region should be considered with great care because it is only partially covered by the dithers of the observations and is also potentially subject to field edge issues.
We extracted the spectrum from two separate regions: one encompassing the NE extension (i.e., companion) and the other one centred on the GN-z11 continuum location and also including the SW extension (these regions are shown by dashed blue lines on the NIRCam images in Fig. 1). Specifically, we selected these regions to coincide with the structure and peaks of the Lyα map in order to extract the total emission line flux. In the combined 1D spectra, we detect Lyα emission at 4.5σ and 6.0σ for the central and NE regions, respectively. There is a data artefact around 1.42 μm, which is only seen in the region where we have 50% fewer exposures (the SW region of GN-z11), possibly associated with field edge issues (furthermore, the second peak hinted at by this data artefact is not seen in the much deeper MSA observations; Bunker et al. 2023).
We fitted the extracted spectrum with both a Gaussian profile describing the emission line and a power law with a break at 1.41 microns to describe the galaxy continuum. Although Lyα emission often has a complex line profile, given the low signal-to-noise ratio (S/N) of these observations we fitted a simple Gaussian profile. This model was fitted to the data using the Markov chain Monte Carlo algorithm with Python’s emcee package (Foreman-Mackey et al. 2013). The final quoted parameter values and their uncertainties are the median value and 68% confidence intervals of the posterior distribution.
The combined measured flux from the two separate regions (3.9 × 10⁻¹⁸ erg s−1 cm−2) is 70% higher than those measured in the MSA observations (Bunker et al. 2023). Since flux calibrations of the MSA and IFU observations are accurate to < 5% for both instrument modes (Böker et al. 2023), two factors are likely affecting the MSA measurements: (1) the potential self-subtraction of the extended emission line in the MSA observations and (2) the Lyα emission being more extended than the size of the MSA shutter. We summarise Lyα emission line results for each region in Table 1.
Measured S/Ns, fluxes, FWHMs, and velocity offsets to the emission lines in GN-z11 for the Lyα emission line extracted from the MSA (Bunker et al. 2023) and the regions defined in Figs. 1 and 3.
The Lyα emission line profile varies significantly across the two separate regions. The full width at half maximum (FWHM) of the Lyα emission line varies between 440 and 1000 km s−1 across the regions. Furthermore, the velocity offset of the Lyα emission with respect to the rest-frame optical emission lines from (z = 10.6034, Bunker et al. 2023) is 520 and 915
 km s−1 for the central and NE blobs, respectively. We report the results of fitting the Lyα emission from these two regions in Table 1. We recover a velocity offset of the Lyα emission line in the local vicinity of GN-z11 that is consistent with that measured by Bunker et al. (2023) and observe an increasing velocity offset in the NE direction, as shown in Fig. 1. We see a tentative detection of the unresolved CIVλλ1548,1551 emission line doublet in the location of the NE blob with a 420 km s−1 velocity offset compared to the systemic redshift of GN-z11 (see the appendix for more information). This implies that both GN-z11 and the NE blob have a similar velocity offset of their Lyα emission from their respective systemic redshifts of ∼500 km s−1. This large velocity offset is indicative of a very low escape fraction of Lyman-continuum photons (∼0%; Izotov et al. 2018; Gazagnes et al. 2020; Kakiichi & Gronke 2021), which is consistent with the escape fraction derived by Bunker et al. (2023, 3.8%).
We also note that the Lyα emission lines of both regions do not show significant asymmetry. While this asymmetry is somewhat typical of high-redshift Lyα emitters (Finkelstein et al. 2013; Oesch et al. 2015; Jung et al. 2022), Kakiichi & Gronke (2021) show that with no or few holes in the neutral hydrogen surrounding Ly continuum leaking regions, symmetrical Lyα profiles can be observed. Moreover, Witten et al. (2023) show that the intergalactic medium (IGM) transmission curve can significantly disturb the asymmetry of the Lyα line as it processes through the neutral IGM and hence, the symmetrical Lyα emission line observed here does not necessarily trace the intrinsic profile of the emission line. Furthermore, Bunker et al. (2023) do detect some asymmetry in the Lyα line originating from the position of the UV continuum of GN-z11 and therefore it is possible that the IFU observations do not have the required depth to detect this asymmetry.
The morphology of Lyα emission around GN-z11 is complex with two extended connected peaks. As such, it is difficult to assess whether this is a single Lyα halo or two overlapping halos around two separate sources. As a result, we define the Lyα halo size in two different ways: (1) we assume that these are two independent Lyα halos and here we report the size of the halo centred on the UV continuum of GN-z11 (similar to the definition from Bunker et al. 2023), which would result in a radius of 0.8 kpc; and (2) we assume that the entire structure is single asymmetric Lyα halo encompassing the two peaks and we define the size from the UV continuum centre to the furthermost 2σ contours of 0.78 ± 0.1″ (3.2 ± 0.4 kpc).
Before the arrival of the JWST, one of the best instruments to study the profile of Lyα halos at high redshift was the Multi Unit Spectroscopic Explorer (MUSE) at the Very Large Telescope (VLT; Bacon et al. 2010). However, its wavelength coverage is not sufficient to detect Lyα halos at z ≥ 6.7. Leclercq et al. (2017) studied the halos of 145 galaxies at 3 < z < 6 and concluded that 80% of their sources have Lyα emission more extended than the UV continuum. Farina et al. (2019) presented VLT/MUSE observations of 31 quasars (z = 5.7–6.6) with 39% of the sources revealing Lyα halos. GN-z11, with its UV luminosity of (MUV = −21.5), would be considered a bright star-forming galaxy by Leclercq et al. (2017) and Wisotzki et al. (2018) and a faint quasar by Farina et al. (2019); hence, it is necessary to compare the Lyα halo properties to both star-forming galaxies and quasars.
We compare the surface brightness of GN-z11 to the profiles of star-forming galaxies from Wisotzki et al. (2018) and quasars from Farina et al. (2019) in Fig. 2. To account for cosmological dimming across different redshifts, we multiplied the surface brightness profiles by (1 + z)4 to make for an easier comparison. We show two separate measurements for GN-z11 based on the definitions outlined above: (1) a single smaller halo centre on the GN-z11 UV continuum (dark blue circle); and (2) the extent of the full larger halo encompassing both peaks (light blue square). Remarkably, the size and surface brightness of the GN-z11 halo is consistent with those around quasars rather than star-forming galaxies. We also note that the asymmetric Lyα halo currently observed around GN-z11, although potentially as a result of insufficient dithers due to the guiding problem, does mimic the structure of Lyα halos around quasars in overdense regions at lower redshifts (e.g., Cantalupo et al. 2014; Hennawi et al. 2015; Bacon et al. 2021).
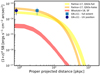 |
Fig. 2. Comparison of the Lyα halo surface brightness of GN-z11 to the profiles of Lyα halos around star-forming galaxies at z = 5.0–6.0 (red shaded region; Wisotzki et al. 2018) and quasars at z = 5.7–6.6 (yellow and orange shaded region; Farina et al. 2019). For the quasars from Farina et al. (2019) we show the radial surface brightness profiles for the full sample and for only those with detected Lyα halos as yellow and orange regions, respectively. We show two separate definitions of halo size for GN-z11: a smaller halo in the vicinity of the UV continuum (dark blue circle) and the full extent of the asymmetric halo (light blue square). The surface brightness and the extent of GN-z11’s Lyα halo are in agreement with quasars rather than star-forming galaxies at z ∼ 6. |
We also compared our measurements with what is expected from zoom-in simulations of a large halo of Mh = 6.9 × 10¹² M⊙ at z = 6 (Bennett et al. 2024; Sijacki et al. 2009), with variations in the feedback model from the FABLE suite of simulations (Henden et al. 2018). These simulations are a higher resolution version of those described in Bennett et al. (2024), and use the same physical models. Bunker et al. (2023) estimate a metallicity for GN-z11 of 0.12 Z⊙, which corresponds to a dust-to-metal ratio (DMR) of ∼0.01 (Li et al. 2019). Our Lyα modelling uses the COLT code (Smith et al. 2015), which includes Lyα emission from unresolved HII regions around stars and the effect of ionisation from the AGN on the surrounding gas, and we used two different DMRs, 0.01 and 0.1. Our simulations conclude that (i) the size of the halo depends on the DMR (the halo is 25–33% larger with a DMR = 0.01 than with a DMR = 0.1) and (ii) the expected size of the GN-z11 halo ranges between 2.5 and 3.0 kpc.
4. Search for companions in the vicinity of GN-z11
The presence of nine galaxies within an area of ∼100 Mpc2 with photometric redshifts within Δz = 1 of the redshift of GN-z11, places GN-z11 at the centre of a clustered region, reported by Tacchella et al. (2023). This could provide an explanation for the escape of Lyα radiation through the intervening neutral IGM, via the production of a large ionised bubble (Tilvi et al. 2020; Leonova et al. 2022; Witstok et al. 2024). Moreover, the presence of a HeII clump, reported by Maiolino et al. (2024b), that may host PopIII stars provides the first evidence of a potential companion galaxy just 0.6″ from GN-z11. The presence of such companions helps explain the production and escape of Lyα radiation through the local environment of high-redshift galaxies (Witten et al. 2024). With this in mind, we searched for emission lines in the NIRSpec IFU FoV that can be attributed to companion galaxies at a redshift consistent with that of GN-z11.
We note that no photometric candidate companions exist within the limited FoV of these observations. Any such companions identified with these observations will therefore have no associated UV continuum. However, Kerutt et al. (2022) found that one-third of Lyα emitters in MUSE have no associated UV continuum counterpart and hence this would not be unexpected.
4.1. Lyα emitting blobs
Figure 1 reveals a Lyα ‘blob’ ∼0.4″ to the north-east of GN-z11, originating just above the ‘haze’ reported by Tacchella et al. (2023). This 6σ detection of Lyα spectroscopically confirms the presence of a companion galaxy. Indeed, we also have a tentative CIVλ1550 detection in the NE Lyα blob at 3.2σ (see Appendix A) indicating a potentially highly ionising source in that region, such as a very young stellar population or a faint AGN (see Maiolino et al. 2024b, for more details). Moreover, the detection of HeII emission from a clump ∼0.6″ to the north-east of GN-z11, originating from a distinct region to the Lyα halo (Maiolino et al. 2024b), indicates the presence of pristine gas, possibly photoionised by a cluster of PopIII stars.
This detection of emission lines originating from clumps that are distinct from GN-z11 offers a deeper insight into the processes driving Lyα emission at these epochs. It acts as further support for the idea that galaxy interactions are driving Lyα emission in the EoR (Witten et al. 2024), and confirms that a significant amount of neutral hydrogen around these sources must have been displaced in order to facilitate the observation of Lyα photons from both sources, despite their different properties. This result also suggests that peculiar velocities may not be playing a significant role in the escape of Lyα photons given that both GN-z11 and the NE region have relatively large velocity offsets from each other (∼400 km s−1). If a large velocity offset driven by gravitational interactions between GN-z11 and these clumps was driving the escape of Lyα photons through the neutral IGM, it could be expected that only one source would show Lyα emission. That source would emit Lyα photons that are heavily redshifted relative to the neutral IGM and hence, are more likely to escape without attenuation, while the other source would emit Lyα photons that are blueshifted and hence would be absorbed by the neutral hydrogen in the IGM unless a significant ionised bubble is present (e.g., Tilvi et al. 2020; Leonova et al. 2022; Witstok et al. 2024; Witten et al. 2024). While the interaction between GN-z11 and its companions is more complex than a simple two-body interaction, this result offers an early indication that peculiar velocities may not be the most important factor in facilitating Lyα escape.
We also searched for more distant Lyα-emitting sources in the full FoV of the NIRSpec IFU observations (specifically the area fully covered by the ten dithers) within ±2000 km s−1 of the systematic redshift of GN-z11. We find a single candidate detected 2.15 arcseconds east of GN-z11 and we show the location of the candidate and its spectrum in Fig. 3. The emission line is detected at 4.5σ with FWHM of 520 km s−1 at z = 10.6346, 290 km s−1 offset redwards of the Lyα emission line of GN-z11.
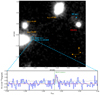 |
Fig. 3. Detection of an additional Lyα emitter, 2.1 arcseconds to the east of GN-z11. Top: JWST/NIRCam F277W image corresponding to the FoV of our NIRSpec/IFU observations. We indicate the region from which we extracted the spectrum on the right with dashed blue contours. We also indicate three foreground galaxies visible in the NIRCam image with their corresponding redshifts. Bottom: Extracted Lyα spectrum from the region indicated in the NIRCam image. The dashed red line shows the best fit to the spectrum, and the dotted black line shows the error spectrum. The dashed green line shows the wavelength of Lyα emission seen in the main component of GN-z11. The foreground galaxies in the vicinity show no visible emission lines that would contaminate this spectrum. |
Since the Lyα emitter is close to the foreground galaxy, we verified that the emission line is indeed from a z ∼ 10.63 galaxy and not the foreground source (zphot = 0.63; Hainline et al. 2024). We extracted a spectrum with a radius of 0.3″ centred on the source east of the Lyα blob in both band 1 and band 2 IFU observations. Although the continuum is well detected in both bands, we do not detect any emission lines in this foreground source. Assuming that the Lyα emission from the candidate is in fact an emission line coming from the foreground source at z ∼ 0.63, the only possible emission line would be CaIIλ8664, which we do not expect to see without detection of the [SIII]λ9532, HeIλ10830, and Paδ emission lines.
Given that these emission lines are undetected, we conclude that this emission is not coming from the foreground galaxy, but is indeed an additional Lyα emitter at a redshift similar to that of GN-z11.
4.2. A candidate z = 10.6 protocluster core
Tacchella et al. (2023) previously identified a photometric candidate overdensity surrounding GN-z11 within a ∼10 cMpc × 10 cMpc region, which corresponds to ∼430 pkpc at z = 10.6. The detection of the HeII blob (Maiolino et al. 2024b), the Lyα blob ∼0.4″ NE of GN-z11 and the detection of a further Lyα blob 2.1″ to the east brings the number of spectroscopically confirmed z ∼ 10.6 objects in the NIRSpec IFU FoV to four. Previous theoretical works (e.g., Chiang et al. 2017) have demonstrated that the expected size of a protocluster core is on the relatively small scales of hundreds of ckpc by z ∼ 7. Observations of protocluster cores at a similar redshift (e.g., Capak et al. 2011; Arribas et al. 2023; Hashimoto et al. 2023; Morishita et al. 2023) have also found a central core of the order of 150 ckpc. This finding supports our conclusion that the objects seen within the IFU FoV (140 ckpc × 140 ckpc) are representative of the core of a protocluster. Moreover, theoretical work by Chiang et al. (2017) has shown that the overall size of the protocluster at high redshifts like these is typically of the order of 10 cMpc, consistent with the larger-scale overdensity of galaxies identified by Tacchella et al. (2023).
Comparing the number of objects identified in the IFU FoV at z = 10.6 we find an overdensity parameter of δ ≥ 27. We estimated the number of galaxies that are expected in the FoV by integrating the luminosity function of Harikane et al. (2024), at z ∼ 10, down to a UV magnitude that was determined by assuming that the Lyα blobs have a maximum Lyα rest-frame EW of ∼1000 Å. We made this assumption as these Lyα blobs have no associated UV continuum. We give the overdensity parameter as a lower bound as the FoV of the NIRSpec IFU is too small to accurately constrain the overdensity parameter, and thus we used the upper-bound expected number of galaxies to get an absolute lower bound on our overdensity parameter. This value is significantly larger than the overdensity parameter for the z = 7.66 protocluster core presented in Laporte et al. (2022) and, following the same method as above, we estimate an overdensity parameter of δ ≥ 11 for the z = 7.88 protocluster core presented in Hashimoto et al. (2023). Given that (1) the region surrounding GN-z11 is more overdense than previously observed protocluster cores at z ∼ 8, (2) it resides in a large-scale photometric redshift overdensity (Tacchella et al. 2023), and (3) protoclusters are expected to fuel AGNs in their central galaxy (eventually forming the observed population of massive z ∼ 6 quasars; see Bennett et al. 2024), as is observed in the case of GN-z11 (Maiolino et al. 2024a), the region surrounding GN-z11 appears to be a strong candidate for a protocluster core. Moreover, GN-z11 is by far the brightest galaxy in this structure, potentially making it a precursor of the brightest cluster galaxies seen at lower redshifts.
As a preliminary analysis, we estimated the dark matter halo mass of this structure following Behroozi et al. (2013). We assumed that the total stellar mass of this protocluster core is dominated by GN-z11 and obtain a dark matter halo mass of  . This is a reasonable assumption given that all objects within the IFU FoV do not have any UV counterpart in the NIRCam images. Moreover, candidates identified in Tacchella et al. (2023) are 3 mag fainter than GN-z11 and will therefore have much smaller stellar masses than GN-z11. We compared this dark matter halo mass with previous findings at lower redshift (Polletta et al. 2021; Casey 2016; Champagne et al. 2021; Wang et al. 2016; McConachie et al. 2022; Toshikawa et al. 2018; Long et al. 2020; Calvi et al. 2021; Chanchaiworawit et al. 2019; Harikane et al. 2019; Laporte et al. 2022) and with the expected evolution of a Coma-like cluster at z = 0 (Chiang et al. 2013) assuming a constant slope in the evolution at z ≥ 4 (see Fig. 4). The estimated dark matter halo mass of the GN-z11 protocluster is fully consistent with what is expected for a Coma-like cluster progenitor at z = 10.6.
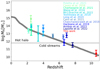 |
Fig. 4. Evolution of the protocluster dark matter halo mass as a function of redshift. The grey line shows the evolution of a protocluster leading to a Coma-like cluster at z = 0 (Chiang et al. 2013). We extrapolate this evolution to z ∼ 11 assuming no change in the slope from z ∼ 4. The dark matter halo mass of GN-z11 is fully consistent with this evolution. |
5. Conclusions
We have presented an analysis of JWST/NIRSpec IFU observations of GN-z11, an extremely luminous galaxy at z = 10.603 that hosts an AGN. Due to a telescope guiding problem, GN-z11 is near the edge of the FoV and hence we are only able to map the Lyα halo extension on and to the north and east of GN-z11.
We detect extended Lyα emission at the location of GN-z11 and towards the NE. Extracting the spectrum from the two separate regions (GN-z11 and the NE extension), we have measured a velocity offset of the Lyα emission with respect to GN-z11 of 520 and 915
 km s−1 for the central and NE extension, respectively. We have measured the extent of the Lyα halo to be 0.8 or 3.2 kpc based on two separate definitions of the size (i.e. from one edge of the whole structure to the other, and the size of the smaller-scale halo around the UV continuum of GN-z11. Comparing the radial surface brightness of GN-z11 to previous studies at z = 5–6.5 (Wisotzki et al. 2018; Farina et al. 2019) shows that the Lyα halo is consistent with those of quasars rather than star-forming galaxies.
We also detect a distinct Lyα blob to the NE of GN-z11. Together with the previously identified HeII clump (Maiolino et al. 2024b), this indicates the presence of multiple companions surrounding GN-z11. This appears to support the theory that companion galaxies play a key role in the detectability of Lyα emitting galaxies deep into the EoR (Witten et al. 2024).
The further identification of a Lyα blob 2.1″ east of GN-z11 brings the number of objects within the NIRSpec IFU FoV (3″×3″) to four, making this region more overdense than previously discovered protocluster cores at z ∼ 8. This significant overdensity, combined with the larger-scale overdensity reported in Tacchella et al. (2023) and the presence of an AGN at the centre of GN-z11 (Maiolino et al. 2024a), makes the region studied in this work a strong candidate for a protocluster core. Our preliminary analysis of this protocluster demonstrates that it has a dark matter halo mass consistent with what is expected for a Coma-like cluster progenitor at z ∼ 10.6. Our study confirms that the most massive galaxies identified with HST, including GN-z11, are indeed surrounded by much fainter, previously undetected, galaxies at similar redshifts, which likely formed the first large-scale structure in the Universe.
Acknowledgments
The authors would like to thank Yucheng Guo for a very productive and helpful discussion. FDE, JS, RM, TL, WB acknowledge support by the Science and Technology Facilities Council (STFC), ERC Advanced Grant 695671 “QUENCH”. RM also acknowledges funding from a research professorship from the Royal Society. CW thanks the Science and Technology Facilities Council (STFC) for a PhD studentship, funded by UKRI grant 2602262. NL acknowledges support from the Kavli foundation. HÜ gratefully acknowledges support by the Isaac Newton Trust and by the Kavli Foundation through a Newton-Kavli Junior Fellowship. JSB acknowledges support from the by the Simons Foundation Collaboration on “Learning the Universe”. M.P., S.A and B.R.P. acknowledge support from the research project PID2021-127718NB-I00 of the Spanish Ministry of Science and Innovation/State Agency of Research (MICIN/AEI/ 10.13039/501100011033), and M.P. the Programa Atraccion de Talento de la Comunidad de Madrid via grant 2018-T2/TIC-11715. AJB acknowledges funding from the “FirstGalaxies” Advanced Grant from the European Research Council (ERC) under the European Union’s Horizon 2020 research and innovation programme (Grant Agreement No. 789056) S.C and G.V. acknowledge support by the European Union’s HE ERC Starting Grant No. 101040227 – WINGS. ECL acknowledges the support of an STFC Webb Fellowship (ST/W001438/1) DJE is supported as a Simons Investigator and by JWST/NIRCam contract to the University of Arizona, NAS5-02015 BER acknowledges support from the NIRCam Science Team contract to the University of Arizona, NAS5-02015. RS acknowledges support from an STFC Ernest Rutherford Fellowship (ST/S004831/1). The research of CCW is supported by NOIRLab, which is managed by the Association of Universities for Research in Astronomy (AURA) under a cooperative agreement with the National Science Foundation. C N A.W. acknowledges JWST/NIRCam contract to the University of Arizona NAS5-02015 The authors acknowledge the use of the lux supercomputer at UC Santa Cruz, funded by NSF MRI grant AST 1828315. The simulations described in this work were performed at the DiRAC@Durham facility managed by the Institute for Computational Cosmology on behalf of the STFC DiRAC HPC Facility (www.dirac.ac.uk). The equipment was funded by BEIS capital funding via STFC capital grants ST/P002293/1, ST/R002371/1 and ST/S002502/1, Durham University and STFC operations grant ST/R000832/1. DiRAC is part of the National e-Infrastructure.
References
- Arrabal Haro, P., Dickinson, M., Finkelstein, S. L., et al. 2023, Nature, 622, 707 [NASA ADS] [CrossRef] [Google Scholar]
- Arribas, S., Perna, M., Rodríguez Del Pino, B., et al. 2023, ArXiv e-prints [arXiv:2312.00899] [Google Scholar]
- Bacon, R., Accardo, M., Adjali, L., et al. 2010, in Ground-based and Airborne Instrumentation for Astronomy III, eds. I. S. McLean, S. K. Ramsay, & H. Takami, SPIE Conf. Ser., 7735, 773508 [Google Scholar]
- Bacon, R., Mary, D., Garel, T., et al. 2021, A&A, 647, A107 [NASA ADS] [CrossRef] [EDP Sciences] [Google Scholar]
- Behroozi, P. S., Wechsler, R. H., & Conroy, C. 2013, ApJ, 770, 57 [NASA ADS] [CrossRef] [Google Scholar]
- Bennett, J. S., Sijacki, D., Costa, T., Laporte, N., & Witten, C. 2024, MNRAS, 527, 1033 [Google Scholar]
- Böker, T., Arribas, S., Lützgendorf, N., et al. 2022, A&A, 661, A82 [NASA ADS] [CrossRef] [EDP Sciences] [Google Scholar]
- Böker, T., Beck, T. L., Birkmann, S. M., et al. 2023, PASP, 135, 038001 [CrossRef] [Google Scholar]
- Bouwens, R. J., Illingworth, G. D., Oesch, P. A., et al. 2010, ApJ, 709, L133 [CrossRef] [Google Scholar]
- Bunker, A. J., Saxena, A., Cameron, A. J., et al. 2023, A&A, 677, A88 [NASA ADS] [CrossRef] [EDP Sciences] [Google Scholar]
- Calvi, R., Dannerbauer, H., Arrabal Haro, P., et al. 2021, MNRAS, 502, 4558 [NASA ADS] [CrossRef] [Google Scholar]
- Cantalupo, S., Arrigoni-Battaia, F., Prochaska, J. X., Hennawi, J. F., & Madau, P. 2014, Nature, 506, 63 [Google Scholar]
- Capak, P. L., Riechers, D., Scoville, N. Z., et al. 2011, Nature, 470, 233 [Google Scholar]
- Casey, C. M. 2016, ApJ, 824, 36 [CrossRef] [Google Scholar]
- Champagne, J. B., Casey, C. M., Zavala, J. A., et al. 2021, ApJ, 913, 110 [NASA ADS] [CrossRef] [Google Scholar]
- Chanchaiworawit, K., Guzmán, R., Salvador-Solé, E., et al. 2019, ApJ, 877, 51 [NASA ADS] [CrossRef] [Google Scholar]
- Charlot, S., & Fall, S. M. 1993, ApJ, 415, 580 [Google Scholar]
- Chiang, Y.-K., Overzier, R., & Gebhardt, K. 2013, ApJ, 779, 127 [Google Scholar]
- Chiang, Y.-K., Overzier, R. A., Gebhardt, K., & Henriques, B. 2017, ApJ, 844, L23 [Google Scholar]
- De Barros, S., Pentericci, L., Vanzella, E., et al. 2017, A&A, 608, A123 [NASA ADS] [CrossRef] [EDP Sciences] [Google Scholar]
- Ellis, R. S. 2022, When Galaxies Were Born (The Quest for Cosmic Dawn) [Google Scholar]
- Farina, E. P., Arrigoni-Battaia, F., Costa, T., et al. 2019, ApJ, 887, 196 [Google Scholar]
- Finkelstein, S. L., Papovich, C., Dickinson, M., et al. 2013, Nature, 502, 524 [CrossRef] [Google Scholar]
- Foreman-Mackey, D., Hogg, D. W., Lang, D., & Goodman, J. 2013, PASP, 125, 306 [Google Scholar]
- Gazagnes, S., Chisholm, J., Schaerer, D., Verhamme, A., & Izotov, Y. 2020, A&A, 639, A85 [NASA ADS] [CrossRef] [EDP Sciences] [Google Scholar]
- Hainline, K. N., Johnson, B. D., Robertson, B., et al. 2024, ApJ, 964, 71 [CrossRef] [Google Scholar]
- Harikane, Y., Ouchi, M., Ono, Y., et al. 2019, ApJ, 883, 142 [Google Scholar]
- Harikane, Y., Nakajima, K., Ouchi, M., et al. 2024, ApJ, 960, 56 [NASA ADS] [CrossRef] [Google Scholar]
- Hashimoto, T., Laporte, N., Mawatari, K., et al. 2018, Nature, 557, 392 [NASA ADS] [CrossRef] [Google Scholar]
- Hashimoto, T., Álvarez-Márquez, J., Fudamoto, Y., et al. 2023, ApJ, 955, L2 [NASA ADS] [CrossRef] [Google Scholar]
- Hayes, M., Laporte, N., Pelló, R., Schaerer, D., & Le Borgne, J.-F. 2012, MNRAS, 425, L19 [NASA ADS] [CrossRef] [Google Scholar]
- Henden, N. A., Puchwein, E., Shen, S., & Sijacki, D. 2018, MNRAS, 479, 5385 [CrossRef] [Google Scholar]
- Hennawi, J. F., Prochaska, J. X., Cantalupo, S., & Arrigoni-Battaia, F. 2015, Science, 348, 779 [Google Scholar]
- Izotov, Y. I., Worseck, G., Schaerer, D., et al. 2018, MNRAS, 478, 4851 [Google Scholar]
- Jakobsen, P., Ferruit, P., Alves de Oliveira, C., et al. 2022, A&A, 661, A80 [NASA ADS] [CrossRef] [EDP Sciences] [Google Scholar]
- Jung, I., Finkelstein, S. L., Larson, R. L., et al. 2022, ApJ, submitted [Google Scholar]
- Kakiichi, K., & Gronke, M. 2021, ApJ, 908, 30 [CrossRef] [Google Scholar]
- Kerutt, J., Wisotzki, L., Verhamme, A., et al. 2022, A&A, 659, A183 [NASA ADS] [CrossRef] [EDP Sciences] [Google Scholar]
- Laporte, N., Zitrin, A., Dole, H., et al. 2022, A&A, 667, L3 [NASA ADS] [CrossRef] [EDP Sciences] [Google Scholar]
- Leclercq, F., Bacon, R., Wisotzki, L., et al. 2017, A&A, 608, A8 [NASA ADS] [CrossRef] [EDP Sciences] [Google Scholar]
- Leonova, E., Oesch, P. A., Qin, Y., et al. 2022, MNRAS, 515, 5790 [NASA ADS] [CrossRef] [Google Scholar]
- Li, Q., Narayanan, D., & Davé, R. 2019, MNRAS, 490, 1425 [CrossRef] [Google Scholar]
- Long, A. S., Cooray, A., Ma, J., et al. 2020, ApJ, 898, 133 [NASA ADS] [CrossRef] [Google Scholar]
- Maiolino, R., Scholtz, J., Witstok, J., et al. 2024a, Nature, 627, 59 [NASA ADS] [CrossRef] [Google Scholar]
- Maiolino, R., Übler, H., Perna, M., et al. 2024b, A&A, 687, A67 [NASA ADS] [CrossRef] [EDP Sciences] [Google Scholar]
- McConachie, I., Wilson, G., Forrest, B., et al. 2022, ApJ, 926, 37 [NASA ADS] [CrossRef] [Google Scholar]
- Morishita, T., Roberts-Borsani, G., Treu, T., et al. 2023, ApJ, 947, L24 [NASA ADS] [CrossRef] [Google Scholar]
- Oesch, P. A., van Dokkum, P. G., Illingworth, G. D., et al. 2015, ApJ, 804, L30 [Google Scholar]
- Oke, J. B., & Gunn, J. E. 1983, ApJ, 266, 713 [NASA ADS] [CrossRef] [Google Scholar]
- Ouchi, M., Ono, Y., & Shibuya, T. 2020, ARA&A, 58, 617 [Google Scholar]
- Partridge, R. B., & Peebles, P. J. E. 1967, ApJ, 147, 868 [Google Scholar]
- Perna, M., Arribas, S., Marshall, M., et al. 2023, A&A, 679, A89 [NASA ADS] [CrossRef] [EDP Sciences] [Google Scholar]
- Planck Collaboration VI 2020, A&A, 641, A6 [NASA ADS] [CrossRef] [EDP Sciences] [Google Scholar]
- Polletta, M., Soucail, G., Dole, H., et al. 2021, A&A, 654, A121 [NASA ADS] [CrossRef] [EDP Sciences] [Google Scholar]
- Rauscher, B. J., Arendt, R. G., Fixsen, D. J., et al. 2012, in High Energy, Optical, and Infrared Detectors for Astronomy V, eds. A. D. Holland, & J. W. Beletic, SPIE Conf. Ser., 8453, 84531F [NASA ADS] [CrossRef] [Google Scholar]
- Rigby, J., Perrin, M., McElwain, M., et al. 2023, PASP, 135, 048001 [NASA ADS] [CrossRef] [Google Scholar]
- Roberts-Borsani, G. W., Bouwens, R. J., Oesch, P. A., et al. 2016, ApJ, 823, 143 [NASA ADS] [CrossRef] [Google Scholar]
- Robertson, B. E., Ellis, R. S., Furlanetto, S. R., & Dunlop, J. S. 2015, ApJ, 802, L19 [Google Scholar]
- Sijacki, D., Springel, V., & Haehnelt, M. G. 2009, MNRAS, 400, 100 [NASA ADS] [CrossRef] [Google Scholar]
- Smith, A., Safranek-Shrader, C., Bromm, V., & Milosavljević, M. 2015, MNRAS, 449, 4336 [Google Scholar]
- Steidel, C. C., Giavalisco, M., Pettini, M., Dickinson, M., & Adelberger, K. L. 1996, ApJ, 462, L17 [Google Scholar]
- Tacchella, S., Eisenstein, D. J., Hainline, K., et al. 2023, ApJ, 952, 74 [NASA ADS] [CrossRef] [Google Scholar]
- Tang, M., Stark, D. P., Chen, Z., et al. 2023, MNRAS, 526, 1657 [NASA ADS] [CrossRef] [Google Scholar]
- Tilvi, V., Malhotra, S., Rhoads, J. E., et al. 2020, ApJ, 891, L10 [NASA ADS] [CrossRef] [Google Scholar]
- Toshikawa, J., Uchiyama, H., Kashikawa, N., et al. 2018, PASJ, 70, S12 [NASA ADS] [CrossRef] [Google Scholar]
- Wang, T., Elbaz, D., Daddi, E., et al. 2016, ApJ, 828, 56 [NASA ADS] [CrossRef] [Google Scholar]
- Wilkins, S. M., Stanway, E. R., & Bremer, M. N. 2014, MNRAS, 439, 1038 [NASA ADS] [CrossRef] [Google Scholar]
- Wisotzki, L., Bacon, R., Brinchmann, J., et al. 2018, Nature, 562, 229 [Google Scholar]
- Witstok, J., Smit, R., Saxena, A., et al. 2024, A&A, 682, A40 [NASA ADS] [CrossRef] [EDP Sciences] [Google Scholar]
- Witten, C. E. C., Laporte, N., & Katz, H. 2023, ApJ, 944, 61 [NASA ADS] [CrossRef] [Google Scholar]
- Witten, C., Laporte, N., Martin-Alvarez, S., et al. 2024, Nat. Astron., 8, 384 [Google Scholar]
- Yan, H., Wang, L., Ma, Z., & Hu, L. 2023, ApJ, 947, L1 [NASA ADS] [CrossRef] [Google Scholar]
- Zitrin, A., Labbé, I., Belli, S., et al. 2015, ApJ, 810, L12 [Google Scholar]
Appendix A: Tentative detection of CIV in the NE blob
As discussed in Sect. 4, we searched for any other emission line at the same locations as the Lyα blobs detected with NIRSpec/IFU observations. We see a tentative detection of CIVλ1551 emission within the same aperture as the bottom panel of Figure 1. We show the extracted spectrum and the best fit in Figure A.1. The line is detected at 3.2Sect.igma in the Band 2 observations at z= 10.620 (i.e. +420 km s−1 of GN-z11) with a flux of  ergs s−1 cm−2 and a FWHM of
  km s−1.
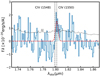 |
Fig. A.1. Tentative detection of CIVλλ1548,1550 at the location of the NW Lyα blob. The dashed red line indicates the best fit to the CIVλ1551 line, and the dotted black lines show the noise spectrum. |
The detection of CIV requires a very hard ionisation field coming, mostly likely, from young high-mass stars. However, this tentative detection needs to be confirmed by the future re-observations of this programme.
All Tables
Measured S/Ns, fluxes, FWHMs, and velocity offsets to the emission lines in GN-z11 for the Lyα emission line extracted from the MSA (Bunker et al. 2023) and the regions defined in Figs. 1 and 3.
All Figures
|
Fig. 1. Overview of the Lyα around GN-z11. Middle left: map of the Lyα emission with dashed red contours representing the 2, 3, 4, and 5σ levels. Middle right: JWST/NIRCam F277W continuum image with the Lyα emission map overlaid as dashed red contours (2, 3, 4, and 5σ levels). The dotted green lines indicate where fewer than 70% of the dither positions cover the area, and the green shading the area covered by fewer than 30% of the dithers. We show extracted spectra from the two Lyα blobs to confirm the Lyα map morphology in the top and bottom panels. The best fit to the emission line is shown as a dashed red line, and the noise is shown as a dotted black line. We highlight the spectral region affected by the data artefact at the edge of the FoV as a grey-shaded region. |
| In the text | |
|
Fig. 2. Comparison of the Lyα halo surface brightness of GN-z11 to the profiles of Lyα halos around star-forming galaxies at z = 5.0–6.0 (red shaded region; Wisotzki et al. 2018) and quasars at z = 5.7–6.6 (yellow and orange shaded region; Farina et al. 2019). For the quasars from Farina et al. (2019) we show the radial surface brightness profiles for the full sample and for only those with detected Lyα halos as yellow and orange regions, respectively. We show two separate definitions of halo size for GN-z11: a smaller halo in the vicinity of the UV continuum (dark blue circle) and the full extent of the asymmetric halo (light blue square). The surface brightness and the extent of GN-z11’s Lyα halo are in agreement with quasars rather than star-forming galaxies at z ∼ 6. |
| In the text | |
|
Fig. 3. Detection of an additional Lyα emitter, 2.1 arcseconds to the east of GN-z11. Top: JWST/NIRCam F277W image corresponding to the FoV of our NIRSpec/IFU observations. We indicate the region from which we extracted the spectrum on the right with dashed blue contours. We also indicate three foreground galaxies visible in the NIRCam image with their corresponding redshifts. Bottom: Extracted Lyα spectrum from the region indicated in the NIRCam image. The dashed red line shows the best fit to the spectrum, and the dotted black line shows the error spectrum. The dashed green line shows the wavelength of Lyα emission seen in the main component of GN-z11. The foreground galaxies in the vicinity show no visible emission lines that would contaminate this spectrum. |
| In the text | |
|
Fig. 4. Evolution of the protocluster dark matter halo mass as a function of redshift. The grey line shows the evolution of a protocluster leading to a Coma-like cluster at z = 0 (Chiang et al. 2013). We extrapolate this evolution to z ∼ 11 assuming no change in the slope from z ∼ 4. The dark matter halo mass of GN-z11 is fully consistent with this evolution. |
| In the text | |
|
Fig. A.1. Tentative detection of CIVλλ1548,1550 at the location of the NW Lyα blob. The dashed red line indicates the best fit to the CIVλ1551 line, and the dotted black lines show the noise spectrum. |
| In the text | |
Current usage metrics show cumulative count of Article Views (full-text article views including HTML views, PDF and ePub downloads, according to the available data) and Abstracts Views on Vision4Press platform.
Data correspond to usage on the plateform after 2015. The current usage metrics is available 48-96 hours after online publication and is updated daily on week days.
Initial download of the metrics may take a while.