Fig. 1.
Download original image
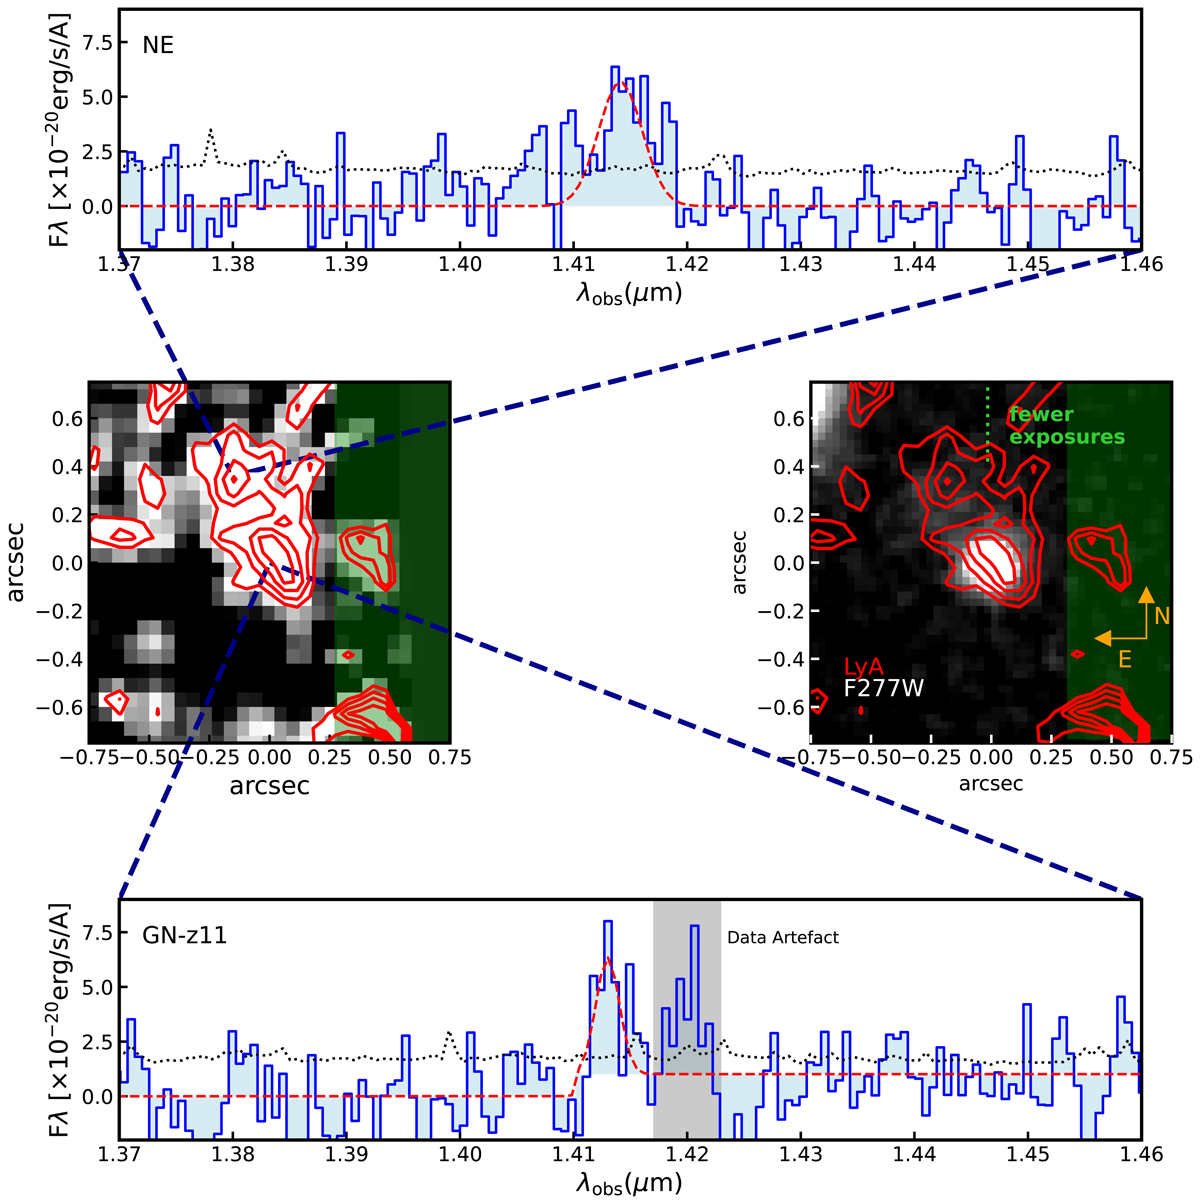
Overview of the Lyα around GN-z11. Middle left: map of the Lyα emission with dashed red contours representing the 2, 3, 4, and 5σ levels. Middle right: JWST/NIRCam F277W continuum image with the Lyα emission map overlaid as dashed red contours (2, 3, 4, and 5σ levels). The dotted green lines indicate where fewer than 70% of the dither positions cover the area, and the green shading the area covered by fewer than 30% of the dithers. We show extracted spectra from the two Lyα blobs to confirm the Lyα map morphology in the top and bottom panels. The best fit to the emission line is shown as a dashed red line, and the noise is shown as a dotted black line. We highlight the spectral region affected by the data artefact at the edge of the FoV as a grey-shaded region.
Current usage metrics show cumulative count of Article Views (full-text article views including HTML views, PDF and ePub downloads, according to the available data) and Abstracts Views on Vision4Press platform.
Data correspond to usage on the plateform after 2015. The current usage metrics is available 48-96 hours after online publication and is updated daily on week days.
Initial download of the metrics may take a while.