| Issue |
A&A
Volume 681, January 2024
|
|
|---|---|---|
| Article Number | A30 | |
| Number of page(s) | 19 | |
| Section | Extragalactic astronomy | |
| DOI | https://doi.org/10.1051/0004-6361/202347411 | |
| Published online | 04 January 2024 | |
Extreme N-emitters at high redshift: Possible signatures of supermassive stars and globular cluster or black hole formation in action
1
Observatoire de Genève, Université de Genève, Chemin Pegasi 51, 1290 Versoix, Switzerland
e-mail: This email address is being protected from spambots. You need JavaScript enabled to view it.
2
CNRS, IRAP, 14 Avenue E. Belin, 31400 Toulouse, France
3
Institut d’Astrophysique de Paris, UMR 7095 CNRS, Sorbonne Université, 98bis, Bd Arago, 75014 Paris, France
4
Bogolyubov Institute for Theoretical Physics, National Academy of Sciences of Ukraine, 14-b Metrolohichna str., Kyiv, 03143
Ukraine
5
The Oskar Klein Centre, Department of Astronomy, Stockholm University, AlbaNova, 10691 Stockholm, Sweden
6
Cosmic Dawn Center (DAWN), Niels Bohr Institute, University of Copenhagen, Jagtvej 128, København N, 2200
Denmark
Received:
9
July
2023
Accepted:
6
October
2023
Abstract
Context. Recent James Webb Space Telescope (JWST) spectroscopic observations of the z = 10.6 galaxy GN-z11 have revealed a very peculiar UV spectrum exhibiting intense emission lines of nitrogen, which are not typically detected in galaxy spectra. This observation indicates a super-solar N/O abundance ratio at low metallicity, which only resembles the abundances seen in globular cluster (GC) stars. This discovery suggests that we might be seeing proto-GCs in formation or possibly even signatures of supermassive stars.
Aims. To examine whether other objects with strong N IV and/or N III emission lines (N-emitters, hereafter) exist and to better understand their origin and nature, we have examined the available JWST spectra and data from the literature.
Methods. Using the NIRSpec/JWST observations from CEERS, we found an extreme N-emitter, CEERS-1019 at z = 8.6782, showing intense N IV] λ1486 and N III] λ1750 emission. From the observed rest-UV and optical lines, we conclude that it is compatible with photoionization from stars and we have determined accurate abundances for C, N, O, and Ne, relative to H. We also (re-)analyzed other N-emitters from the literature, including three lensed objects at z = 2.3 − 3.5 (Sunburst cluster, SMACS2031, and Lynx arc) and a low-redshift compact galaxy, Mrk 996. We carried out a comparison among the observed abundance ratios to observations from normal star-forming galaxies, predicted wind yields from massive stars, and predictions from supermassive stars (SMS with ∼104 − 105M⊙).
Results. For CEERS-1019, we find a highly supersolar ratio log(N/O)= − 0.18 ± 0.11, and abundances of log(C/O)= − 0.75 ± 0.11 and log(Ne/O)= − 0.63 ± 0.07, which are normal compared to other galaxies at the low metallicity (12 + log(O/H) = 7.70 ± 0.18) of this galaxy. The three lensed N-emitters also show strongly enhanced N/O ratios and two of them normal C/O. The high N/O abundances can be reproduced by massive star winds assuming a special timing and essentially no dilution with the ambient interstellar medium (ISM). Alternatively, these N/O ratios can be explained by mixing the ejecta of SMS with comparable amounts of unenriched ISM. Massive star ejecta (from WR stars) are needed to explain the galaxies with enhanced C/O (Lynx arc, Mrk 996). On the other hand, a SMS in the “conveyer-belt model” (put forward to explain globular clusters) would predict a high N/O and small changes in C/O, compatible with CEERS-1019, the Sunburst cluster, SMACS2031, and GN-z11. Based on the chemical abundances, possible enrichment scenarios, and other properties (e.g., their compactness and high ISM density), we discuss which objects could contain proto-GCs. We suggest that this is the case for CEERS-1019, SMACS2031, and the Sunburst cluster. Enrichment in the Lynx arc and Mrk 996 is likely due to normal massive stars (WR), which implies that the star-forming regions in these objects cannot become GCs. Finally, we propose that some N-emitters enriched by SMS could also have formed intermediate mass black holes and we suggest that this might be the case for GN-z11.
Conclusions. Our observations and analysis reinforce the suggested link between some N-emitters and proto-GC formation, which is supported both by empirical evidence and quantitative models. Furthermore, the observations provide possible evidence for the presence of supermassive stars in the early Universe (z > 8) and at z ∼ 2 − 3. Our analysis also suggests that the origin and nature of the N-emitters is diverse, including objects such as GN-z11, which may possibly host an active galactic nucleus (AGN).
Key words: galaxies: high-redshift / galaxies: ISM / galaxies: clusters: general / quasars: supermassive black holes / dark ages / reionization / first stars
© The Authors 2024
 Open Access article, published by EDP Sciences, under the terms of the Creative Commons Attribution License (https://creativecommons.org/licenses/by/4.0), which permits unrestricted use, distribution, and reproduction in any medium, provided the original work is properly cited.
This article is published in open access under the Subscribe to Open model. This email address is being protected from spambots. You need JavaScript enabled to view it. to support open access publication.
1. Introduction
Known as the most distant, spectroscopically confirmed galaxy in recent years (Oesch et al. 2016), studies of GN-z11 have led to new exciting and intriguing results, since the first spectra of this galaxy were obtained with the JWST. Indeed, the JWST/NIRSpec observations of Bunker et al. (2023) confirmed a very high redshift for this source (z = 10.60) and revealed the presence of hydrogen, carbon, oxygen, magnesium, and neon emission lines in the rest-UV and rest-optical spectrum, which are often seen in star-forming galaxies at low-redshift and detected at z ∼ 4 − 8 in other JWST spectra (see e.g., Schaerer et al. 2022; Cameron et al. 2023b; Nakajima et al. 2023; Tang et al. 2023). Most surprisingly, however, the spectrum of GN-z11 has revealed the presence of strong N III] λ1750 and N IV] λ1486 lines (Bunker et al. 2023), which are very rarely detected in galaxies (see e.g., Barchiesi et al. 2023). Furthermore, the object was found to be very compact (Tacchella et al. 2023), which could indicate the presence of massive compact star clusters or point to an active galactic nucleus (AGN; Bunker et al. 2023; Tacchella et al. 2023; Charbonnel et al. 2023; Maiolino et al. 2023).
The discovery of the peculiar emission line spectrum has triggered a series of papers discussing their origin and the nature of GN-z11, in particular. Bunker et al. (2023) first suggested that the strong N emission lines may imply an unusually high N/O abundance. They also discussed whether the emission would be powered by star formation or photoionization from an AGN, without reaching clear conclusions on this issue. The quantitative analysis of the emission line spectrum of GN-z11 by Cameron et al. (2023a) confirmed the high N/O abundance, with a lower limit of four times solar, also finding possibly a less extreme C/O ratio, and a metallicity (O/H), which is sub-solar, although not well constrained. Using a suite of photoionization models, Senchyna et al. (2023) inferred the N/O abundance with a lower uncertainty and constrained the metallicity to  , confirming, in particular, a large overabundance of N/O ≈ 3 × solar.
The finding of an exceptionally high N/O abundance at low metallicity (typically ten times the normal N/O value at this O/H) has triggered different speculations about the sources and processes explaining this enrichment. The scenarios discussed include enrichment from massive stars winds (WR stars) or AGB stars, that is, relatively “classical scenarios” or more “exotic” assumptions such as pollution from PopIII star formation, tidal disruption of stars from encounters with black holes, ejecta from very massive stars formed through collisions in dense clusters, and supermassive stars (see Cameron et al. 2023a; Watanabe et al. 2023; Senchyna et al. 2023; Charbonnel et al. 2023; Nagele & Umeda 2023). Supermassive stars, for example, have been invoked by Charbonnel et al. (2023) and Nagele & Umeda (2023) since very strong enrichment of N and low metallicity is difficult to explain and requires fairly fined-tuned conditions with classical scenarios (see also Cameron et al. 2023a; Watanabe et al. 2023). Furthermore, such stars (with masses M⋆ ≳ 1000 M⊙) have been proposed to form by runaway collisions in very dense stellar clusters and they could explain the long-standing problem of multiple stellar populations and peculiar abundance patterns observed in globular clusters (GC), as discussed by Gieles et al. (2018) and Denissenkov & Hartwick (2014). If correct, this would probably represent the first observational evidence of supermassive stars, which are also of great interest, for example, for understanding the seeds of supermassive black holes (e.g., Portegies Zwart & McMillan 2002; Woods et al. 2019; Trinca et al. 2023, and references therein).
Abundance ratios are not the only properties observed in GN-z11 that resemble those of GCs. Its compactness and high density for the interstellar medium (ISM) also indicate conditions expected in young very massive clusters, which could be proto-GCs (Senchyna et al. 2023; Charbonnel et al. 2023). GN-z11 might also be the first high-redshift object, where the long sought-for peculiar abundance patterns characterizing GCs are observed (e.g., Renzini 2017; Gratton et al. 2019, and references therein). These exciting and surprising findings put forward questions regarding the uniqueness of GN-z11, thereby calling for more examples and for a better understanding of similar objects – if they do indeed exist.
Although they are very rare, other galaxies showing emission lines of N III] λ1750 or N IV] λ1486 in the UV (referred to as N-emitters subsequently) are known, as pointed out by Senchyna et al. (2023) and found in the compilation of Barchiesi et al. (2023). Apart from objects that have clearly been identified as AGN, we have the Lynx arc (a lensed z = 3.36 galaxy identified with N IV] λ1486 and He IIλ1640 emission), which is probably the first N-emitter that has been studied in detail (Fosbury et al. 2003; Villar-Martín et al. 2004). From their photoionization modeling, Villar-Martín et al. (2004) derived a high N/O ratio and sub-solar metallicity. The multiply imaged compact star cluster in the Sunburst arc is another strongly lensed object at z = 2.37, which has been extensively studied in recent years (e.g. Rivera-Thorsen et al. 2019; Vanzella et al. 2022). It shows N III] λ1750 emission, as displayed in the high S/N spectrum of Meštrić et al. (2022). Pascale et al. (2023) have shown that N/O is also elevated (∼4× solar) at a metallicity ∼1/5 solar. Finally, in the low-redshift Universe, Mrk 996 uniquely stands out as the only galaxy showing strong N III] λ1750 emission in the UV (see Mingozzi et al. 2022) and this blue compact dwarf galaxy has long been known to be very peculiar; it has demonstrated, for instance, a high electron density, the presence of strong emission lines from WR stars in the optical, and a high N/O abundance, at least in its core (e.g., Thuan et al. 1996; James et al. 2009; Telles et al. 2014).
Here, we present a detailed analysis of the z = 8.68 galaxy CEERS-1019 observed with NIRSpec/JWST by the public CEERS survey (Finkelstein et al. 2017). This object was previously studied by several authors (Tang et al. 2023; Nakajima et al. 2023; Larson et al. 2023), but none of these have analyzed the carbon and nitrogen abundance and its rest-UV spectrum. Only very recently, Isobe et al. (2023) have analyzed the UV spectrum in detail. Similarly to GN-z11, this galaxy exhibits a very peculiar rest-UV spectrum, making it clearly an N-emitter. Displaying numerous emission lines of H, C, N, O, and Ne, as well as the auroral [O III]λ4363 line, it allows us to accurately determine the chemical abundances of these elements and thus offers a unique opportunity to study the second N-emitter in the early Universe and to enlarge the sample of these rare objects. We also analyze the other known N-emitters and compare their properties to those of CEERS-1019 and GN-z11. Finally, we confront the observed abundance patterns with predictions from normal massive stars and with predicted enrichment patterns from supermassive stars.
The paper is structured as follows. In Sect. 2, we describe the observational data, reduction, and measurements used in this work. We then discuss the nature of the ionizing source of CEERS-1019 (Sect. 3). The chemical abundances and other physical properties of CEERS-1019 are derived in Sect. 4. In Sect. 5, we compare the abundance ratios of CEERS-1019 to other N-emitters and normal star-forming galaxies and we present different chemical enrichment scenarios to explain them. We also discuss the possible link between CEERS-1019 and proto-GCs. The main results of our work are summarized in Sect. 6. Throughout this work, we assume a concordance cosmology with Ωm = 0.274, ΩΛ = 0.726, and H0 = 70 km s−1 Mpc−1.
2. CEERS-1019: A new strong N-emitter at high redshift
CEERS-1019 (α, δ [J2000] = 215.0354°, 52.8907°) was initially identified as a zphot ≃ 8.6 dropout galaxy by Roberts-Borsani et al. (2016) and spectroscopically confirmed at zspec = 8.683 by Zitrin et al. (2015) through strong Lyα emission (see also Mainali et al. 2018 and Witten et al. 2023). It is one of the most distant Lyα emitter known and is thought to reside in an over-dense region and ionized bubble boosting substantially its Lyα transmission (Larson et al. 2022; Leonova et al. 2022; Whitler et al. 2023). Mainali et al. (2018) also report a tentative detection of N V λ1240 (4.6σ), suggesting a hard ionizing spectrum of this source.
Recently, a much deeper spectroscopy survey of CEERS-1019 was reported and analyzed by Tang et al. (2023), Nakajima et al. (2023), and Larson et al. (2023) using NIRSpec, along with NIRCam and MIRI imaging. Although with some discrepancies, these works derived important physical properties of CEERS-1019 such as its stellar mass (log(M⋆/M⊙ ≃ 8.7 − 10.1), gas-phase metallicities (12 + log(O/H) ≃ 7.6 − 8.0), ionizing indicators (e.g., O32 ≃ 13 − 18), among others. Interestingly, Larson et al. (2023) reported a tentative (2.5σ) detection of a broad component in Hβ that could be related to AGN activity (the presence of an AGN will be further discussed in Sect. 3). Here, we re-analyze the available JWST data of CEERS-1019.
2.1. JWST NIRSpec and NIRCam observations
JWST/NIRSpec spectra are available for CEERS-1019 as part of the Cosmic Evolution Early Release Science (CEERS1; Finkelstein et al. 2023) program. These observations include both low-resolution PRISM and medium-resolution grating (G140M/F100LP, G235M/F170LP, and G395M/F290LP), providing spectral resolution of R ≃ 100 and R ≃ 1000, respectively, and a spectral coverage ≃1 − 5 μm. Standard three-shutter slits and a three-point nodding pattern were used. The total exposure time for each medium-resolution grating was 3107 s, split into three individual exposures of 14 groups each. Deeper observations were obtained with the low-resolution PRISM, with a total exposure time of 6214 s. Both PRISM and medium-resolution observations were obtained with an aperture position angle PA ≃ 89.32 deg (see Fig. 1).
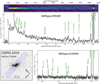 |
Fig. 1. Overview of the JWST observations of CEERS-1019 at z = 8.6782. Top: 1D and 2D low-resolution NIRSpec/PRISM spectra (black) and 1σ uncertainty (grey). Vertical dashed lines (green) mark the position of well-detected nebular emission lines. The X-axis in the bottom and top panels refer to the observed (μm) and rest-frame wavelengths (Å), respectively. Bottom right: NIRSpec/G395M medium-resolution spectrum of CEERS-1019. Bottom left: JWST NIRCam cutout of CEERS-1019 in the F200W filter. CEERS-1019 is composed of three resolved clumps. The inferred positions of the NIRSpec MSA shutters are overlaid in blue. |
Data reduction was performed using the official JWST pipeline2 for Level 1 data products and MSAEXP3 for Levels 2 and 3. The bias and dark current were subtracted, followed by the correction of the 1/f noise and the “snowball” events. We used the calibration reference data system (CRDS) context JWST_1063.PMAP to correct spectra for flat-field and implemented the wavelength and photometric calibrations. The 2D spectra of each slitlet were then drizzle-combined and the background was subtracted following the three-shutter dither pattern. Finally, 1D spectra were extracted using the inverse-variance weighted kernel following Horne (1986). Figure 1 shows the NIRSpec spectra of CEERS-1019.
CEERS-1019 was also observed with JWST/NIRCam with the F115W, F150W, F200W, F277W, F356W, F410M, and F444W filters with exposure times of ∼3000 s (Finkelstein et al. 2023). NIRCam images were reduced using the GRIZLI reduction pipeline (Brammer 2023), which includes procedures for masking the “snowball” artifacts and minimizing the impact of 1/f noise. The photometry of CEERS-1019 was performed using SExtractor (Bertin & Arnouts 1996) in dual mode. For each NIRCam filter, we used the point-spread functions (PSFs) provided by G. Brammer within the GRIZLI PSF library4 which are based on models from webbpsf (Perrin et al. 2014). Images were then PSF-matched to F444W, which has the largest PSF within the NIRCam filters. We measured the flux of CEERS-1019 in each filter using a circular aperture of 0.16″ radius (4 pix) and applied an aperture correction derived in F444W using the “FLUX_AUTO” measured in a Kron-like aperture with default Kron parameters. Then, we scaled all fluxes to total fluxes based on the encircled energy of the circularized Kron aperture on the F444W PSF from webbpsf (see Weibel et al., in prep. for more details). As shown in the bottom left panel of Fig. 1, CEERS-1019 shows a complex morphology with three compact clumps.
2.2. Emission line measurements
As shown in Fig. 1, CEERS-1019 presents intense nebular emission in the rest-frame UV and optical. As a first step, we determined the systemic redshift of CEERS-1019 using well-detected (≥10σ) and uncontaminated (i.e., not blended) emission lines detected in the G395M spectrum. Using the centroids of [Ne III] λ3869, γ, Hβ, and [O III] λλ4959,5007, we derive the mean value and scatter of zsys = 8.6782 ± 0.0006.
Several rest-frame UV lines were detected with high significance (≥5σ) in the deep PRISM spectrum (Figs. 1 and 2), such as N IV] λ14865, C IVλ1550, O III] λ1666, and C III] λ1909. This stands in contrast to the shallower medium-resolution G140M spectrum that shows only Lyα and N IV] at ≥3σ. Thus we use the much higher signal-to-noise ratio (S/N) PRISM spectrum to measure the fluxes of the rest-frame UV lines. We simultaneously fit several Gaussian profiles to account for the emission of N IV], C IV, O III], N III], and C III], and a power law taking the form of fλ ∝ λβ to fit the continuum level between 1.3 − 2.1 μm (λ0 ≃ 1300 − 2200 Å). Figure 2 shows the results of the fit and the corresponding residuals. Since these lines are not resolved in the PRISM spectrum6, we fixed the line widths of each line to the expected instrumental resolution at their corresponding wavelengths (R ≃ 30 − 45)7. We repeated the fit 500 times while bootstrapping the spectrum according to its 1σ error and considered the standard deviation of each parameter as its 1σ uncertainty. Table 1 summarizes our flux measurements. Along with Lyα, N IV] is found to be the strongest emission line in the rest-UV, stronger than C IV and C III] by a factor ≃1.8 and ≃1.5, respectively. We also infer a steep UV slope of  from the spectrum, which is consistent with the photometric one (
 ) using the apparent magnitudes in the F150W and F200W filters (F150W = 25.25 ± 0.08 and F200W = 25.29 ± 0.07).
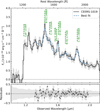 |
Fig. 2. Zoom-in to the rest-frame UV part of the PRISM spectrum of CEERS-1019 (black and 1σ uncertainty in grey). Vertical dashed lines (green) mark the position of nebular emission lines. The blue line is the best fit for several UV emission lines and continuum. The bottom panel shows the residuals (in the same units as the spectrum) as well as the 1σ uncertainties (grey). |
Flux measurements of CEERS-1019.
Flux measurements of rest-optical lines were obtained using the G395M spectrum, which presents a similar depth as the PRISM spectrum but with a much higher resolution. Optical lines were fitted separately over relatively narrow spectral windows (100 Å, rest-frame) and a constant is assumed for the continuum level. The width of the lines is set as a free parameter. In total, we detect up to ten optical emission lines with high significance (Table 1), including Balmer lines that are useful for the determination of dust attenuation.
To account for wavelength-dependent slit losses and absolute flux calibration, we derived the synthetic photometry of NIRSpec spectra (PRISM and gratings) through each NIRCam filter bandpass and matched it to that obtained from observed photometry. In this process, we used a wavelength-dependent polynomial function yielding scaling factors for the slit-loss correction ranging from approximately 2.0 (F150W) to 3.6 (F444W).
Using fluxes and equivalent widths of the detected Balmer lines Hβ, γ, and Hδ, we iteratively derive the dust attenuation E(B − V)=0.12 ± 0.11 using the Reddy et al. (2016) attenuation curve and following the methodology of Izotov et al. (1994), which accounts for the internal extinction and underlying hydrogen stellar absorption. Other important lines, such as those that are sensitive to the electron temperature (Te, [O III]λ4363) and density (ne, N IV] λλ1483, 1486 and [O II]λλ3727, 3729) were also detected and are analyzed in more detail in Sect. 4. For the N IV] and [O II] doublets we fit two Gaussian profiles with similar widths and used the expected separation between the two transitions. We found line ratios of F1483/F1486 = 0.50 ± 0.22 and F3727/F3729 = 0.98 ± 0.27 for the N IV] and [O II] doublets, respectively.
We also checked for the presence of spectral features that are usually associated with Wolf-Rayet (WR) stars. The so-called blue bump around 4600–4700 Å, encompassing the emission from N IIIλ4640, C IIIλ4650, and He IIλ4686, was not detected in the G395M, nor the PRISM spectra. We derived a 3σ upper limit relative to Hβ of He II/Hβ ≤ 0.26. Similarly, the rest-UV He IIλ1640 line was not detected. Despite its low resolution, the PRISM spectrum clearly suggests no emission at the expected position of He II, while the close O III] emission has been aptly detected (see Fig. 2).
3. The nature of the ionizing source: Star formation versus AGN activity
We go on to discuss the nature of the ionizing source of CEERS-1019, building upon the recent findings by Mainali et al. (2018) and Larson et al. (2023), who suggested possible AGN activity. In their study, Mainali et al. (2018) reported the detection of N Vλ1242 emission with an integrated flux of (2.8 ± 0.6) × 10−18 erg s−1 cm−2 with a narrow profile FWHM < 90 km s−1 (unresolved in the MOSFIRE spectrum). However, the G140M spectrum does not exhibit any significant emission around the expected position of N Vλλ1238, 1242 (Fig. 3, top left). By considering the flux uncertainty around 1.2 μm from the G140M error spectrum and assuming an unresolved line width of FWHM = 352 km s−1, we inferred a 3σ limit of 1.44 × 10⁻¹⁸ erg s−1 cm−2. This limit stands well below the reported value of Mainali et al. (2018). Furthermore, according to Morton (1991), N Vλ1238 is expected to be twice as strong as N Vλ1242 under standard conditions. Hence, considering the reported flux of Mainali et al. (2018) for N Vλ1242, we would expect 11.6σ and 5.8σ detections for N Vλ1238 and λ1242, respectively. These limits, however, are incompatible with our observations.
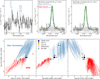 |
Fig. 3. Star formation and AGN diagnostics. The top left panel shows the G140M spectrum of CEERS-1019 (in black and 1σ uncertainty in grey) around the expected positions of N Vλλ1238, 1242 (marked with vertical lines), which are not detected (1.44 × 10⁻¹⁸ erg s−1 cm−2 at 3σ). Lyα emission is also marked. The top middle and right panels show the best fits (green) to the Hβ emission line using dual-component (middle, narrow and broad components in blue and red, respectively) and single-component (right) Gaussian profiles. The bottom panels show star formation (blue) and AGN (red) photoionization models using several rest-frame UV lines. The position of CEERS-1019 (dark blue circle) aligns with the predictions of star-forming models in all diagnostic diagrams. The location of other known star-forming galaxies with strong nitrogen emission, GN-z11 (Bunker et al. 2023), the Lynx arc (Villar-Martín et al. 2004), SMACS2031 (Patrício et al. 2016), and Mrk 996 (Mingozzi et al. 2022) are also marked with different symbols as indicated in the legend. |
Larson et al. (2023) reported a 2.5σ detection of a broad (≃1200 km s−1) component in Hβ using the medium-resolution NIRSpec G395M spectrum. This broad component is not seen in stronger, forbidden lines like [O III] λλ4960, 5008, from which they have suggested conditions similar to the broad line region (BLR) of an AGN. Using our own reduction of the G395M spectrum and a dual-component Gaussian profile to Hβ, we found a 2.2σ detection for the broad component (Fig. 3, top middle). Clearly, deeper observations of Hβ (or Hα with MIRI) are needed to unambiguously confirm the presence and nature of the broad component in Hβ, as already discussed and suggested by Larson et al. (2023). Indeed, if a single Gaussian profile is used to fit the Hβ profile, a good fit is also found without penalizing significantly the residuals (Fig. 3, top-right). In this case, we find FWHM(Hβ)=452 ± 68 km s−1, which differs only by 1.2σ from the nominal FWHM = 369 ± 16 km s−1 obtained for the much brighter [O III] λ5008 line.
If the existence of this broad component can be confirmed and attributed to the BRL, it would be expected that high-ionization semi-forbidden lines such as N IV], C IV, or C III], which probe high-density regimes (ncrit ≳ 109 cm−3), would display similar broad Doppler widths as observed in type-1 AGNs (e.g., Pâris et al. 2011). However, these lines appear narrow in CEERS-1019, especially N IV] which exhibits a high-significance detection and an intrinsic FWHM ≃ 160 km s−1 after correcting for instrumental broadening. Thus, our results suggest that the aforementioned semi-forbidden lines are unlikely to originate from the broad line region. Instead, the properties of these lines, such as the narrow widths and the N IV] line ratio F1483/F1486 = 0.50 ± 0.22 (implying densities ne ≈ 104 − 5 cm−3, see Sect. 4.3), are consistent with narrow line regions of AGN or H II regions. In the following, we discuss these two scenarios.
The lower panels of Fig. 3 present several diagnostic diagrams using different UV nebular lines: C III]/He II versus C IV/He II, [O III]/He II, and N V/N IV]. Photoionization models of star-forming galaxies from Gutkin et al. (2016) and narrow-line regions of AGN from Feltre et al. (2016) are shown in blue and red, respectively. In the right panel of Fig. 3 we show models of star-forming galaxies from the updated BOND grid using Cloudy (Ferland et al. 2017), which also includes N IV] and is available from the 3MdB8 (Morisset et al. 2015). These models encompass a wide range of parameters, including the ionizing parameter (−4.0 ≤ log U ≤ −1.0), hydrogen number density (102 ≤ nH/cm3 ≤ 104), and the power law index of the ionizing spectrum (−2.0 ≤ α ≤ −1.2). We selected models with metallicities within the range of 0.05 ≤ Z/Z⊙ ≤ 0.20, which corresponds to the inferred metallicity for CEERS-1019 (12+log(O/H) = 7.70 ± 0.18, as indicated in Table 2). As illustrated in this figure, the position of CEERS-1019 (indicated by the blue circle) aligns with the predictions of star-forming models in all diagnostic diagrams. Clearly, the absence of He II and N V, which probe energies > 54 eV and > 77 eV, respectively, places CEERS-1019 far away from the region occupied by AGN models. It is worth noting that Isobe et al. (2023) suggested recently that the high N IV]/N III] ratio observed in CEERS-1019 is hardly reproduced by star formation models, pointing to an AGN contribution. However, the 3MdB photoionization models used here do predict very high ratios even well above the observed N IV]/N III] = 5.1 ± 2.2, although requiring fairly high ionization parameters (log(U)≳ − 2).
ISM properties, ionic, and total heavy element abundances.
Other spectral features observed in CEERS-1019, such as the intense N IV] emission compared to other UV lines (N IV]/C IV ≃ 1.8, N IV]/C III] ≃ 1.5, N IV]/N V ≥2.6) and narrow profiles (FWHM ≃ 160 km s−1 for N IV]) differ from those observed in AGNs, even those showing unusually strong nitrogen lines (e.g., Bentz et al. 2004; Jiang et al. 2008). The so-called nitrogen-loud QSOs exhibit much weaker N IV] compared to other lines (e.g., N IV]/C IV ≃ 0.02 − 0.38, Batra & Baldwin 2014, Dhanda et al. 2007) and, as expected, they present very broad Doppler widths (FWHM ≃ 1500 − 6000 km s−1, Jiang et al. 2008). Similarly, some type 2 AGNs also present N IV] emission (e.g., Hainline et al. 2011; Alexandroff et al. 2013), but notably weaker compared to other high-ionization lines (N IV]/C IV ≃ 0.15, N IV]/C III] ≃ 0.34, or N IV]/N V ≃ 0.30; Hainline et al. 2011). An exception may be GS-14, a type 1.8 AGN at z ≃ 5.55 recently analyzed by Übler et al. (2023). GS-14 exhibits broad components in Hydrogen and Helium lines (FWHM ≃ 3400 km s−1, Übler et al. 2023) as well as narrow N IV] emission (FWHM ≃ 430 km s−1, Vanzella et al. 2010, Barchiesi et al. 2023), but it also shows clear nebular emission in N Vλ1240 and O VIλ1033 (Grazian et al. 2020; Barchiesi et al. 2023) which are not detected in CEERS-1019.
In contrast, the spectrum of CEERS-1019 resembles those of other, yet also rare star-forming galaxies with intense emission in nitrogen lines. Examples such as the Lynx arc (Fosbury et al. 2003; Villar-Martín et al. 2004), SMACS-2031 (Christensen et al. 2012; Patrício et al. 2016), Mrk 996 (James et al. 2009; Mingozzi et al. 2022), and the Sunburst cluster show narrow and prominent N IV] and/or [N III] lines suggestive of high electron temperatures and densities such as CEERS-1019 (see Sect. 4) and without any hint of AGN activity. The bottom panels of Fig. 3 also show the location of these strong N-emitters, all consistent with star-forming models like CEERS-1019. The case of GN-z11, another strong N-emitter reported by Bunker et al. (2023), appears to be ambiguous, consistent with both models of AGN and star formation, as already discussed in Bunker et al. (2023) and Maiolino et al. (2023). In conclusion, our results suggest that regardless of the presence of an AGN whose confirmation awaits deeper data, the high-ionization lines observed in CEERS-1019 are consistent with stellar photoionization.
4. Observational and derived physical properties of CEERS-1019
4.1. ISM properties and element abundances
The rich set of emission lines detected from the rest-frame UV-to-optical spectrum allows us to determine the electron temperature and density in the gas and the detailed abundances of numerous elements including H, C, N, O, and Ne. The derived quantities are summarized in Table 2.
4.2. Electron temperature
To derive physical conditions and element abundances, we followed the prescriptions of Izotov et al. (2006). In brief, these authors adopt the classical three-zone model of the H II region with electron temperatures Te(O III) for the high-ionization zone and Te(O II) for the low-ionization zone. The intermediate-ionization zone is not used here, since no such lines are detected.
The electron temperature Te(O III) was derived both from the ratio of [O III] line fluxes λ4363/λ(4959+5007) and from the UV-to-optical line ratio of λ1660/λ5007. The former ratio (rest-optical) was determined from the medium-resolution spectrum, the latter from the PRISM spectrum. In both cases, we obtained Te ≈ 18 000 K, consistent within 1σ, and with uncertainties between 1151 and 3252 K. Subsequently, we adopted the electron temperature from the optical line ratios (Te = 18849 ± 3252 K) with the larger uncertainty, which is primarily due to the low-S/N detection of [O III]λ4363. The electron temperature in the low-ionization region is derived from relations obtained from the photoionization models of Izotov et al. (2006).
4.3. Electron density
Several density indicators exist in the observed spectral range, but only a few can be applied in practice in this context. In the UV, the C III] λ1909, Si III] λ1883,1892, and N IV] λ1486 doublets are density estimators. However, the PRISM spectrum is of insufficient resolution to resolve any of these doublet lines. Si III] λ1883,1892 is not detected, and C III] λ1909 has too low an S/N value in the medium-resolution spectrum. While it is of fairly low S/N, the N IV] λ1486 doublet is detected with a ratio of λ1483/λ1487 =0.50 ± 0.22, which indicates a fairly high electron density of ne ≈ 104 − 5 cm−3 (Kewley et al. 2019). In the optical, the [O II] λ3727 doublet is clearly detected, but not resolved from the medium-resolution spectra. Our measured line ratio λ3727/λ3729 =0.98 ± 0.23 is consistent within the uncertainties with that obtained by Larson et al. (2023; 0.639 ± 0.255), and compatible with ne > 103 cm−3 (Kewley et al. 2019).
The two density estimates could indicate a density gradient between the low and high ionization regions, but are also compatible with a single, relatively high density of ne ≈ 104 − 5 cm−3, whose origin we discuss below. In any case, the most important point to take away from this is that the electron density, although high, is lower than the critical densities of all the relevant emission lines used for the subsequent abundance determinations. This holds for the (semi-)forbidden lines of [O III] at 1666, 4363, 4959, 5007 (with critical densities of ncrit ≥ 6.9 × 105 cm−3), the two components of the C III] λ1909 doublet (ncrit = 8.7 × 104 cm−3 for 1907 and 109 cm−3 for 1909), C IVλ1550 (ncrit = 2 × 1015 cm−3), N III] λ1750 (a multiplet made up of components with ncrit ≥ 109 cm−3), N IV] λ1486 (ncrit = 3 × 109 cm−3), and [Ne III] λ3869 (ncrit = 1 × 108 cm−3). For more details, we refer to, e.g., Hamann et al. (2002) and Dere et al. (2019). Only the [O II] λ3727 doublet, whose components have relatively low critical densities of ncrit = 1(4) × 103 cm−3 for 3728 (3726), is therefore affected by the high density inferred for CEERS-1019, whereas all other lines can safely be used to determine abundances, to which we now proceed (Fig. 4).
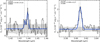 |
Fig. 4. Best fit (blue) of density-sensitive emission lines, N IV] λλ1483, 1486 (left) and [O II] λλ3727, 3729 (right), using G140M and G395M medium-resolution spectra (black and 1σ uncertainty in grey), respectively. The fit uses two Gaussian profiles with similar widths and the expected position and separation between the two transitions (vertical lines). |
4.4. Ionic and total metal abundances
The electron temperature Te(O III) was used to obtain the abundances of ions O2+, N3+, N2+, C3+, C2+, and Ne2+, along with the temperature in the low-ionization region, Te(O II), to derive the ionic abundance of O+. Ionic abundances were derived following Izotov et al. (2006) for the optical lines and comparing different methods for the UV lines. For C, N, and O, the observations provide two ionization stages, so that the ionic abundances would be close to the total abundances and we neglected further ionization corrections. For Ne2+, we used the ionization correction factor (ICF) following Izotov et al. (2006). The results are listed in Table 2.
We derived a total oxygen abundance of 12 + log(O/H) = 7.70 ± 0.18, which is dominated by the ionic abundance of O2+/H+ (see Table 2). Given the high density, [O II] λ3727 could be decreased and, thus, the O+/H+ abundance underestimated. However, in view of the high excitation observed from lines with high critical densities, it is likely that O2+ is the dominant ionization stage over the majority of the HII region; hence, the determination of O/H is close to the correct value.
With the available line detections the N/O abundance can be determined in different ways. First, we used only the UV lines to compute the ionic abundance ratio (N2++N3+)/O2+ using the expressions from Villar-Martín et al. (2004, hereafter V+04) and Hamann et al. (2002, hereafter H+02), assuming the low-density regime. Then we determine N/H from the UV and optical line ratio (N and Hβ) and use O/H determined from the optical lines. Both methods, marked as “UV only” and “UV+opt”, respectively, yield values compatible with the errors, and consistent with a high N/O abundance log(N/O) ≈ −0.15 ± 0.17.
Similarly, for C/O we use the expressions from Villar-Martín et al. (2004), Pérez-Montero & Amorín (2017, hereafter PM17), and Izotov et al. (2023, hereafter I+23) using either only the rest-UV or a combination of the UV and optical lines. As seen from Table 2, the ionic abundance ratios derived in this manner are compatible within uncertainties. For the total C/O abundance, we adopted log(C/O)= − 0.75 ± 0.11 as our default value. The C/O ratio is therefore clearly subsolar, and in fact very similar to the average of normal star-forming galaxies at the same O/H (see below).
Finally, we also derive the Neon abundance from the [Ne III] λ3869 and Hβ lines and apply an ICF from the oxygen lines, following Izotov et al. (2006). We find an abundance ratio of log(Ne/O)= − 0.63 ± 0.07, somewhat higher than the average value of log(Ne/O)= − 0.78 ± 0.01 determined for normal star-forming galaxies by Guseva et al. (2011) at the same metallicity.
Although the abundances derived here assume low densities they are not altered by density effects at the density derived for CEERS-1019, as already discussed above. Most importantly, the critical densities for the N III] λ1750, N IV] λ1486, and O III] λ1666 lines involved in the (N2++N3+)/O2+ ratio derived from the UV are all very high (ncrit > 109 cm−3), which further shows that this important ionic abundance ratio can be determined accurately.
Taken together, the derived abundances of CEERS-1019 show that this object has a “metallicity” (O/H) of approximately 1/10 solar (assuming a solar value of 12 + log(O/H) = 8.69; Asplund et al. 2009, 2021), an exceptionally high N/O abundance, and a normal C/O abundance, when compared to galaxies of similar metallicity (see Fig. 6). The interpretation of these abundances and implications will be discussed below (Sect. 5).
4.5. Comparison with other studies and caveats
The ISM properties and abundances of CEERS-1019 have been determined in several other studies. We use those findings below to make a comparison with our results.
Larson et al. (2023) have argued that the [O II] λ3727 doublet can be deblended, from which they inferred an electron density of ne = (1.9 ± 0.2) × 103 cm−3. From inspection of the C III] λ1909 doublet, they suggested that the density could be higher than ne > 104 cm−3. The density inferred here from the N IV] λ1486 doublet (ne ≈ 104 − 105 cm−3) is compatible with their finding. Most importantly, for the abundance determinations, all available density estimates indicate that the main emission lines should not be affected by density effects.
From their 3-σ detection of [O III]λ4363Larson et al. (2023) inferred Te = 18630 ± 3682 K, in excellent agreement with our determination. Based on the Te determination they infer 12 + log(O/H) = 7.664 ± 0.508 from an average relation between Te and O/H determined empirically by Pérez-Montero & Amorín (2017). Tang et al. (2023) determined  using the direct method. Within the quoted uncertainties, our results agree with both of these determinations. A slightly higher O/H abundance (12 + log(O/H) = 7.97 ± 0.16), but still compatible with the uncertainties, has been derived by Nakajima et al. (2023) using a less accurate R23 strong-line calibration. Finally, assuming AGN models, Isobe et al. (2023) have obtained a higher metallicity for CEERS-1019, but similar N/O, C/O, and Ne/O ratios (as derived here).
We note also that the abundance ratios determined here assume a homogeneous medium both in abundance and density. If pockets of high density and enriched gas coexist with lower density gas with say normal abundance ratios, only a relatively small fraction of enriched gas (i.e., relatively low amounts of nitrogen) might suffice to explain the observed emission line ratios since the emissivity of the forbidden line depends on the density (see, e.g., Izotov et al. 2006). However, in this case the inferred N/O abundance would also be a lower limit of the true N/O ratio in the enriched pocket.
4.6. Other physical properties
4.6.1. Morphology
As shown in the left panel of Fig. 5, CEERS-1019 shows a complex morphology in the NIRCam bands consistent with three different clumps (or structures) separated by ≃0.24″, or ≃1.12 kpc at z = 8.678 (4.68″ kpc−1). These clumps, labeled as A, B, and C as indicated in Fig. 5, are very compact and only resolved in the NIRCam bands at short wavelengths.
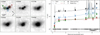 |
Fig. 5. Multi-wavelength analysis of CEERS-1019. The left panel shows cutout images around CEERS-1019 in the NIRCam filters. In the F150W sub-panel, we show the positions of the three compact clumps resolved only at short wavelength, labeled A, B, and C (blue, green, and red, respectively) The right panel shows the SED best-fit models using CIGALE (Boquien et al. 2019) of the integrated light of CEERS-1019 (“total” in black), as well as the individual clumps (A, B, and C in blue, green, and red, respectively). Observed fluxes are marked with circles, while the predicted fluxes from the best fit are marked with crosses. |
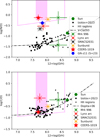 |
Fig. 6. Observed chemical abundances of the six N-emitters and comparison samples from the literature. Top: N/O versus O/H. Bottom: C/O versus O/H. CEERS-1019 is shown by a red star, GN-z11 by a blue circle. The z ∼ 2.6 − 3 lensed galaxies: Lynx arc, SMACS2023, and the Sunburst cluster are shown with red, black, and orange crosses, the low-z galaxy Mrk 996 is marked with a green cross (two N/O values from James et al. 2009 for the central region and from the total galaxy). The magenta shaded region and outlined box indicate the range of abundances allowed for GN-z11, according to Cameron et al. (2023a). Low-z star-forming galaxies and HII regions from the compilation of Izotov et al. (2023) are shown by small black symbols. The dash-dotted line shows the average trend observed in low-z star-forming galaxies, as parametrized by Vila-Costas & Edmunds (1993) for N/O and C/O by Dopita et al. (2006), respectively. |
To investigate the morphology of CEERS-1019 in more detail, we modeled the three galaxy substructures, accurately following the methodology applied to the study of stellar clumps in Messa et al. (2022) and Claeyssens et al. (2023). Assuming that clumps have Gaussian profiles, we considered a 15 × 15 pixel region centered on the galaxy and we fit a model consisting of three 2D Gaussian functions, convolved to the NIRCam instrumental PSF in this field from the GRIZLY library. The best fit to their observed profiles (given by least-squares minimization) returns their fluxes and sizes. We assume that the shape of each substructure is the same in all bands. For this reason, the fit is initially performed in F200W, chosen as the reference filter, and then the shape (size, axis ratio, and position angle) of each clump is kept fixed in the other filters, where only the source flux is fitted. Uncertainties are obtained from Monte Carlo sampling.
The results of the model analysis are presented in Table 3. Our findings indicate that the morphologies of the three clumps in CEERS-1019 are compact, with measured FWHMs of 48 ± 5 mas, 62 ± 15 mas, and 43 ± 4 mas for clumps A, B, and C, respectively. Following Peng et al. (2010), the inferred FWHM suggests that these clumps are resolved albeit slightly, as their sizes are larger than the pixel size of the NIRCam images: 40 mas (see also: Vanzella et al. 2017, Messa et al. 2022, and Claeyssens et al. 2023). Translating these measurements into half-light radii, we find re = 112 ± 12 pc, 145 ± 35 pc, and 101 ± 9 pc for clumps A, B, and C, respectively.
SED and morphological properties of the different substructures of CEERS-1019.
4.6.2. Spectral energy distribution
We go on to analyze the spectral energy distributions (SEDs) of CEERS-1019 as a whole (named Total) as well as its sub-components (A, B, and C). We used the SED-fitting code CIGALE (Boquien et al. 2019, version 2022.1) using the available NIRCam photometry from F115W to F444W, covering the rest-frame wavelength ∼1200 − 4600 Å. Stellar population models from Bruzual & Charlot (2003) were used along with the Chabrier (2003) initial mass function (IMF) and the Small Magellanic Cloud extinction curve (Rv = 2.93, Pei 1992). The metallicity was fixed to Z = 0.004, the closest available value inferred for CEERS-1019, and assumed to be the same for nebular emission and starlight. The dust attenuation (E(B − V)) and ionization paramater (log(U)) were treated as free parameters, ranging from 0.0 − 0.5 mag and −3.5 to −1.0, respectively. Finally, we explored two different star formation histories: a constant star formation model applied to the integrated light of CEERS-1019 (total) and instantaneous burst episodes for the three sub-components (A, B, and C). For the former, we included the flux measurements of the Hβ + [O III] λλ4960, 5008 emission lines in the fitting process.
Starting with the integrated emission of CEERS-1019 (total), the best-fit model, shown in black in the right panel of Fig. 5, finds a continuous star formation rate of SFR = 161 ± 23 M⊙ yr−1 over 14 ± 7 Myr. The stellar mass is  attenuated by E(B − V)=0.17 ± 0.02, in agreement with the values reported in Larson et al. (2023). For the three individual components A, B, and C, we found burst masses of
  ,
,  , and
, and  , respectively. Clumps A and B are well-fitted with very young burst models, having ages of 4.0 ± 0.26 Myr and 5.6 ± 0.7 Myr, respectively. On the other hand, clump C is older than the other components, with a burst age of 15.0 ± 2.9 Myr. Indeed, the color obtained for clump C F356W − F444W = 0.32 ± 0.29 is significantly lower than those measured in clumps A and B, F356W − F444W ≃ 0.75 − 1.16, suggesting a weak contribution of nebular emission in F444W (e.g., Hβ and [O III]), thus negligible star formation over the last ≲10 Myr.
We note here, in passing, that our estimates of stellar mass and SFR are based on standard models, which do not, for instance, account for peculiar abundance patterns and which do rely on standard assumptions regarding the star formation histories. This approach allows meaningful comparisons of these parameters with those from other studies. Also, for simplicity, we did not correct the photometry for a possible contribution from SMSs, since we would expect for such an object not to dominate the light in CEERS-1019. Indeed, even for a very massive SMS with 106 M⊙ the expected flux in the rest-optical range is mAB ∼ 28 (Martins et al. 2020), approximately ten times fainter than the flux of region A.
4.6.3. Stellar mass and SFR surface densities
Based on the stellar masses and half-light radii obtained for the individual clumps (Table 3), we obtained high stellar mass surface densities of log(ΣM)=3.86 ± 0.11, 3.55 ± 0.53, and 4.14 ± 0.14 M⊙pc−2 for clumps A, B, and C, respectively (defined as  ). It is worth noting that the inferred values of ΣM may even be higher if each substructure comprises multiple unresolved stellar systems. Nevertheless, these values are already comparable to the densest systems identified at high redshift by Claeyssens et al. (2023) or Meštrić et al. (2022), and significantly higher than the average log(ΣM)≃2 M⊙ pc−2 observed in nearby young clusters (Brown & Gnedin 2021). Similarly, the compactness index, defined as C5 = (M⋆/105M⊙)/(reff/pc−1) is also high in the case of CEERS-1019. It ranges from C5 ≃ 30 − 90 depending on the clump, exceeding the values of old globular clusters and young massive clusters by at least one order of magnitude (Krause et al. 2016), suggesting high cluster formation efficiencies (Krause et al. 2016; Kruijssen 2012). The SFR surface density is also found to be very high for clumps A and B with log(ΣSFR)=3.27 ± 0.11 and 2.81 ± 0.21 M⊙ yr−1 kpc−2, respectively. In contrast, clump C does not show significant star formation over the last 10 Myr, yielding an upper limit of log(ΣSFR)< 2.27 M⊙ yr−1 kpc−2.
Finally, the derived mass and SFR surface densities in CEERS-1019 are comparable with those of other prominent N-emitters discussed below, such as GN-z11 (log(ΣM)∼4.6 M⊙ pc−2, Tacchella et al. 2023), SMACSJ2031 (log(ΣM)∼4.0 M⊙ pc−2, log(ΣSFR)∼1.4 M⊙ yr−1 kpc−2, Patrício et al. 2016), the Sunburst cluster (log(ΣM)∼4.1 M⊙ pc−2, log(ΣSFR)∼3.7 M⊙ yr−1 kpc−2, Vanzella et al. 2022), or Mrk 996 (log(ΣM)∼2.8 M⊙ pc−2, and Thuan et al. 1996). This suggests a potential connection between compactness and a high production efficiency of nitrogen.
4.7. Mass of the enriched material
The total mass of enriched, ionized gas, which is directly observable, can easily be estimated assuming ionization equilibrium and a constant ISM density (see, e.g., Dopita & Sutherland 2003):
 (1)
(1)
where QH is the ionizing photon production rate which can be determined from H recombination lines, ne as the electron density, mp as the proton mass, and αB as the recombination rate coefficient.
For CEERS-1019 we thus find Mionized ∼ 1.2 × 10⁵ M⊙, from the observed Hβ luminosity and adopting ne = 105 cm−3, very similar to the value of Mionized ∼ 2 × 10⁵ M⊙ inferred for GN-z11 by Charbonnel et al. (2023). Furthermore, Maiolino et al. (2023) argue that the amount of enriched gas in GN-z11 could be even smaller if the N-emitting gas is found at higher densities.
5. Discussion
5.1. Observed heavy element abundances in CEERS-1019 comparison to “normal” objects
The main elemental abundance ratios derived for CEERS-1019 are shown in Fig. 6, and compared to measurements in other galaxies and HII regions. To do so we use in particular the recent CNO abundances determined and compiled by Izotov et al. (2023), who primarily included data from low-redshift star-forming galaxies observed with HST/COS, and data on individual HII regions from the works of Esteban et al. (2002, 2009, 2014), García-Rojas & Esteban (2007), and López-Sánchez et al. (2007).
As is well known, the majority of galaxies and HII regions follow a fairly well-defined sequence of N/O versus O/H and C/O versus O/H (e.g. Garnett et al. 1999; Berg et al. 2019), which can be understood on the basis of chemical evolution models (Henry et al. 2000; Chiappini et al. 2006; Prantzos et al. 2018). In N/O, for example, only few strong outliers with a large nitrogen excess are known at low redshift (see e.g., Thuan et al. 1996; Pustilnik et al. 2004; Stephenson et al. 2023). In comparison, CEERS-1019 clearly stands out by having an extremely high nitrogen abundance, log(N/O)= − 0.13 ± 0.11, which is approximately 5.6 times the solar ratio (Asplund et al. 2021) and more than a factor of 10 higher than the N/O values generally observed at similar metallicities (O/H). This exceptionally high N abundance reflects the very peculiar UV spectrum of CEERS-1019, showing unusually strong nitrogen lines.
In contrast to N/O, with log(C/O)= − 0.75 ± 0.11, the C/O abundance is fairly normal for the observed metallicity. The Ne/O abundance, log(Ne/O)= − 0.63 ± 0.07 is somewhat higher (by ∼0.15 dex) than the average value for normal star-forming galaxies derived by Guseva et al. (2011) at the same metallicity.
Interestingly, these observed abundance ratios of CEERS-1019 resemble those of globular cluster stars. This is a similar result to what was pointed out by Senchyna et al. (2023) and Charbonnel et al. (2023) for GN-z11. The origin of these peculiar abundance ratios will be discussed below.
5.2. Abundances in other N-emitters
Interestingly, the abundance ratios found in CEERS-1019 resemble those found by Cameron et al. (2023a) for the z = 10.6 galaxy GN-z11 observed recently with JWST by Bunker et al. (2023), which are shown by boxes in Fig. 6. As shown, the abundances in GN-z11 suffer from large uncertainties, which are in particular because the [O III]λ5007 line is shifted beyond the range accessible with NIRSpec and no direct O/H abundance determination is possible for this object from the present data. Using photoionization modeling, Senchyna et al. (2023) have further constrained the abundances in GN-z11, obtaining total gas abundances of 12 + log(O/H) = 7.84 ± 0.06 and log(N/O)= − 0.38 ± 0.05, which are quite similar to those obtained here for CEERS-1019. Clearly, both CEERS-1019 and GN-z11 are significantly enriched in nitrogen, reaching exceptionally high N/O values. The carbon abundance cannot be well constrained in GN-z11, since the electron temperature remains undetermined in this object. The allowed range, derived by Cameron et al. (2023a), is indicated in Fig. 6.
Very few other galaxies or HII regions with a high N/O abundance and/or clear detections of nebular lines of N in the UV can be found in the literature. Barchiesi et al. (2023) list known AGN and galaxies with O VI, N V, or N IV] λ1486 emission lines in the rest-UV. Among the non-AGN in their list one finds the peculiar galaxy named the Lynx arc (at z = 3.36), which has been studied by Fosbury et al. (2003) and Villar-Martín et al. (2004), although Binette et al. (2003) have argued that this object may be an obscured QSO. According to the photoionization models of Villar-Martín et al. (2004), both the N/O and C/O abundance ratios of this object are elevated, as seen in Fig. 6. Although suspected, no direct signs of WR stars have been found in this object (Villar-Martín et al. 2004) and the inferred abundances are not explained.
Another object showing nebular N IV] λ1486 emission is the strongly lensed galaxy SMACSJ2031.8-4036 at z = 3.5 studied in detail by Christensen et al. (2012) and Patrício et al. (2016). The available VLT observations (with XShooter and MUSE) cover both the rest-UV and optical domain, allowing the detection of numerous emission lines, and thus electron temperature, density, and abundance determinations. Interestingly, this object shows indications for high density (ne ≳ 105 cm−3) from the N IV] λ1486 doublet and lower densities from other diagnostics (Patrício et al. 2016). The metallicity 12 + log(O/H) = 7.76 ± 0.03 is very similar to CEERS-1019 and it shows a normal C/O abundance (log(C/O)= − 0.80 ± 0.09), according to Christensen et al. (2012). Inspection of their spectra, kindly provided by the authors, shows a clear detection of both N IV] λ1486 and N III] λ1750 lines, which allows us to determine N/O from the UV lines and the reported Te using the same methods described above (see Sect. 4.4). We find a relatively high N abundance of log(N/O)= − 0.66 ± 0.1, which we also report in Fig. 6. Finally, we also find a normal Neon abundance of log(Ne/O)= − 0.82 from the reported line fluxes.
In the list of Barchiesi et al. (2023) other non-AGN spectra showing UV lines of nitrogen show only N V P-Cygni lines, which are most likely due to stellar emission, or they are stacked spectra with weak detections and, thus, unsuitable for our purpose.
Another high-redshift object where N III] λ1750 emission has recently been detected is the strongly lensed and multiply imaged stellar cluster at z = 2.368 in the Sunburst arc (Meštrić et al. 2023), an exceptional object studied in depth by various authors (e.g., Rivera-Thorsen et al. 2019; Vanzella et al. 2020). From a detailed analysis and photoionization modeling, Pascale et al. (2023) infer in particular a high N/O abundance ratio ( ), and normal C/O and Ne/O ratios for a metallicity (O/H) of approximately ∼0.22 solar. The N/O ratio of this object fares thus among the highest values, comparable to CEERS-1019, and C/O is also similar, as also shown in Fig. 6.
To extend our comparison, we have also examined the low-redshift galaxy Mrk 996, which is a well-known Blue Compact Dwarf (BCD) galaxy with peculiar properties, such as a high electron density, broad emission line components in Hα, [O III] λλ4959,5007 and other lines, the presence of Wolf-Rayet stars of WN and WC type, and a high N/O abundance (see e.g., Thuan et al. 1996; Pustilnik et al. 2004; James et al. 2009; Telles et al. 2014). This galaxy also shows N III] and N IV] emission lines in the UV (Mingozzi et al. 2022; Senchyna et al. 2023). From integral-field observations James et al. (2009) have found a normal N abundance (log(N/O)≈ − 1.43) across the galaxy and a N-enhancement by a factor ∼20 (log(N/O)≈ − 0.13) in the broad line component, emitted in the central region. The two measurements are plotted in Fig. 6. The C/O abundance of Mrk 996 can be derived from the C III] λ1909 and O III] λ1666 line ratio, which is taken from the HST/COS observations from the CLASSY survey (Berg et al. 2022; Mingozzi et al. 2022), and adopting the electron temperature of Te = 104 K from James et al. (2009). We find a high Carbon abundance of log(C/O)= − 0.22, close to solar, for this galaxy. However, for its metallicity (∼0.5× solar, according to James et al. 2009), the C/O abundance ratio is comparable to that of other galaxies and HII regions (i.e., it is not unusual).
Taken together, we thus conclude that all of the six N-emitters show an elevated (supersolar) N/O abundance ratio, whereas the C/O abundance is normal in four of them and only one of them (the Lynx arc) appears enhanced in C/O. The observed and other properties of these objects are also summarized in Table 4. We go on to discuss possible scenarios to explain the observed abundance pattern.
Properties, proposed scenarios, and nature of the N-emitters
5.3. Possible chemical enrichment scenarios
Galactic chemical evolution models are able to reproduce the observed average trends of the abundance ratios behaviord H for “normal” galaxies (see e.g., Henry et al. 2000; Chiappini et al. 2006; Berg et al. 2019; Johnson et al. 2023), although the evolution of nitrogen has notoriously been more complicated to explain since the observations show a behaviour like a primary element at low (subsolar) metallicity (cf., discussion and references in Prantzos et al. 2018). To examine the conditions that may be more appropriate for low-metallicity dwarf galaxies and HII regions, which dominate the current samples of extra-galactic CNO measurements in galaxies (the samples shown here), various authors have studied the effects of variable or bursty star formation histories, outflows, and different star formation efficiencies. Again, such models can reproduce the average trends of C/O, N/O, and C/N as a function of metallicity and they can also explain the observed scatter in the data, for instance, by the presence of burst phases (see Berg et al. 2019, for a recent study).
However, since the observed abundance ratios of CEERS-1019 and possibly other N-emitters are clearly more extreme than those of the bulk of galaxies studied so far, we need to examine the possible nucleosynthetic sources and the conditions capable of explaining them. To do so, we first consider two quantitative scenarios, the first involving enrichment from normal massive stars and the second nucleosynthesis from super-massive stars. These scenarios were considered in recent studies (e.g., Charbonnel et al. 2023; Nagele & Umeda 2023; Watanabe et al. 2023).
5.3.1. Enrichment from massive stars: The “WR scenario”
It is generally known that the stellar winds of massive stars can carry important amounts of newly created elements such as He and N (from H-burning, the latter resulting at the expense of C and O) or C and O (from He-burning); those elements appear at the stellar surfaces and are ejected by the winds during the so-called Wolf-Rayet (WR) phases, with N enhanced in the WN phase and C enhanced in the subsequent WC phase (Maeder 1983). The stellar wind yields depend strongly on the initial mass and metallicity of the stars and also on other properties such as stellar rotation and the efficiency of mixing in the stellar interiors or their evolution in close binary systems (e.g., Georgy et al. 2012; Szécsi et al. 2015; Pauli et al. 2022).
Using the recent stellar yields from Limongi & Chieffi (2018), we computed the cumulative stellar wind yields of a simple stellar population as a function of time, for a Kroupa (2002) IMF, three different metallicities ([Fe/H] = −2, −1, and 0, respectively) and three different initial rotational velocities (VRot = 0, 150 and 300 km s−1, respectively). The latter value of VRot = 300 km s−1 was adopted in Charbonnel et al. (2023) to discuss the observations of GN-z11. Assuming that stars more massive than 20–25 M⊙ do not explode but collapse and become black holes (see discussion in Prantzos et al. 2018), the stellar ejecta have exclusively a wind composition for several million years. In the first couple of Myr, that composition is the original one of the stellar envelope, then it is dominated by H-burning products and, subsequently, by He-burning products. To make a comparison with the observed abundance ratios Charbonnel et al. (2023) assumed a dilution of the wind ejecta with an equal amount of ISM. Here, we assume no such mixing, thus maximizing the effect of the stellar winds on the composition. Physically, this may correspond to the situation where the winds of the previous O-star phase, operating for a few Myr, have opened a cavity in the ISM where the winds of the subsequent WR phase are expanding. Actually, there is mixture with pristine ISM material, since we include the winds released by all stars above 12 M⊙ and in the considered period of 8 Myr, the stars less massive than 20 M⊙ do not reach the WR phase.
In Fig. 7, we display the evolution of various quantities of the “WR scenario” for stars of [Fe/H] = −1, a value that is reasonably close to the metallicity of the extragalactic systems studied here. Results are shown up to 8 Myr after the formation of a stellar population of total mass 108 M⊙with a normal IMF (Kroupa 2002). During that period, stars below 25 M⊙ have not yet ended their lives (by assumption), so only the wind ejecta populate the cavity crafted by the winds and the radiation of the stars. The mass of the wind ejecta increases steadily, from ∼104 M⊙ after the first Myr to ∼106 M⊙ at 4 Myr and more slowly after that. In Sect. 4.7 we discussed the amounts of ionized gas estimated in CEERS-1019 and GN-z11, which are compatible with the model results for this earliest period after the starburst (horizontal dashed lines in the top panel).
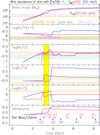 |
Fig. 7. Evolution of IMF-weighted time-integrated masses and abundances of the winds of a stellar population of total mass 108 M⊙created at t = 0, according to the models of Limongi & Chieffi (2018) with metallicity [Fe/H] = −1 and initial rotational velocity VROT = 300 km s−1 (solid blue curves) or 0 km s−1 (solid red curves) in all panels; practically no dilution with ambient ISM is assumed (99% of ejecta and 1% of ISM). Comparison is made to abundance data from CEERS-1019 (this work: orange shaded), Lynx arc (green shaded), and GN-z11 (Senchyna et al. 2023, violet shaded with age dermination). The two horizontal dashed lines in the top panel indicate the estimated mass of ionized gas observed in CEERS-1019 and GN-z11, respectively (see Sect. 4.7). The yellow shaded area indicates the short period (∼0.5 Myr) where all three abundance ratios for CEERS-1019 are well reproduced by the rotating massive star winds. In the bottom panel, displaying the evolution of the He mass fraction, the corresponding lifetimes of the stars are indicated (filled circles, color-coded for VROT = 0 and 300 km s−1) for selected masses (associated numbers in M⊙). |
The evolution of the wind composition differs between the non-rotating and the rotating stars. The former (solid red curves) have practically no mixing between their convective core and radiative envelope; in consequence, the signatures of H-burning (high N/O and N/C) appear abruptly in the wind, once the mass loss uncovers the former H-burning core. The latter (solid blue curves) undergo rotational mixing, bringing slowly the H-burning products to the surface; as a result, the N/O and N/C ratios increase slowly but steadily, up to the equilibrium value, which is similar to the case of non-rotating stars. The timescale for the appearance of high N abundance is ∼3 Myr, in good agreement with the time window inferred by Senchyna et al. (2023) for GN-z11. About one Myr later, some amounts of He and He-burning products (mainly C and insignificant O amounts) appear in the wind ejecta of the most massive rotating stars (from 120 to ∼70 M⊙), while the less massive ones never reach the WC phase; the combined effect is a strong increase in C/O, a strong decrease in N/C and a small variation in N/O. In contrast, none of the non-rotating stars reach the WC phase at such low metallicity and all the CNO ratios remain basically unchanged. After that, the situation is expected to change drastically, as the first SN from M < 25 M⊙ stars explode and eject their core material in the ISM.
As shown in Fig. 7, in the early evolution of a stellar population, there is a period of several Myr during which the N/O ratio in the stellar winds reaches the high N/O ratios observed in CEERS-1019 and in the other N-emitters analyzed here. However, rapidly after reaching the maximum N/O value, the carbon abundance also increases (very strongly in rotating star or less so without rotation), implying C/O and N/C ratios that are incompatible with the observations of CEERS-1019, SMACS2031, and the Sunburst cluster over most of the time (see also Fig. 9). In the results displayed here, there is only a fairly short period of ∼0.5 Myr (yellow shaded area in Fig. 7), where all three ratios N/O, N/C, and C/O are compatible with the observations of CEERS-1019 for the case of rotating stars. In view of the timescales involved (several Myr), the probability of such an occurrence is small but certainly non-negligible. We note that this occurs rather early in the evolution of the starburst, but well within the time window found by the analysis of Senchyna et al. (2023) for GN-z11 (violet horizontal segments in the 2nd and 3d panels). We also note that other stellar models than those used here could result in more extended periods of high N/O and N/C ratios. This could be the case, for instance, of stars rotating more rapidly than 300 km s−1 (e.g., the fast rotators at nearly break-up velocity of 800 km s−1 calculated by Hirschi 2007), binary stars, or stars calculated with higher mass loss rates, etc. (see e.g., Eldridge & Stanway 2022, for a recent review). On the other hand, for the central region of Mrk 996 which shows both N and C enrichment, we find that all the abundance ratios are well reproduced by the models. Furthermore, in this galaxy, the WR-scenario is directly supported by the presence of WR stars both of WN and WC types (Telles et al. 2014). Similarly, N and C enrichment found in the Lynx arc could also be explained by the WR scenario, and earlier studies have argued for the presence of WR stars, from emission line modeling of this peculiar object (see e.g., Villar-Martín et al. 2004).
Ultimately, we consider whether there is any direct evidence for WR stars in the N-emitters discussed here. In short, WR stars have been reported only in the low-z galaxy Mrk 996, as mentioned earlier in this paper. In the spectral range covered by the observations of CEERS-1019, the strongest WR features could be He IIλ1640 and C IVλ1550 in the rest-UV and the so-called blue WR-bump centered around He IIλ4686. None of these features are detected in the current NIRSpec spectra and the same holds for GN-z11 (see Bunker et al. 2023; Maiolino et al. 2023). However, the JWST spectra of these very high-z objects, and in particular for CEERS-1019, are of insufficient spectral resolution and S/N to rule out, e.g., He IIλ1640 emission with equivalents widths ≲7 − 10 Å (depending on the adopted FWHM of the WR line) and, therefore, stellar populations comparable to those of Mrk 996, which has EW(1640) ≈ 3 − 4 Å, cannot be ruled out from the present data. The rest-UV spectrum of SMACS2031 from Patrício et al. (2016) also shows no clear feature of WR stars. He IIλ1640 is present with an EW(1640) = 0.99 ± 0.1 Å, but it is only marginally broader than the nebular emission lines.
The very high-S/N spectrum of the Sunburst cluster, discussed by Meštrić et al. (2023), also shows no signature of WR stars. Except for the nebular lines, the Sunburst spectrum resembles in fact strongly the spectrum of the well-known massive star cluster R136 in the LMC, which is known to be very young (∼1.5 Myr) and to host very massive stars with masses up to ∼200 M⊙ (Vanzella et al. 2020; Meštrić et al. 2023). The Sunburst cluster also appears to be too young to host WR stars (Chisholm et al. 2019). Finally, Villar-Martín et al. (2004) have suggested the presence of WR in the Lynx arc, in particular to explain the hard observed ionizing spectrum, but no direct signatures are detected in the relatively low S/N spectra available for this object.
In conclusion, except for Mrk 996 where the presence of important populations of WR stars (both of WN and WC types) has been established, no direct evidence for WR stars is found in the other N-emitters studied here. However, this does not necessarily exclude the WR scenario, since WR stars may be present below the detection threshold.
5.3.2. Enrichment from super-massive stars (M ≳ 1000 M⊙) – SMS scenario
An alternate scenario was previously invoked by Charbonnel et al. (2023) to explain the high N-abundance in the compact galaxy GN-z11 at z = 10.6, namely, that of super-massive stars (SMS). These stars have previously been proposed as an explanation of the abundance anomalies of the multiple stellar populations seen in old Galactic and extra-galactic globular clusters (GC) and in extra-galactic massive star clusters with ages down to ∼1.7 Gyr (Gieles et al. 2018). In essence, this model proposes that gas accretion and collisions of proto-stars in the densest clusters lead to the runaway formation of one or several SMS, with masses of M ≳ 103 M⊙ that increase with the cluster mass. During some time before two-body relaxation heats the cluster, this mostly convective SMS undergoes accretion (from proto-stars in the cluster and infalling gas) and it ejects processed matter, whose composition reflects the conditions in its hot H-burning core. In particular, the ejected material is strongly enriched in N, Na, and Al, and it is strongly depleted in O and C as a result of CNO, NeNa, and MgAl nuclear reactions at high temperatures. As initially shown by Denissenkov & Hartwick (2014), the whole range of abundance anomalies (C-N, O-N, Na-O, Mg-Al anticorrelations) in GC stars is very well accounted for after dilution of the SMS ejecta with proto-GC gas.
The constant supply of unprocessed material to the SMS “freezes” its evolution close to the zero-age main sequence, preventing strong He-enrichment of the SMS yields, in agreement with GC multiple band photometry (Milone 2015; Milone et al. 2018). This also solves the so-called “mass budget” problem encountered by all the other scenarios that try to explain the presence and properties of multiple stellar populations in globular clusters (Prantzos & Charbonnel 2006; Schaerer & Charbonnel 2011; Krause et al. 2012, 2016; Renzini et al. 2015; Bastian & Lardo 2018). For example, Gieles et al. (2018) find that a SMS forming into a dense cluster hosting 107 proto-stars can reach and process (respectively) ∼5% and ∼45% of the cluster mass. This is significantly higher than the ∼2% of wind mass ejected in the massive star scenario (cf. Fig. 7). In particular, the super-linear scaling predicted between the amount of material nuclearly processed by the SMS and the cluster mass explains the observed increase in the fraction of second-population stars with GC mass (Carretta et al. 2010; Milone et al. 2017). This picture is dubbed the “conveyor-belt” SMS model. The high amount of processed matter also implies that any additional matter ejected by the SMS during its final phase (once the conveyor belt stops) will have very little impact on the final abundance ratios.
In Figs. 8 and 9, the solid lines show, for three different initial metallicities (0.34 Z⊙, 0.12 Z⊙, and 0.018 Z⊙), the predicted chemical abundance ratios resulting from the mixture of ejecta of 104 M⊙ SMS in the conveyer-belt scenario with different amounts of ISM gas with a normal, initial abundance (stellar models from Charbonnel et al. 2023). The composition of the SMS ejecta reflects the yields from H-burning via the CNO-cycle. It is very strongly enriched in nitrogen, with N/O > 10, namely, it is nearly 100 times super-solar, and very strongly depleted in oxygen and carbon. With an increasing fraction of matter from the SMS mixed into the ISM, the predicted N/O and N/C ratios increase strongly. The resulting mixture also shows a decreasing O/H abundance (metallicity), while C/O remains relatively constant.
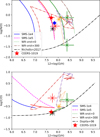 |
Fig. 8. Observed chemical abundances (N/O versus O/H in the top panel, C/O versus O/H in the bottom) of the six N-emitters (using the same symbols as in Fig. 6) and comparison with predictions for enrichment from massive stars (dotted and dash-dotted lines showing the “WR scenario” for non-rotating and rotating stars, respectively; see text) and supermassive stars (solid and dashed). Different colors indicate different metallicities. The predictions for the WR scenario are shown for a very low dilution (1%) with ISM matter. The solid lines show the predicted composition using SMS models with 104 M⊙ at different metallicities (12 + log(O/H) ≈ 7.0,7.8, 8.3) from Charbonnel et al. (2023) and for varying amounts of dilution with an ISM of standard composition. The dashed lines show an SMS model with 105 M⊙ from Nagele & Umeda (2023). |
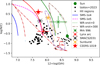 |
Fig. 9. Observed and predicted abundance ratios of N/C as a function of O/H for the six N-emitters and comparison samples from the literature. Observed data are shown using the same symbols as in Fig. 6, with model predictions given the same line styles as in Fig. 6. |
The observed N/O ratio of GN-z11 and CEERS-1019 can be explained by mixing approximately equal amounts of SMS ejecta with ISM gas, as already shown by Charbonnel et al. (2023). The N/O abundance of all other N emitters considered here could also be explained with the SMS scenario. The same is also true for the C/O and N/C abundance ratios, except for the two objects that show a high C/O ratio: Mrk 996 and the Lynx arc. As already mentioned before, the C/O in these galaxies reveals the presence of both H- and He-burning products, which, in the case of Mrk 996, is compatible with its observed WR star population. In short, the comparison of the observed N/O, C/O, and N/C ratios suggests that CEERS-1019, SMACS2031, and the Sunburst cluster might be explained by the SMS conveyor-belt scenario (implying that they should contain one or several proto-GC) as well as Mrk 996 and the Lynx arc by the WR scenario. From the available data and the lack of accurate C/O measurements, the case of GN-z11 remains inconclusive.
Nagele & Umeda (2023) have computed the composition of the material ejected through winds along the entire evolution of SMS with masses between 103 and 105 M⊙ for 0.1 Z⊙, neglecting the conveyor belt rejuvenation of the star discussed above (they assume that SMS form through gravitational collapse during the merger of gas-rich galaxies at high-z, see Mayer et al. 2015). In addition, they estimate if (and when) the SMS become GR unstable as they evolve, as well as the modifications of the composition of the material that can be ejected at the end of the life of the stars in the case they eventually explode due to the CNO cycle and the rapid proton capture (rp) process (for details, see Nagele & Umeda 2023). The 103 and 104M⊙ models from the cited work (which are not shown here) predict strong N-enrichment on the main sequence, confirming the results of Denissenkov & Hartwick (2014) and Charbonnel et al. (2023). However, these two models do not become GR unstable and make it until carbon-oxygen burns. As a consequence, their winds reach super-solar C and O abundances because of the dredge-up of C and O from the core during central He-burning, and they are strongly enriched in He. This implies that without undergoing the conveyor-belt episode that is required to solve the mass budget and the photometric constraints for the GC case, the total yields of such models cannot explain the GC abundance anomalies, nor can they explain the N/O and C/O ratios in CEERS-1019 and in GN-z11, as discussed by Nagele & Umeda (2023).
On the other hand, Nagele & Umeda (2023) find that their 5 × 10⁴ and 105 M⊙ models at 0.1 Z⊙ become GR unstable close to or at the end of the main sequence, implying that their winds contain super-solar N and sub-solar C and O before the stars eventually collapse to a black hole or are disrupted by a thermonuclear explosion. The dashed lines in Figs. 8 and 9 show the range of abundances expected when the ejecta of their 105 M⊙ model is diluted to various degrees with ISM of the initial composition. In addition to the N-enrichment along the main sequence, this includes their estimate of the additional N that is produced during the expected CNO-powered explosion (Nagele & Umeda 2023). This model accounts well for the observed abundance N/O ratios in CEERS-1019, GN-z11, and SMACS2031. It also produces enough enriched material to be able to pollute sufficient ionized gas, namely, masses in the observed range (see Sect. 4.7), as shown by Nagele & Umeda (2023).
From this, we conclude that SMS over a wide range of masses can simultaneously explain the GC abundance anomalies and the N/O and C/O ratios in CEERS-1019, GN-z11, and SMACS2031, if they eject large quantities of H-processed material early on the main sequence, as predicted by the conveyor-belt SMS scenario (Gieles et al. 2018), or if the SMS sheds large amounts of processed material due to instabilities and an explosion during the CNO-cycle (cf. Nagele & Umeda 2023). In Sect. 5.4 we will further argue whether the N-emitters are proto-GCs and discuss any plausible implications of the SMS scenario, including the possible formation of an intermediate-mass black hole (IMBH).
5.3.3. Other scenarios to explain strong N emission
Cameron et al. (2023a) discussed different processes or sources that could explain the observed N-enhancement in GN-z11, including enrichment from AGB stars, pollution from Pop III star formation, stellar encounters in dense star clusters, or the tidal disruption of stars from encounters with black holes. The main conclusions of their qualitative discussion is that these explanations would need fine-tuned conditions and that the origin of N-enrichment is currently largely unknown.
The predictions of classical chemical evolution models including AGB stars are shown, for instance, in the studies of Johnson et al. (2023). Watanabe et al. (2023) also show predictions of such models in comparison with GN-z11. Indeed, as is well known from earlier works, such models cannot produce high N/O abundance ratios at low metallicity (as observed in the N-emitters discussed here), since these models include also the yields of massive stars and core-collapse supernovae, which produce large amounts of oxygen, and hence no extreme N/O ratios. The pure WR-wind models of Watanabe et al. (2023) are essentially the same as our massive star models (WR-scenario).
Maiolino et al. (2023) have recently argued that GN-z11 shows signs of a type 1 AGN, with emission from very high density and a broad line region (BLR). They further argue that the exceptionally high nitrogen abundance “becomes much less problematic” in the AGN scenario, for several reasons. First, they point out that several “nitrogen-loud” AGNs have been found, making GN-z11 less peculiar. And second, they mention that only small amounts of enriched gas are needed if the observed gas is at very high densities. Finally, they mention supernovae from supermassive stellar progenitors, rapidly recycled secondary nitrogen production, or bloated atmospheres of giant/supergiant stars as possible sources of the observed enrichment, without providing quantitative estimates.
Clearly, the spectra of CEERS-1019 and the other N-emitters discussed here are very different from nitrogen-loud AGN, as discussed in Sect. 3. Furthermore, except for GN-z11 for which Maiolino et al. (2023) show indications of densities nH ≳ 1010 cm−3 typical of BLR, the densities inferred here are much lower, typically n ∼ 104 − 5 cm−3, and all observed emission line properties are compatible with photoionization from star formation (Sect. 3). The qualitative scenarios sketched by Maiolino et al. (2023) for GN-z11 may therefore not be applicable to the other N-emitters discussed here. In any case, more quantitative studies on the detailed chemical abundances of nitrogen-loud AGN and their source of enrichment could be of interest to better understand the common points and differences with other N-emitters.
For the Sunburst cluster, Pascale et al. (2023) proposed a model where the super star cluster is surrounded by low- and high-density photoionized clouds and regions (channels) through which ionizing radiation can escape and they argue that only the high-density clouds in the vicinity of the star cluster are N-enriched and confined by strong external pressure. They estimate that ∼500 M⊙ of nitrogen is needed – an amount which can be produced by the star cluster with a mass M⋆ ∼ few × 107 M⊙– and suggest that it originates from young massive stars, ejected, for instance, in dense LBV winds or non-conservative binary mass transfer. In this case, SN ejecta are not favored, since the Sunburst is not enriched in C, and the inferred age (≲4 Myr) is consistent with this explanation.
The model of Pascale et al. (2023) is essentially the same as our massive star scenario, although they do not use a specific model to predict the chemical yields of the cluster and its temporal evolution, and our massive star scenario does not include ejecta from mass transfer in binary systems. As already discussed above, such a scenario requires some specific “tuning.” In particular, this calls for the selection of a fairly specific age at which the composition of ejecta matches the observed abundances. For the Sunburst cluster, this seems very plausible; however, it is not clear if this could be generalized to CEERS-1019 and the other N-emitters.
5.4. Considering whether CEERS-1019 and other N-emitters are either proto-GC in formation or related to the formation of intermediate-mass black holes
The unusually high N/O abundances derived for GN-z11 and the Sunburst arc and similarities with the abundance pattern of stars in globular clusters have led several authors to suggest a link between these peculiar objects and GC formation (Senchyna et al. 2023; Charbonnel et al. 2023; Nagele & Umeda 2023; Pascale et al. 2023). With the finding of a highly supersolar N/O ratio and normal C/O in CEERS-1019, along with similar results for other objects from the literature (in total six N-emitters analyzed here), the question of the nature of the N-emitters must be rediscussed in light of new and additional evidence. We summarize basic observational evidence and our most favourable scenarioes and explanations in Table 4.
First, the observed abundance ratios of N/O and C/O, which are accurately measured for five objects, suggest that two of them (the low-z galaxy Mrk 996 and the Lynx arc) are probably explained by pollution from WR stars, as discussed above. If correct, it implies that the cluster(s) dominating presumably these objects cannot be progenitors of GCs. This is because massive star wind scenario suffers from the so-called mass budget problem of GCs (Prantzos & Charbonnel 2006; Decressin et al. 2007), which basically means that the massive stars cannot produce sufficient amounts of enriched material to explain the observed population of “polluted” (second population) stars in GCs without this first population being much more massive than the second one, in contradiction with the observations. In Mrk 996 WR features are detected, and the presence of WR stars is suspected in the Lynx arc. We therefore suggest that they are somewhat peculiar star-forming galaxies (WR galaxies), although we note that Binette et al. (2003) have also considered a hidden AGN to explain the emission line properties of the Lynx arc.
For CEERS-1019, GN-z11, SMACS2031, and the Sunburst cluster, the N/O, C/O, and N/C ratios could be explained by the two scenarios discussed earlier, with the enriched matter originating from normal massive stars or from supermassive stars. We favor the SMS scenario for several reasons. First, the WR scenario requires a very special and shorter timing than the SMS scenario. Second, these galaxies contain at least one sufficiently massive and compact region (the Sunburst cluster is of course a cluster) with extreme conditions (very high SFR and mass surface density), and unusually high ISM densities. Such rare conditions may be necessary for the formation of supermassive stars through runaway collisions and for the conveyer-belt model, as proposed by Gieles et al. (2018). This would also naturally explain why N-emitters are rare. We therefore propose that CEERS-1019, SMACS2031, and the Sunburst cluster have been enriched by SMS and that they host (or are) proto-GCs in star-forming galaxies. Finally, the finding of such objects at look-back times between 11.2–13.3 Gyr is also compatible with them hosting proto-GCs.
The case of GN-z11 may be somewhat different as it may host an AGN, as suggested by Maiolino et al. (2023). If the high density of the ionized gas (ne ≳ 1010 cm−3) inferred by these authors is confirmed, it would significantly reduce the amount of ionized gas that needs to be polluted, but it still leaves the source of chemical enrichment unexplained (cf. Maiolino et al. 2023). However, this does not exclude pollution from one or several SMS, which might even have seeded the “small” massive black hole (with log(MBH/M⊙)∼6.2 ± 0.3) or contributed to its growth. Indeed, the final fate of SMS is difficult to predict since in addition to metallicity and mass, other input parameters of the stellar models (mass loss, convection, overshooting, rotation, etc.) may impact the occurrence of the GR instability, its timing, and the question of whether the collapse would trigger an explosion through the CNO-cycle (Fuller et al. 1986; Montero et al. 2012; Haemmerlé et al. 2019; Haemmerlé 2021; Nagele & Umeda 2023). In any case, the formation of IMBH with masses ∼104 to 105 M⊙ from SMS seems possible at metallicities comparable to that of GN-z11, as shown e.g. by Nagele et al. (2023). We therefore propose that N-emitters could also be an indication of black hole seed formation from SMS. These objects could evolve to N-loud quasars, a rare sub-population of quasars showing strong N lines in the UV (Jiang et al. 2008) and which have been suggested to be objects with high N/O and sub-solar metallicities in a rapid growth phase (Araki et al. 2012; Matsuoka et al. 2017). We therefore mark GN-z11 as a possible AGN with BH-formation related to SMS in Table 4. Finally, we also consider that the formation of an IMBH with mass ≳1000 M⊙ from an SMS is incompatible with the proto-GC scenario, as the presence of such a BH in old GCs seems to be ruled out observationally (Baumgardt et al. 2019, and references therein). This is also reflected in Table 4.
Finally, we wish to recall here that Larson et al. (2023) have suggested that CEERS-1019 also hosts a black hole, although our analysis does not show significant evidence for this; rather, our findings suggest that the object is dominated by star formation (see Sect. 3). If CEERS-1019 harbors an AGN, the situation could be similar to that of GN-z11 (as discussed in this work) and points to a possible link between SMS and black hole formation. Also, we note that Binette et al. (2003) have considered a hidden AGN to explain the emission line properties of the Lynx arc, although the nature of this source remains unclear. To conclude, we also recall that none of the four other N-emitters discussed here show any AGN indication. We are therefore probably left with three good candidates for SMS and proto-GCs, CEERS-1019, SMACS2031, and the Sunburst cluster.
5.5. Future steps and improvements
Clearly, better data and more N-emitters would be helpful to better understand the origin of the strong N emission lines to further test the proposed enrichment scenarios and the possible presence of SMS and, thus, to understand the nature of these rare objects.
An important test for the massive star scenario would be to detect direct spectral signatures of WR stars. Deeper, very high S/N spectra, in the rest-optical domain would be ideal for this. In contrast to SMS, the massive star scenario also predicts important amounts of helium in the ejecta, which might be measurable from the analysis of nebular He and H emission lines in rest-optical spectra of sufficient quality. In the SMS scenario, a strong enrichment of aluminum, originating from H-burning from the MgAl chain (Prantzos et al. 2007), is predicted (Ramirez-Galeano, in prep.). We note that this is the same as what has been observed in GC stars (Carretta et al. 2009; Pancino et al. 2017; Masseron et al. 2019). In contrast, massive stars should produce less aluminum (Decressin et al. 2007; Gormaz-Matamala et al. 2023). Aluminum has spectral signatures in the rest-UV (Al IIλ1670, Al IIIλλ1855,1863), which are often seen in absorption in high-z galaxy spectra (Shapley et al. 2003; Le Fèvre et al. 2019), and which are in emission in some AGNs (see e.g., Alexandroff et al. 2013). These features might be an interesting test of the relation between N-emitters and proto-GCs, and to distinguish between the WR and SMS scenarios.
To examine whether the strong N lines could be related to large density variations and found preferentially in pockets of high density, it will be of interest to obtain multiple density measurements probing the widest possible range of density, regions of different ionization, and possibly also spatial variations. Both high S/N and high-resolution spectra are needed for this, and measurements of fine-structure lines of oxygen and nitrogen with NOEMA could also provide insights into this question.
Future studies may reveal new N-emitters, improving the statistics and providing more test cases. If strongly enhanced N-emitters are found at significantly lower metallicities (say 12 + log(O/H) ≲ 7) the SMS scenario might be favored, since WR stars should be less present at low O/H. In addition, objects with even higher N/O abundances could exist if the SMS scenario is was indeed found to be accurate.
6. Conclusion
In this work, we present a detailed analysis of CEERS-1019 at z = 8.678 using deep spectroscopy and imaging with NIRSpec and NIRCam obtained from the JWST CEERS program. Low- and medium-resolution NIRSpec spectra covering 1 − 5 μm reveal a wealth of rest-frame UV and optical nebular emission lines of various transitions and ionizing states from H, He, C, N, O, and Ne. In particular, CEERS-1019 shows remarkably intense nitrogen emission of N III and N IV, with N IV] λ1486 emerging as the strongest line within the rest-frame UV spectrum. These emission lines are very rarely seen in galaxy spectra, and CEERS-1019 – which shows some resemblance with the peculiar object GN-z11 revealed recently by JWST (Bunker et al. 2023) – is thus the second “N-emitter” found at z > 8. From the analysis of these data, we arrive at the following main results:
-
Using the well-detected auroral [O III] λ4363 line we determined the O/H abundance using the direct method, resulting in 12 + log(O/H) = 7.70 ± 0.18. We derived the electron temperature from both rest-frame UV and optical [O III] lines, yielding consistent values of Te ≈ 18 000 K. The density-sensitive lines of N IV] 1483/1487 = 0.50 ± 0.22 and [O II] 3727/3729 = 0.98 ± 0.23 suggest a relatively high electron density of ne ≈ 103 − 5 cm−3. These values are consistent with those reported by other studies for this object (Tang et al. 2023; Nakajima et al. 2023; Larson et al. 2023).
-
Metal abundances were derived for different ions of C, N, O, and Ne. Notably, we found an exceptionally high N/O abundance of log(N/O) = −0.13 ± 0.11, approximately 5.6 times higher than the solar ratio. Conversely, CEERS-1019 exhibits relatively normal C/O and Ne/O ratios for its metallicity (O/H), with log(C/O) = −0.75 ± 0.11 and log(Ne/O) = −0.63 ± 0.07, respectively. This translates to high N/O and N/C, and normal C/O ratios, typically found in globular cluster stars, and which reflect the abundance ratios from H-burning via the CNO-cycle at very high temperature (Prantzos et al. 2017; Gratton et al. 2019).
-
We have discussed possible chemical enrichment scenarios to explain these peculiar C, N, and O abundance ratios observed in CEERS-1019. Enrichment from massive star winds through the WR phase can explain the observed ratios but requires a very short and specific time window (and the presence of WN stars only); it would also come with a very strong He enrichment. Furthermore, no signatures of WR stars are detected in CEERS-1019, although their presence cannot be ruled out from the available data. Alternatively, models of super-massive stars (> 1000 M⊙) mixed with ISM with a normal composition can explain the abundance ratios of CEERS-1019. In this scenario, the ejected processed material via SMS will exhibit H-burning products only, be strongly enriched in N, and possibly exhibit some depletion in O and C, along with a normal level of He content.
-
We have investigated the possibility of an AGN in CEERS-1019, a scenario recently suggested by Larson et al. (2023) due to the detection of a broad component in Hβ. Our own reduction of the NIRSpec spectrum shows a tentative, broad component in Hβ (FWHM ≃ 1150 km s−1) but detected with a fairly low significance (≃2.2σ). Line ratios using rest-UV lines (N V, N IV], C IV, C III], O III], and He II) suggest that the gas is primarily photoionized by star formation, and any contribution from an AGN would likely be residual. The non-detection of the high-ionization lines of N Vλ1240 and He IIλ1640 further support this scenario.
-
CEERS-1019 shows a complex morphology with three resolved clumps. By analyzing the light distribution of these substructures, we found very compact morphologies with characteristic half-light radii of ≃100 − 150 pc. Multi-wavelength SED fits for each individual clump predict stellar masses of log(M⋆/M⊙)≃8.66 − 8.94, resulting in very high stellar mass surface densities log(ΣM⋆/(M⊙ pc−2) ≃ 3.55 − 4.14. The star formation rate appears very intense in two clumps (SFR ≃ 80 − 150 M⊙ yr−1), while the remaining clump displays a negligible level of ongoing star formation.
CEERS-1019 represents thus the second example of a rare population of strong N-emitting galaxies at z > 8 with highly super-solar N/O abundances, very compact regions, and a high-density ISM. To put this object into context and better understand these N-emitters, we have (re-)analyzed other known N-emitting star-forming galaxies from the literature. This includes three lensed objects, two galaxies (SMACS2031 and the Lynx arc), and one star-cluster (the Sunburst cluster) at z ∼ 2.3 − 3.5, plus a nearby blue compact dwarf galaxy (Mrk 996), all of them without any clear indications of AGN activity. Similar to CEERS-1019, these sources show peculiar abundance ratios with a supersolar N/O ratio along with very dense clustered mass and star formation (log(ΣM⋆/(M⊙ pc−2)) ≳ 3.5) and high ISM densities (ne ∼ 104 − 105 cm−3). Two galaxies, Mrk 996 and the Lynx arc, show an enhanced C/O ratio compared to normal galaxies at the same metallicity (O/H), indicative of enrichment from WR stars.
We have also presented quantitative predictions for the chemical enrichment in two different scenarios, including enrichment from winds of massive stars (called the WR-scenario) or from the ejecta of supermassive stars (SMS) with masses 103 − 105 M⊙, which have been invoked to explain the abundance anomalies observed in present-day globular clusters (Denissenkov & Hartwick 2014; Gieles et al. 2018). The WR scenario explains well the two galaxies with enhanced C/O and is supported by direct evidence of WN and WC stars in Mrk 996. As previously reported by Charbonnel et al. (2023) for GN-z11, we found that the SMS scenario reproduced well the observed abundance ratios in CEERS-1019, SMACS2031, and the Sunburst cluster. These observations probably provide the best indirect evidence so far for the possible existence of SMS in galaxies.
Finally, considering the preferred enrichment scenarios and other physical properties, we have also examined which of the N-emitters may potentially host proto-GCs and what their nature is. From our analysis, we conclude that CEERS-1019, SMACS2031, and the Sunburst cluster are most likely to host proto-GCs. We also suggest that the peculiar abundances of GN-z11 could be due to SMS, even if this object was confirmed to host an AGN, as proposed by Maiolino et al. (2023). This could also point to the formation of intermediate-mass black holes from a SMS and suggest a link between the N-emitters and N-loud quasars.
In short, the newly discovered N-emitter CEERS-1019 and other N-emitters show intriguing similarities with stars in GCs and the conditions that are expected during the formation of GCs. They may also offer a unique window into the formation of SMS, their role during the formation of GCs, and also their possible importance as seeds for the formation of massive black holes. More detailed studies and further discoveries of these rare objects will shed further light on these exciting topics and questions.
Unless stated otherwise, N IV] λ1486 refers to the sum of the forbidden [N IV] λ1483 and the semi-forbidden N IV] λ1486 lines, which are not resolved in the Prism spectrum.
N IV] λ1486 presents an observed line width FWHM = 394 ± 95 km s−1 in the medium-resolution G140M spectrum.
https://jwst-docs.stsci.edu/jwst-near-infrared-spectrograph/nirspec-instrumentation/nirspec-dispersers-and-filters
Acknowledgments
We would like to thank the referee for a thoughtful report that improved the manuscript. We thank Lise Christensen and Johan Richard for sharing spectra from their VLT observations of SMACS2031. We also thank Mark Gieles, Eros Vanzella, Laura Ramirez Galeano, Anastasios Fragos, Holger Baumgardt, Montse Villar-Martin, and other colleagues for stimulating discussions. C.C. acknowledges support from the Swiss National Science Foundation (SNF; Project 200020-192039). M.M. acknowledges the support of the Swedish Research Council, Vetenskapsrådet (internationell postdok grant 2019-00502). Y.I. acknowledges support from the National Academy of Sciences of Ukraine (Project No. 0123U102248) and from the Simons Foundation.
References
- Alexandroff, R., Strauss, M. A., Greene, J. E., et al. 2013, MNRAS, 435, 3306 [NASA ADS] [CrossRef] [Google Scholar]
- Araki, N., Nagao, T., Matsuoka, K., et al. 2012, A&A, 543, A143 [NASA ADS] [CrossRef] [EDP Sciences] [Google Scholar]
- Asplund, M., Grevesse, N., Sauval, A. J., & Scott, P. 2009, ARA&A, 47, 481 [NASA ADS] [CrossRef] [Google Scholar]
- Asplund, M., Amarsi, A. M., & Grevesse, N. 2021, A&A, 653, A141 [NASA ADS] [CrossRef] [EDP Sciences] [Google Scholar]
- Barchiesi, L., Dessauges-Zavadsky, M., Vignali, C., et al. 2023, A&A, 675, A30 [NASA ADS] [CrossRef] [EDP Sciences] [Google Scholar]
- Bastian, N., & Lardo, C. 2018, ARA&A, 56, 83 [Google Scholar]
- Batra, N. D., & Baldwin, J. A. 2014, MNRAS, 439, 771 [NASA ADS] [CrossRef] [Google Scholar]
- Baumgardt, H., He, C., Sweet, S. M., et al. 2019, MNRAS, 488, 5340 [CrossRef] [Google Scholar]
- Bentz, M. C., Hall, P. B., & Osmer, P. S. 2004, AJ, 128, 561 [NASA ADS] [CrossRef] [Google Scholar]
- Berg, D. A., Erb, D. K., Henry, R. B. C., Skillman, E. D., & McQuinn, K. B. W. 2019, ApJ, 874, 93 [NASA ADS] [CrossRef] [Google Scholar]
- Berg, D. A., James, B. L., King, T., et al. 2022, ApJS, 261, 31 [NASA ADS] [CrossRef] [Google Scholar]
- Bertin, E., & Arnouts, S. 1996, A&AS, 117, 393 [NASA ADS] [CrossRef] [EDP Sciences] [Google Scholar]
- Binette, L., Groves, B., Villar-Martín, M., Fosbury, R. A. E., & Axon, D. J. 2003, A&A, 405, 975 [NASA ADS] [CrossRef] [EDP Sciences] [Google Scholar]
- Boquien, M., Burgarella, D., Roehlly, Y., et al. 2019, A&A, 622, A103 [NASA ADS] [CrossRef] [EDP Sciences] [Google Scholar]
- Brammer, G. 2023, https://doi.org/10.5281/zenodo.8345533 [Google Scholar]
- Brown, G., & Gnedin, O. Y. 2021, MNRAS, 508, 5935 [NASA ADS] [CrossRef] [Google Scholar]
- Bruzual, G., & Charlot, S. 2003, MNRAS, 344, 1000 [NASA ADS] [CrossRef] [Google Scholar]
- Bunker, A. J., Saxena, A., Cameron, A. J., et al. 2023, A&A, 677, A88 [NASA ADS] [CrossRef] [EDP Sciences] [Google Scholar]
- Cameron, A. J., Saxena, A., Bunker, A. J., et al. 2023a, A&A, 677, A115 [NASA ADS] [CrossRef] [EDP Sciences] [Google Scholar]
- Cameron, A. J., Katz, H., Rey, M. P., & Saxena, A. 2023b, MNRAS, 523, 3516 [NASA ADS] [CrossRef] [Google Scholar]
- Carretta, E., Bragaglia, A., Gratton, R., & Lucatello, S. 2009, A&A, 505, 139 [NASA ADS] [CrossRef] [EDP Sciences] [Google Scholar]
- Carretta, E., Bragaglia, A., Gratton, R. G., et al. 2010, A&A, 516, A55 [NASA ADS] [CrossRef] [EDP Sciences] [Google Scholar]
- Chabrier, G. 2003, ApJ, 586, L133 [NASA ADS] [CrossRef] [Google Scholar]
- Charbonnel, C., Schaerer, D., Prantzos, N., et al. 2023, A&A, 673, L7 [NASA ADS] [CrossRef] [EDP Sciences] [Google Scholar]
- Chiappini, C., Hirschi, R., Meynet, G., et al. 2006, A&A, 449, L27 [NASA ADS] [CrossRef] [EDP Sciences] [Google Scholar]
- Chisholm, J., Rigby, J. R., Bayliss, M., et al. 2019, ApJ, 882, 182 [Google Scholar]
- Christensen, L., Laursen, P., Richard, J., et al. 2012, MNRAS, 427, 1973 [NASA ADS] [CrossRef] [Google Scholar]
- Claeyssens, A., Adamo, A., Richard, J., et al. 2023, MNRAS, 520, 2180 [NASA ADS] [CrossRef] [Google Scholar]
- Decressin, T., Charbonnel, C., & Meynet, G. 2007, A&A, 475, 859 [CrossRef] [EDP Sciences] [Google Scholar]
- Denissenkov, P. A., & Hartwick, F. D. A. 2014, MNRAS, 437, L21 [Google Scholar]
- Dere, K. P., Del Zanna, G., Young, P. R., Landi, E., & Sutherland, R. S. 2019, ApJS, 241, 22 [Google Scholar]
- Dhanda, N., Baldwin, J. A., Bentz, M. C., & Osmer, P. S. 2007, ApJ, 658, 804 [NASA ADS] [CrossRef] [Google Scholar]
- Dopita, M. A., & Sutherland, R. S. 2003, Astrophysics of the Diffuse Universe (Berlin, New York: Springer) [CrossRef] [Google Scholar]
- Dopita, M. A., Fischera, J., Sutherland, R. S., et al. 2006, ApJS, 167, 177 [NASA ADS] [CrossRef] [Google Scholar]
- Eldridge, J. J., & Stanway, E. R. 2022, ARA&A, 60, 455 [NASA ADS] [CrossRef] [Google Scholar]
- Esteban, C., Peimbert, M., Torres-Peimbert, S., & Rodríguez, M. 2002, ApJ, 581, 241 [NASA ADS] [CrossRef] [Google Scholar]
- Esteban, C., Bresolin, F., Peimbert, M., et al. 2009, ApJ, 700, 654 [NASA ADS] [CrossRef] [Google Scholar]
- Esteban, C., García-Rojas, J., Carigi, L., et al. 2014, MNRAS, 443, 624 [NASA ADS] [CrossRef] [Google Scholar]
- Feltre, A., Charlot, S., & Gutkin, J. 2016, MNRAS, 456, 3354 [Google Scholar]
- Ferland, G. J., Chatzikos, M., Guzmán, F., et al. 2017, Rev. Mex. Astron. Astrophys., 53, 385 [Google Scholar]
- Finkelstein, S. L., Dickinson, M., Ferguson, H. C., et al. 2017, The Cosmic Evolution Early Release Science (CEERS) Survey, JWST Proposal ID 1345, Cycle 0 Early Release Science [Google Scholar]
- Finkelstein, S. L., Bagley, M. B., Ferguson, H. C., et al. 2023, ApJ, 946, L13 [NASA ADS] [CrossRef] [Google Scholar]
- Fosbury, R. A. E., Villar-Martín, M., Humphrey, A., et al. 2003, ApJ, 596, 797 [NASA ADS] [CrossRef] [Google Scholar]
- Fuller, G. M., Woosley, S. E., & Weaver, T. A. 1986, ApJ, 307, 675 [Google Scholar]
- García-Rojas, J., & Esteban, C. 2007, ApJ, 670, 457 [CrossRef] [Google Scholar]
- Garnett, D. R., Shields, G. A., Peimbert, M., et al. 1999, ApJ, 513, 168 [NASA ADS] [CrossRef] [Google Scholar]
- Georgy, C., Ekström, S., Meynet, G., et al. 2012, A&A, 542, A29 [NASA ADS] [CrossRef] [EDP Sciences] [Google Scholar]
- Gieles, M., Charbonnel, C., Krause, M. G. H., et al. 2018, MNRAS, 478, 2461 [Google Scholar]
- Gormaz-Matamala, A. C., Cuadra, J., Meynet, G., & Curé, M. 2023, A&A, 673, A109 [NASA ADS] [CrossRef] [EDP Sciences] [Google Scholar]
- Gratton, R., Bragaglia, A., Carretta, E., et al. 2019, A&ARv, 27, 8 [Google Scholar]
- Grazian, A., Giallongo, E., Fiore, F., et al. 2020, ApJ, 897, 94 [NASA ADS] [CrossRef] [Google Scholar]
- Guseva, N. G., Izotov, Y. I., Stasińska, G., et al. 2011, A&A, 529, A149 [NASA ADS] [CrossRef] [EDP Sciences] [Google Scholar]
- Gutkin, J., Charlot, S., & Bruzual, G. 2016, MNRAS, 462, 1757 [Google Scholar]
- Haemmerlé, L. 2021, A&A, 650, A204 [NASA ADS] [CrossRef] [EDP Sciences] [Google Scholar]
- Haemmerlé, L., Meynet, G., Mayer, L., et al. 2019, A&A, 632, L2 [NASA ADS] [CrossRef] [EDP Sciences] [Google Scholar]
- Hainline, K. N., Shapley, A. E., Greene, J. E., & Steidel, C. C. 2011, ApJ, 733, 31 [NASA ADS] [CrossRef] [Google Scholar]
- Hamann, F., Korista, K. T., Ferland, G. J., Warner, C., & Baldwin, J. 2002, ApJ, 564, 592 [NASA ADS] [CrossRef] [Google Scholar]
- Henry, R. B. C., Edmunds, M. G., & Köppen, J. 2000, ApJ, 541, 660 [NASA ADS] [CrossRef] [Google Scholar]
- Hirschi, R. 2007, A&A, 461, 571 [NASA ADS] [CrossRef] [EDP Sciences] [Google Scholar]
- Horne, K. 1986, PASP, 98, 609 [Google Scholar]
- Isobe, Y., Ouchi, M., Tominaga, N., et al. 2023, ApJ, 959, 100 [NASA ADS] [CrossRef] [Google Scholar]
- Izotov, Y. I., Thuan, T. X., & Lipovetsky, V. A. 1994, ApJ, 435, 647 [NASA ADS] [CrossRef] [Google Scholar]
- Izotov, Y. I., Stasińska, G., Meynet, G., Guseva, N. G., & Thuan, T. X. 2006, A&A, 448, 955 [CrossRef] [EDP Sciences] [Google Scholar]
- Izotov, Y. I., Schaerer, D., Worseck, G., et al. 2023, MNRAS, 522, 1228 [NASA ADS] [CrossRef] [Google Scholar]
- James, B. L., Tsamis, Y. G., Barlow, M. J., et al. 2009, MNRAS, 398, 2 [Google Scholar]
- Jiang, L., Fan, X., & Vestergaard, M. 2008, ApJ, 679, 962 [NASA ADS] [CrossRef] [Google Scholar]
- Johnson, J. W., Weinberg, D. H., Vincenzo, F., Bird, J. C., & Griffith, E. J. 2023, MNRAS, 520, 782 [NASA ADS] [CrossRef] [Google Scholar]
- Kewley, L. J., Nicholls, D. C., Sutherland, R., et al. 2019, ApJ, 880, 16 [Google Scholar]
- Krause, M., Charbonnel, C., Decressin, T., et al. 2012, A&A, 546, L5 [NASA ADS] [CrossRef] [EDP Sciences] [Google Scholar]
- Krause, M. G. H., Charbonnel, C., Bastian, N., & Diehl, R. 2016, A&A, 587, A53 [NASA ADS] [CrossRef] [EDP Sciences] [Google Scholar]
- Kroupa, P. 2002, Science, 295, 82 [Google Scholar]
- Kruijssen, J. M. D. 2012, MNRAS, 426, 3008 [Google Scholar]
- Larson, R. L., Finkelstein, S. L., Hutchison, T. A., et al. 2022, ApJ, 930, 104 [NASA ADS] [CrossRef] [Google Scholar]
- Larson, R. L., Finkelstein, S. L., Kocevski, D. D., et al. 2023, ApJ, 953, L29 [NASA ADS] [CrossRef] [Google Scholar]
- Le Fèvre, O., Lemaux, B. C., Nakajima, K., et al. 2019, A&A, 625, A51 [NASA ADS] [CrossRef] [EDP Sciences] [Google Scholar]
- Leonova, E., Oesch, P. A., Qin, Y., et al. 2022, MNRAS, 515, 5790 [NASA ADS] [CrossRef] [Google Scholar]
- Limongi, M., & Chieffi, A. 2018, ApJS, 237, 13 [NASA ADS] [CrossRef] [Google Scholar]
- López-Sánchez, Á. R., Esteban, C., García-Rojas, J., Peimbert, M., & Rodríguez, M. 2007, ApJ, 656, 168 [CrossRef] [Google Scholar]
- Maeder, A. 1983, A&A, 120, 113 [NASA ADS] [Google Scholar]
- Mainali, R., Zitrin, A., Stark, D. P., et al. 2018, MNRAS, 479, 1180 [NASA ADS] [Google Scholar]
- Maiolino, R., Scholtz, J., Witstok, J., et al. 2023, ArXiv e-prints [arXiv:2305.12492] [Google Scholar]
- Martins, F., Schaerer, D., Haemmerlé, L., & Charbonnel, C. 2020, A&A, 633, A9 [NASA ADS] [CrossRef] [EDP Sciences] [Google Scholar]
- Masseron, T., García-Hernández, D. A., Mészáros, S., et al. 2019, A&A, 622, A191 [NASA ADS] [CrossRef] [EDP Sciences] [Google Scholar]
- Matsuoka, K., Nagao, T., Maiolino, R., et al. 2017, A&A, 608, A90 [NASA ADS] [CrossRef] [EDP Sciences] [Google Scholar]
- Mayer, L., Fiacconi, D., Bonoli, S., et al. 2015, ApJ, 810, 51 [Google Scholar]
- Messa, M., Dessauges-Zavadsky, M., Richard, J., et al. 2022, MNRAS, 516, 2420 [Google Scholar]
- Meštrić, U., Vanzella, E., Zanella, A., et al. 2022, MNRAS, 516, 3532 [CrossRef] [Google Scholar]
- Meštrić, U., Vanzella, E., Upadhyaya, A., et al. 2023, A&A, 673, A50 [NASA ADS] [CrossRef] [EDP Sciences] [Google Scholar]
- Milone, A. P. 2015, MNRAS, 446, 1672 [NASA ADS] [CrossRef] [Google Scholar]
- Milone, A. P., Piotto, G., Renzini, A., et al. 2017, MNRAS, 464, 3636 [Google Scholar]
- Milone, A. P., Marino, A. F., Renzini, A., et al. 2018, MNRAS, 481, 5098 [NASA ADS] [CrossRef] [Google Scholar]
- Mingozzi, M., James, B. L., Arellano-Córdova, K. Z., et al. 2022, ApJ, 939, 110 [NASA ADS] [CrossRef] [Google Scholar]
- Montero, P. J., Janka, H.-T., & Müller, E. 2012, ApJ, 749, 37 [Google Scholar]
- Morisset, C., Delgado-Inglada, G., & Flores-Fajardo, N. 2015, Rev. Mex. Astron. Astrophys., 51, 103 [Google Scholar]
- Morton, D. C. 1991, ApJS, 77, 119 [Google Scholar]
- Nagele, C., & Umeda, H. 2023, ApJ, 949, L16 [NASA ADS] [CrossRef] [Google Scholar]
- Nagele, C., Umeda, H., & Takahashi, K. 2023, MNRAS, 523, 1629 [NASA ADS] [CrossRef] [Google Scholar]
- Nakajima, K., Ouchi, M., Isobe, Y., et al. 2023, ApJS, 269, 33 [NASA ADS] [CrossRef] [Google Scholar]
- Oesch, P. A., Brammer, G., van Dokkum, P. G., et al. 2016, ApJ, 819, 129 [NASA ADS] [CrossRef] [Google Scholar]
- Pancino, E., Romano, D., Tang, B., et al. 2017, A&A, 601, A112 [NASA ADS] [CrossRef] [EDP Sciences] [Google Scholar]
- Pâris, I., Petitjean, P., Rollinde, E., et al. 2011, A&A, 530, A50 [NASA ADS] [CrossRef] [EDP Sciences] [Google Scholar]
- Pascale, M., Dai, L., McKee, C. F., & Tsang, B. T. H. 2023, ApJ, 957, 77 [NASA ADS] [CrossRef] [Google Scholar]
- Patrício, V., Richard, J., Verhamme, A., et al. 2016, MNRAS, 456, 4191 [Google Scholar]
- Pauli, D., Langer, N., Aguilera-Dena, D. R., Wang, C., & Marchant, P. 2022, A&A, 667, A58 [NASA ADS] [CrossRef] [EDP Sciences] [Google Scholar]
- Pei, Y. C. 1992, ApJ, 395, 130 [Google Scholar]
- Peng, C. Y., Ho, L. C., Impey, C. D., & Rix, H.-W. 2010, AJ, 139, 2097 [Google Scholar]
- Pérez-Montero, E., & Amorín, R. 2017, MNRAS, 467, 1287 [Google Scholar]
- Perrin, M. D., Sivaramakrishnan, A., Lajoie, C. P., et al. 2014, SPIE Conf. Ser., 9143, 91433X [NASA ADS] [Google Scholar]
- Portegies Zwart, S. F., & McMillan, S. L. W. 2002, ApJ, 576, 899 [Google Scholar]
- Prantzos, N., & Charbonnel, C. 2006, A&A, 458, 135 [NASA ADS] [CrossRef] [EDP Sciences] [Google Scholar]
- Prantzos, N., Charbonnel, C., & Iliadis, C. 2007, A&A, 470, 179 [CrossRef] [EDP Sciences] [Google Scholar]
- Prantzos, N., Charbonnel, C., & Iliadis, C. 2017, A&A, 608, A28 [NASA ADS] [CrossRef] [EDP Sciences] [Google Scholar]
- Prantzos, N., Abia, C., Limongi, M., Chieffi, A., & Cristallo, S. 2018, MNRAS, 476, 3432 [Google Scholar]
- Pustilnik, S., Kniazev, A., Pramskij, A., et al. 2004, A&A, 419, 469 [NASA ADS] [CrossRef] [EDP Sciences] [Google Scholar]
- Reddy, N. A., Steidel, C. C., Pettini, M., & Bogosavljević, M. 2016, ApJ, 828, 107 [NASA ADS] [CrossRef] [Google Scholar]
- Renzini, A. 2017, MNRAS, 469, L63 [Google Scholar]
- Renzini, A., D’Antona, F., Cassisi, S., et al. 2015, MNRAS, 454, 4197 [Google Scholar]
- Rivera-Thorsen, T. E., Dahle, H., Chisholm, J., et al. 2019, Science, 366, 738 [Google Scholar]
- Roberts-Borsani, G. W., Bouwens, R. J., Oesch, P. A., et al. 2016, ApJ, 823, 143 [NASA ADS] [CrossRef] [Google Scholar]
- Schaerer, D., & Charbonnel, C. 2011, MNRAS, 413, 2297 [Google Scholar]
- Schaerer, D., Marques-Chaves, R., Barrufet, L., et al. 2022, A&A, 665, L4 [NASA ADS] [CrossRef] [EDP Sciences] [Google Scholar]
- Senchyna, P., Plat, A., Stark, D. P., & Rudie, G. C. 2023, AAS J., submitted [arXiv:2303.04179] [Google Scholar]
- Shapley, A. E., Steidel, C. C., Pettini, M., & Adelberger, K. L. 2003, ApJ, 588, 65 [Google Scholar]
- Stephenson, M. G., Arellano-Córdova, K. Z., Berg, D. A., Mingozzi, M., & James, B. L. 2023, Res. Notes Am. Astron. Soc., 7, 31 [Google Scholar]
- Szécsi, D., Langer, N., Yoon, S.-C., et al. 2015, A&A, 581, A15 [NASA ADS] [CrossRef] [EDP Sciences] [Google Scholar]
- Tacchella, S., Eisenstein, D. J., Hainline, K., et al. 2023, ApJ, 952, 74 [NASA ADS] [CrossRef] [Google Scholar]
- Tang, M., Stark, D. P., Chen, Z., et al. 2023, MNRAS, 526, 1657 [NASA ADS] [CrossRef] [Google Scholar]
- Telles, E., Thuan, T. X., Izotov, Y. I., & Carrasco, E. R. 2014, A&A, 561, A64 [NASA ADS] [CrossRef] [EDP Sciences] [Google Scholar]
- Thuan, T. X., Izotov, Y. I., & Lipovetsky, V. A. 1996, ApJ, 463, 120 [NASA ADS] [CrossRef] [Google Scholar]
- Trinca, A., Schneider, R., Maiolino, R., et al. 2023, MNRAS, 519, 4753 [NASA ADS] [CrossRef] [Google Scholar]
- Übler, H., Maiolino, R., Curtis-Lake, E., et al. 2023, A&A, 677, A145 [NASA ADS] [CrossRef] [EDP Sciences] [Google Scholar]
- Vanzella, E., Grazian, A., Hayes, M., et al. 2010, A&A, 513, A20 [NASA ADS] [CrossRef] [EDP Sciences] [Google Scholar]
- Vanzella, E., Calura, F., Meneghetti, M., et al. 2017, MNRAS, 467, 4304 [Google Scholar]
- Vanzella, E., Caminha, G. B., Calura, F., et al. 2020, MNRAS, 491, 1093 [Google Scholar]
- Vanzella, E., Castellano, M., Bergamini, P., et al. 2022, A&A, 659, A2 [NASA ADS] [CrossRef] [EDP Sciences] [Google Scholar]
- Vila-Costas, M. B., & Edmunds, M. G. 1993, MNRAS, 265, 199 [NASA ADS] [CrossRef] [Google Scholar]
- Villar-Martín, M., Cerviño, M., & González Delgado, R. M. 2004, MNRAS, 355, 1132 [CrossRef] [Google Scholar]
- Watanabe, K., Ouchi, M., Nakajima, K., et al. 2023, ArXiv e-prints [arXiv:2305.02078] [Google Scholar]
- Whitler, L., Stark, D. P., Endsley, R., et al. 2023, MNRAS, submitted, [arXiv:2305.16670] [Google Scholar]
- Witten, C. E. C., Laporte, N., & Katz, H. 2023, ApJ, 944, 61 [NASA ADS] [CrossRef] [Google Scholar]
- Woods, T. E., Agarwal, B., Bromm, V., et al. 2019, PASA, 36, e027 [Google Scholar]
- Zitrin, A., Labbé, I., Belli, S., et al. 2015, ApJ, 810, L12 [Google Scholar]
All Tables
All Figures
|
Fig. 1. Overview of the JWST observations of CEERS-1019 at z = 8.6782. Top: 1D and 2D low-resolution NIRSpec/PRISM spectra (black) and 1σ uncertainty (grey). Vertical dashed lines (green) mark the position of well-detected nebular emission lines. The X-axis in the bottom and top panels refer to the observed (μm) and rest-frame wavelengths (Å), respectively. Bottom right: NIRSpec/G395M medium-resolution spectrum of CEERS-1019. Bottom left: JWST NIRCam cutout of CEERS-1019 in the F200W filter. CEERS-1019 is composed of three resolved clumps. The inferred positions of the NIRSpec MSA shutters are overlaid in blue. |
| In the text | |
|
Fig. 2. Zoom-in to the rest-frame UV part of the PRISM spectrum of CEERS-1019 (black and 1σ uncertainty in grey). Vertical dashed lines (green) mark the position of nebular emission lines. The blue line is the best fit for several UV emission lines and continuum. The bottom panel shows the residuals (in the same units as the spectrum) as well as the 1σ uncertainties (grey). |
| In the text | |
|
Fig. 3. Star formation and AGN diagnostics. The top left panel shows the G140M spectrum of CEERS-1019 (in black and 1σ uncertainty in grey) around the expected positions of N Vλλ1238, 1242 (marked with vertical lines), which are not detected (1.44 × 10⁻¹⁸ erg s−1 cm−2 at 3σ). Lyα emission is also marked. The top middle and right panels show the best fits (green) to the Hβ emission line using dual-component (middle, narrow and broad components in blue and red, respectively) and single-component (right) Gaussian profiles. The bottom panels show star formation (blue) and AGN (red) photoionization models using several rest-frame UV lines. The position of CEERS-1019 (dark blue circle) aligns with the predictions of star-forming models in all diagnostic diagrams. The location of other known star-forming galaxies with strong nitrogen emission, GN-z11 (Bunker et al. 2023), the Lynx arc (Villar-Martín et al. 2004), SMACS2031 (Patrício et al. 2016), and Mrk 996 (Mingozzi et al. 2022) are also marked with different symbols as indicated in the legend. |
| In the text | |
|
Fig. 4. Best fit (blue) of density-sensitive emission lines, N IV] λλ1483, 1486 (left) and [O II] λλ3727, 3729 (right), using G140M and G395M medium-resolution spectra (black and 1σ uncertainty in grey), respectively. The fit uses two Gaussian profiles with similar widths and the expected position and separation between the two transitions (vertical lines). |
| In the text | |
|
Fig. 5. Multi-wavelength analysis of CEERS-1019. The left panel shows cutout images around CEERS-1019 in the NIRCam filters. In the F150W sub-panel, we show the positions of the three compact clumps resolved only at short wavelength, labeled A, B, and C (blue, green, and red, respectively) The right panel shows the SED best-fit models using CIGALE (Boquien et al. 2019) of the integrated light of CEERS-1019 (“total” in black), as well as the individual clumps (A, B, and C in blue, green, and red, respectively). Observed fluxes are marked with circles, while the predicted fluxes from the best fit are marked with crosses. |
| In the text | |
|
Fig. 6. Observed chemical abundances of the six N-emitters and comparison samples from the literature. Top: N/O versus O/H. Bottom: C/O versus O/H. CEERS-1019 is shown by a red star, GN-z11 by a blue circle. The z ∼ 2.6 − 3 lensed galaxies: Lynx arc, SMACS2023, and the Sunburst cluster are shown with red, black, and orange crosses, the low-z galaxy Mrk 996 is marked with a green cross (two N/O values from James et al. 2009 for the central region and from the total galaxy). The magenta shaded region and outlined box indicate the range of abundances allowed for GN-z11, according to Cameron et al. (2023a). Low-z star-forming galaxies and HII regions from the compilation of Izotov et al. (2023) are shown by small black symbols. The dash-dotted line shows the average trend observed in low-z star-forming galaxies, as parametrized by Vila-Costas & Edmunds (1993) for N/O and C/O by Dopita et al. (2006), respectively. |
| In the text | |
|
Fig. 7. Evolution of IMF-weighted time-integrated masses and abundances of the winds of a stellar population of total mass 108 M⊙created at t = 0, according to the models of Limongi & Chieffi (2018) with metallicity [Fe/H] = −1 and initial rotational velocity VROT = 300 km s−1 (solid blue curves) or 0 km s−1 (solid red curves) in all panels; practically no dilution with ambient ISM is assumed (99% of ejecta and 1% of ISM). Comparison is made to abundance data from CEERS-1019 (this work: orange shaded), Lynx arc (green shaded), and GN-z11 (Senchyna et al. 2023, violet shaded with age dermination). The two horizontal dashed lines in the top panel indicate the estimated mass of ionized gas observed in CEERS-1019 and GN-z11, respectively (see Sect. 4.7). The yellow shaded area indicates the short period (∼0.5 Myr) where all three abundance ratios for CEERS-1019 are well reproduced by the rotating massive star winds. In the bottom panel, displaying the evolution of the He mass fraction, the corresponding lifetimes of the stars are indicated (filled circles, color-coded for VROT = 0 and 300 km s−1) for selected masses (associated numbers in M⊙). |
| In the text | |
|
Fig. 8. Observed chemical abundances (N/O versus O/H in the top panel, C/O versus O/H in the bottom) of the six N-emitters (using the same symbols as in Fig. 6) and comparison with predictions for enrichment from massive stars (dotted and dash-dotted lines showing the “WR scenario” for non-rotating and rotating stars, respectively; see text) and supermassive stars (solid and dashed). Different colors indicate different metallicities. The predictions for the WR scenario are shown for a very low dilution (1%) with ISM matter. The solid lines show the predicted composition using SMS models with 104 M⊙ at different metallicities (12 + log(O/H) ≈ 7.0,7.8, 8.3) from Charbonnel et al. (2023) and for varying amounts of dilution with an ISM of standard composition. The dashed lines show an SMS model with 105 M⊙ from Nagele & Umeda (2023). |
| In the text | |
|
Fig. 9. Observed and predicted abundance ratios of N/C as a function of O/H for the six N-emitters and comparison samples from the literature. Observed data are shown using the same symbols as in Fig. 6, with model predictions given the same line styles as in Fig. 6. |
| In the text | |
Current usage metrics show cumulative count of Article Views (full-text article views including HTML views, PDF and ePub downloads, according to the available data) and Abstracts Views on Vision4Press platform.
Data correspond to usage on the plateform after 2015. The current usage metrics is available 48-96 hours after online publication and is updated daily on week days.
Initial download of the metrics may take a while.