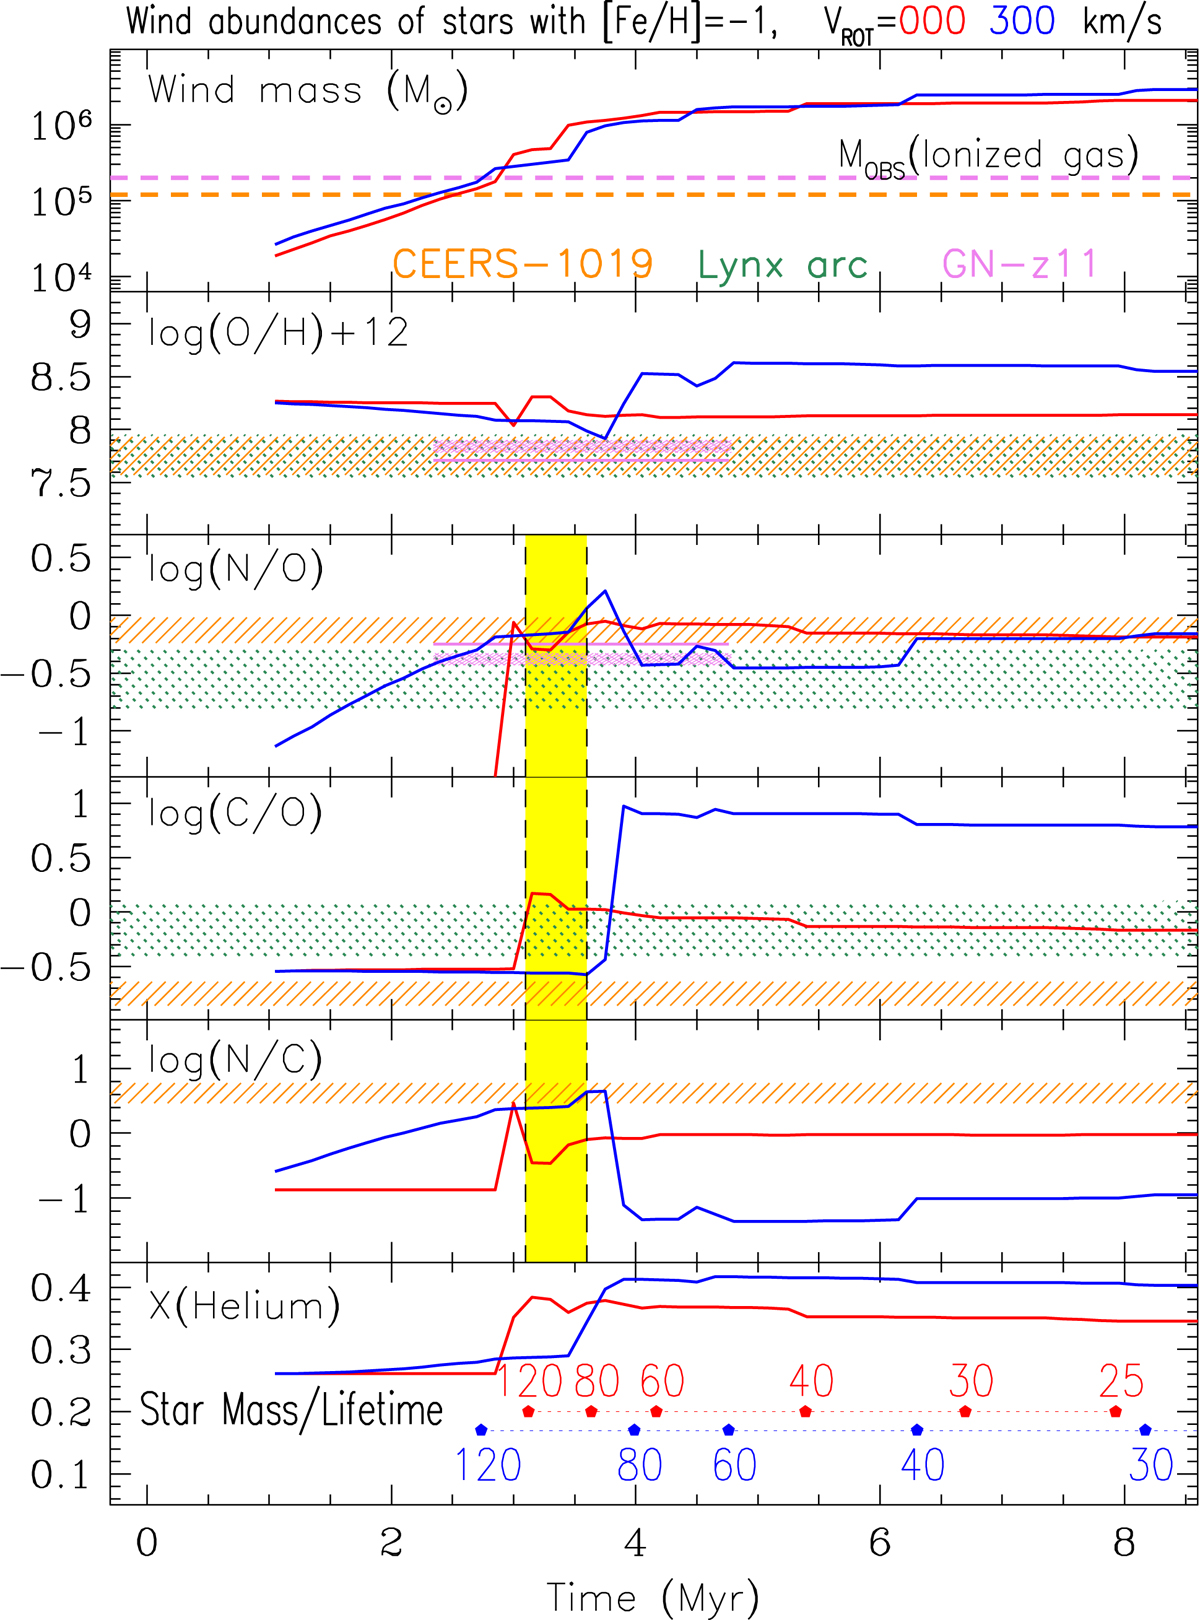
Fig. 7.
Download original image
Evolution of IMF-weighted time-integrated masses and abundances of the winds of a stellar population of total mass 108 M⊙created at t = 0, according to the models of Limongi & Chieffi (2018) with metallicity [Fe/H] = −1 and initial rotational velocity VROT = 300 km s−1 (solid blue curves) or 0 km s−1 (solid red curves) in all panels; practically no dilution with ambient ISM is assumed (99% of ejecta and 1% of ISM). Comparison is made to abundance data from CEERS-1019 (this work: orange shaded), Lynx arc (green shaded), and GN-z11 (Senchyna et al. 2023, violet shaded with age dermination). The two horizontal dashed lines in the top panel indicate the estimated mass of ionized gas observed in CEERS-1019 and GN-z11, respectively (see Sect. 4.7). The yellow shaded area indicates the short period (∼0.5 Myr) where all three abundance ratios for CEERS-1019 are well reproduced by the rotating massive star winds. In the bottom panel, displaying the evolution of the He mass fraction, the corresponding lifetimes of the stars are indicated (filled circles, color-coded for VROT = 0 and 300 km s−1) for selected masses (associated numbers in M⊙).
Current usage metrics show cumulative count of Article Views (full-text article views including HTML views, PDF and ePub downloads, according to the available data) and Abstracts Views on Vision4Press platform.
Data correspond to usage on the plateform after 2015. The current usage metrics is available 48-96 hours after online publication and is updated daily on week days.
Initial download of the metrics may take a while.