| Issue |
A&A
Volume 687, July 2024
|
|
|---|---|---|
| Article Number | L11 | |
| Number of page(s) | 6 | |
| Section | Letters to the Editor | |
| DOI | https://doi.org/10.1051/0004-6361/202450721 | |
| Published online | 05 July 2024 | |
Letter to the Editor
Discovery of a new N-emitter in the epoch of reionization
1
Observatoire de Genève, Université de Genève, Chemin Pegasi 51, 1290 Versoix, Switzerland
e-mail: This email address is being protected from spambots. You need JavaScript enabled to view it.
2
CNRS, IRAP, 14 Avenue E. Belin, 31400 Toulouse, France
Received:
14
May
2024
Accepted:
17
June
2024
Abstract
We report the discovery of a compact star-forming galaxy at z = 9.380 in the GOODS-North field (named GN-z9p4), which shows numerous strong UV-optical emission lines and a single UV line, N IV] λ1486. This makes GN-z9p4 the third-highest redshift N-emitter known to date. We determined the nebular abundances of H, C, N, O and Ne, along with the size and other physical properties of this object, then compared them to those of the other N-emitters known so far and to other star-forming galaxies. Using the direct method, we found a metallicity of 12 + log(O/H) = 7.37 ± 0.15, which stands as one of the lowest among N-emitters. The N/O abundance ratio is highly super-solar, while C/O and Ne/O are normal compared to other galaxies at low metallicity. We show that the compactness of GN-z9p4 (with an effective radius of 118 ± 16 pc at 2 μm) and other N-emitters translates to very high stellar mass and star formation rate (SFR) surface densities, which could serve as a criterium for identifying other N-emitters. Future studies and larger samples are needed to understand these rare, and enigmatic objects that have only recently been discovered.
Key words: galaxies: high-redshift / galaxies: ISM / dark ages / reionization / first stars
© The Authors 2024
 Open Access article, published by EDP Sciences, under the terms of the Creative Commons Attribution License (https://creativecommons.org/licenses/by/4.0), which permits unrestricted use, distribution, and reproduction in any medium, provided the original work is properly cited.
This article is published in open access under the Subscribe to Open model. This email address is being protected from spambots. You need JavaScript enabled to view it. to support open access publication.
1. Introduction
Arguably among the major surprises revealed by spectroscopic observations of the distant Universe with the James Webb Space Telescope (JWST) is the spectrum of the z = 10.6 galaxy GN-z11. It shows a very peculiar rest-UV spectrum dominated by N IV] λ1486 and N III] λ1750 lines, which are usually not seen, and by C III] λ1909 (Bunker et al. 2023). Quantitative analyses of the rest-UV and optical lines of this object swiftly demonstrated that the exceptional strength of the nitrogen lines indicate a high (super-solar) N/O abundance in an object with low metallicity (12 + log(O/H)≈7.6 − 8.0 Bunker et al. 2023; Cameron et al. 2023; Senchyna et al. 2024), which had essentially not been seen before. The peculiar abundances of GN-z11 have triggered numerous studies aimed at exploring the nucleosynthetic origin and physical processes which could explain its special abundance ratios. A similarity with Globular Cluster abundances has been noted (see Senchyna et al. 2024; Charbonnel et al. 2023). As of now, the following sources or scenarios have been proposed to explain the observed high N/O abundance of GN-z11: Wolf-Rayet Stars, very massive stars (∼100 − 400 M⊙), asymptotic giant branch (AGB) stars, supermassive stars (with masses of ≳103 − 4 M⊙ and of normal metallicity or Population III), Wolf–Rayet stars with intermittent star formation and a top-heavy initial mass function (IMF), or tidal disruption events (Bunker et al. 2023; Cameron et al. 2023; Charbonnel et al. 2023; Nagele & Umeda 2023; Watanabe et al. 2024; Kobayashi & Ferrara 2024; Bekki & Tsujimoto 2023; D’Antona et al. 2023; Vink 2023; Maiolino et al. 2024; Nandal et al. 2024). No concensus has yet been reached on this question; however, the possibility that N-emitters could be signposts of Globular clusters in formation, supermassive stars, or other “exotic” phenomena clearly reveals the interest in improving our understanding of these objects.
After the discovery of GN-z11, several groups have searched for more objects exhibiting N IV] λ1486 and/or N III] λ1750 emission lines (hereafter referred to as N-emitters) resulting in ten such objects, some of which were previously known: Mrk 996, the Sunburst cluster, the Lynx arc, SMACS 2031, GS_3073, RXCJ2248-4431, GLASS_150008, CEERS-1019, GN-z11, and GHZ2/GLASS-z12 (see Senchyna et al. 2024; Pascale et al. 2023; Marques-Chaves et al. 2024; Ji et al. 2024; Topping et al. 2024; Isobe et al. 2023; Castellano et al. 2024, and references therein). These objects include the core of a peculiar low-redshift dwarf galaxy (Mrk 996), strongly lensed clusters or star-forming regions at z ∼ 2 − 4, compact high-redshift galaxies from z ∼ 6 − 12, and one type 1 AGN at z = 5.55. Among this diverse crowd, all of them share super-solar N/O abundances, the presence of gas at unusually high densities, and metallicities of 12 + log(O/H)∼7.4 − 8.3.
Here, we report the discovery of a new N-emitter at z = 9.4 (named GN-z9p4), with the third highest redshift, whose rest-UV spectrum is dominated by N IV] λ1486. The available JWST observations allow us to determine accurate chemical abundances of H, N,O, Ne, and an upper limit on C. The source is among the most-metal poor N-emitter found so far – or even the most metal-poor of all. It is also very compact, suggesting that N-emitters may be exclusively found in regions of extremely high stellar mass and SFR densities.
2. GN-z9p4: A new N-emitter at high redshift
GN-z9p4 (α, δ [J2000] = 189.016995, 62.241582) was identified as a z ∼ 9.4 galaxy by one of the authors from searching the DAWN JWST Archive (DJA)1 database for distant galaxies. It was identified as an LBG earlier with a photometric redshift of z = 9.5 ± 0.4 by Oesch et al. (2014). Inspection of the available JWST/NIRSpec PRISM spectrum quickly revealed a peculiar rest-UV spectrum dominated by one line, which we identified later as N IV] λ1486.
2.1. JWST NIRSpec and NIRCam observations
The JWST/NIRSpec spectrum of GN-z9p4 was taken by the GTO program “NIRCam-NIRSpec galaxy assembly survey – GOODS-N” on February 7, 2023 with the low-resolution PRISM (R ≃ 100) and coverage ∼1 − 5 μm. The observations consist of slitlets of three shutters, with the three-point nod with an aperture position angle PA ≃ 19.58 deg (see details in Eisenstein et al. 2023). The total exposure time was 6127 s, split into 6 individual exposures of 14 groups each. The reduced spectrum, shown in Fig. 1, was obtained from the DJA database. The calibration reference data system context jwst_1183.pmap was used to correct spectra for flat-field and implement the wavelength and flux calibrations. Details of the data reduction are given in Heintz et al. (2024).
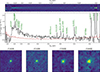 |
Fig. 1. JWST NIRSpec/PRISM 1D and 2D spectra of GN-z9p4 at z = 9.38 (top). The low-resolution spectrum is shown in black, and the 1σ uncertainty in red. Vertical dashed lines (green) mark the position of detected or un-detected nebular emission lines. X-axis at the bottom and top refer to the observed and rest-frame wavelengths in μm, respectively. Bottom panel shows “postage stamps” of a total size of 1″ × 1″ (corresponding 4.4 kpc × 4.4 kpc physical size at z = 9.38) of GN-z9p4 between 1.8 and 4.4 μm. |
GN-z9p4 was also observed with JWST/NIRCam with the F182M, F210M, F356W, and F444W filters. These images were obtained from DJA imaging data products and were reduced using the grizli reduction pipeline, which includes procedures for masking the snowball artifacts and minimizing the impact of 1/f noise. For the photometry, we proceeded following Weibel et al. (2024). GN-z9p4 shows a very compact morphology in all NIRCam filters, as quantified below.
To account for wavelength-dependent slit losses and absolute flux calibration, we derived the synthetic photometry of NIRSpec spectrum through each NIRCam filter bandpass and compared it to that obtained from observed photometry. We find that the synthetic flux densities match well, with an average offset of ≃16%, within the 1σ uncertainties of the PRISM spectrum; thus, no correction was made.
2.2. Emission line measurements
As shown in Fig. 1, GN-z9p4 shows a blue spectrum, strong emission lines in the rest-frame optical, and a single clear emission line detection in the rest-UV. The systemic redshift of GN-z9p4 derived from the rest-optical lines (centroids of Hβ, [O III] λλ4959,5007) is zsys = 9.37956 ± 0.00017. The rest-UV line is therefore clearly identified as N IV] λ1486. Since this is the strongest rest-UV line, we classify this galaxy as a N-emitter, in analogy with the other rare objects recently discovered with the JWST (see above). After GLASS-z12 at z = 12.342 and GN-z11 at z = 10.6, this detection makes GN-z9p4 the third most distant galaxy among the class of rare N-emitters, which now counts 6 objects at z > 6 (see Castellano et al. 2024; Bunker et al. 2023; Marques-Chaves et al. 2024; Topping et al. 2024; Isobe et al. 2023) and 11 in total.
The rest-optical spectrum of GN-z9p4 shows H lines from the Balmer series, [O II] λ3727, [O III] λλ4959,5007, the auroral [O III]λ4363, and [Ne III] λ3869+He I, which have frequently been seen in JWST spectra to date. In total, we detected ten emission lines with a significance larger than 3σ. To measure the line fluxes, we simultaneously fit the Gaussian profiles and a power-law to the continuum, as described in Marques-Chaves et al. (2024). Table 1 summarizes our flux and rest-frame equivalent width measurements, as well as the upper limits for several important lines. We note that GN-z9p4 exhibits very strong lines, with equivalent widths exceeding largely those of the previously identified N-emitters at z > 8 (CEERS-1019, GN-z11, GLASS-z12). The Balmer lines are compatible with no extinction, although with large uncertainties, allowing for 0 ≤ E(B − V)≲0.2.
Emission line flux (in 10−18 erg s−1 cm−2) and equivalent width (in Å) measurements or 3σ upper limits for GN-z9p4.
3. Physical properties of GN-z9p4 and other N-emitters
3.1. Nature of GN-z9p4
Here, we consider what is powering the emission lines of GN-z9p4. None of the high-ionization lines that are characteristic for active galactic nuclei (AGNs) have been detected. For He II we derive a 3σ upper limit He II/Hβ ≤ 0.16, and [Ne V] λ3427 was not detected with [Ne V] λ3427/[Ne III] λ3869 ≲ 0.28 either. Both of these limits are close to the SF/AGN boundary or in the “composite” range and compatible with photoionization by stars (Shirazi & Brinchmann 2012; Cleri et al. 2023). Classical optical diagnostics (the so-called BPT diagrams) and rest-UV emission line diagnostics are not available for GN-z9p4, since the required lines are not detected or not covered by the NIRSpec observations. In fact, all observed emission line ratios are typical of compact, metal-poor star-forming galaxies, as can be seen by a simple comparison with Schaerer et al. (2022), showing SDSS measurements from Izotov et al. (2021). Finally, the spectrum of source shows no broad lines, although the resolution is low. More precisely, we measured a full width at half maximum of FWHM(Hβ) = 434 ± 65 km s−1, which is basically unresolved. Also, we did not detect any significant broad component in Hβ, [O III] λλ4959,5007, or other lines. This excludes a substantial contribution of a type 1 AGN (FWHM > 1000 km s−1); for instance, if a type-1 AGN contributes > 50% of the Hβ flux, we would expect FWHM(Hβ) > 700 km s−1. In short, from the available data, we find no indication that an AGN is present. The emission lines are compatible with those of metal-poor star-forming galaxies, although better spectra may be needed to establish this more firmly.
3.2. Ionic and total metal abundances
With a 4.3σ detection of the auroral [O III]λ4363 line, it is possible to determine accurate abundances of the interstellar medium (ISM) in GN-z9p4, using the direct method, following Izotov et al. (2006). The electron temperature Te(O III) is used to obtain abundances of ions O2+, N3+, Ne2+, along with upper limits for C3+ and C2+. The temperature in the low-ionization region, Te(O II) was used to derive the ionic abundance of O+. In the absence of direct constraints on the electron density, we adopted ne = 100 cm−3 (low-density regime). For densities of ne ≲ 105 cm−3, our results are essentially unchanged (abundance ratios approximately within the quoted uncertainties). Ionic abundances were derived following Izotov et al. (2006) for the optical lines. For Ne2+, we used the ionization correction factor (ICF) following Izotov et al. (2006). The N3+/H+ abundance was determined from the N IV]/Hβ ratio, and upper limits on the carbon abundance from the C III] and C IV intensities with respect to Hβ, following Villar-Martín et al. (2004). The results are listed in Table 2 (assuming no extinction), while the CNO abundances are shown and compared to other objects in Fig. 2. Adopting the median extinction from SED fits does not alter O/H, but would imply an increase of N/O (the C/O limit) by a factor ∼2 (1.6).
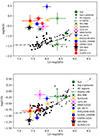 |
Fig. 2. Observed chemical abundances of all known N-emitters including GN-z9p4. Top: N/O versus O/H, bottom: C/O versus O/H. GN-z9p4 is shown by a black star. The N-emitters are sorted by increasing redshift in the legend. Only one measurement (for the densest region) is shown for GS_3073. For Mrk 996, two N/O are available, probing regions of low and high density (James et al. 2009). Low-z star-forming galaxies and HII regions from the compilation of Izotov et al. (2023) are shown by small black symbols. The dash-dotted line shows the average trend observed in low-z star-forming galaxies, as parametrized by Vila-Costas & Edmunds (1993) for N/O and C/O by Dopita et al. (2006), respectively. |
ISM properties, along with the ionic and total heavy element abundances (derived assuming no extinction), plus other properties of GN-z9p4.
We derived a total oxygen abundance of 12 + log(O/H) = 7.37 ± 0.15, which is approximately 5% solar (assuming a solar value of 12 + log(O/H) = 8.69; Asplund et al. 2009), dominated by the ionic abundance of O2+/H+. This makes GN-z9p4 the N-emitter with the lowest metallicity value determined from the direct method. The ionic abundance of N3+ indicates a very high N/O abundance (log(N3+/O)−0.59 ± 0.24), approximately 1.9 times solar, for the low metallicity (cf. Asplund et al. 2021). From the non-detection of the carbon lines, we derived an upper limit of log(C/O) < − 1.18; this result is sub-solar, but fairly representative of C/O in other metal-poor galaxies (Izotov et al. 2023). Finally, the neon abundance ratio log(Ne/O) = − 0.75 ± 0.08 is compatible with the average value of log(Ne/O) = − 0.80 ± 0.01 determined for normal star-forming galaxies by Guseva et al. (2011) at the same metallicity.
Together with the strongly lensed star-forming clump RXCJ2248-4431 at z = 6.1, where the metallicity has also been measured from the direct method (Topping et al. 2024), and with GHZ2 at z = 12.34 (Castellano et al. 2024; Zavala et al. 2024), where the metallicity is inferred indirectly, GN-z9p4 is among the lowest metallicity N-emitters known thus far.
Taken together, the derived abundances of GN-z9p4 show that this object has a “metallicity” (O/H) of approximately 5% solar, a very high N/O abundance, and a fairly normal C/O abundance, when compared to galaxies of similar metallicity (see Fig. 2). These unusual abundance patterns are shared with the other known N-emitters, which are also shown in color in this figure. The origin of the observed N-enrichment and other abundance ratios has been discussed earlier (see the introduction), and is subject of intense research. However, a discussion of this topic is beyond the scope of this Letter.
For very high electron densities, ne > 105 cm−3, the inferred electron temperature would be lower, leading to a higher O/H and even more extreme (higher) N/O and C/O ratios, further highlighting the peculiarity of this source.
3.3. Compactness, mass, and SFR surface density of GN-z9p4
We investigated the morphology of GN-z9p4 using the PySersic code (Pasha & Miller 2023) to fit its light distribution in the four NIRCam filters. This process uses a 2D Gaussian function convolved to the instrumental point spread function (PSF) obtained from nearby bright stars in the NIRCam field of view. The fitting process was performed on ≃2″ × 2″ background-subtracted cutouts centered on GN-z9p4. To check whether the source is spatially resolved, we compared the residuals obtained from the best-fit model using a Gaussian profile to that obtained with a point source. We find that GN-z9p4 is compact, but resolved in the NIRCam F182M and F210M bands, for which we obtained a consistent effective radius of reff = 118 ± 16 pc. At longer wavelengths, the best-fit models assuming Gaussian and point source profiles both yield similar residuals, suggesting that GN-z9p4 is unresolved in F356W and F444W (reff < 190 pc).
To determine the main properties of the stellar content of GN-z9p4, we have used the CIGALE and Bagpipes codes of Boquien et al. (2019), Carnall et al. (2018) to fit the multi-band SED, and we have added fluxes of the main emission lines and/or the full PRISM spectrum in the fits. The redshift and metallicity are fixed and a variety of star-formation histories and attenuation laws were explored2. The overall results do not strongly depend on these assumptions, particularly since the spectrum is largely dominated by a young stellar population from the rest-UV to 5.4 μm. For this reason, the stellar mass is still fairly uncertain. All SED fits indicate the presence of some dust attenuation. The main quantities derived using the SMC extinction law are summarized in Table 2.
3.4. N-emitters are compact and rare
As noticed early on, N-emitters show high ISM densities (ne ∼ 103 − 5 cm−3) or indications of regions with different densities, including densities spanning a wide range all the way up to high densities (see Patrício et al. 2016; Ji et al. 2024). No density diagnostic is available from the PRISM spectrum of GN-z9p4, but we suspect that it also contains some gas at high electron densities.
Another property shared by N-emitters is their compactness, as illustrated in Fig. 3, where we show the stellar mass and SFR surface density of these objects, compared to those of star-forming galaxies at 5 < z < 14 measured by Morishita et al. (2024) using JWST observations. For the N-emitters, its is important to note that these quantities were not determined in a uniform fashion, since, for example, different assumptions were made for the SED fits to derive stellar masses and, most importantly, the effective spatial resolution is much higher for lensed objects. Despite this, it is clear that the N-emitters are exclusively found among the sources with the highest stellar mass and SFR surface densities, which indicates that the observed strong N-enhancement is related to or found in the most compact star-forming regions or objects. If confirmed with larger statistical samples, this suggests that the source of N-enhancement or the physical processes leading to a high N/O abundance require very high mass and/or SFR surface densities. These properties, coupled with the high ISM densities observed for N-emitters, could represent interesting constraints for distinguishing different scenarios to explain their origin.
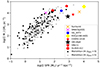 |
Fig. 3. Observed mass and SFR surface densities of the known N-emitters including GN-z9p4, compared to the sample of 341 star-forming galaxies at 5 < z < 14 observed with JWST, analysed by Morishita et al. (2024). Among this group, objects with spectroscopic and photometric redshifts have been distinguished. |
Interestingly, several other objects from the JWST sample analysed by Morishita et al. (2024) occupy the same area as the known N-emitters and are also covered by spectroscopic observations. We have therefore examined the available NIRSpec PRISM spectra, finding one or two possible new N-emitters, although the quality of the spectra is limited. This indicates that a selection by stellar mass and SFR surface density could be an efficient way to find new N-emitters.
The discovery of ∼2 N-emitters among the 109 galaxies of Morishita et al. (2024) with JWST spectra shows that these objects are rare, even at high-redshift (z > 5). This is also evident from the fact that the nitrogen lines in the UV (N IV] λ1486, N III] λ1750) are not detected in stacked NIRSpec spectra of z > 5 galaxies (Roberts-Borsani et al. 2024; Langeroodi & Hjorth 2024). These current data indicate that approximately 7 out of 500 (∼1 − 2%) galaxies spectroscopically covered by JWST are N-emitters. This simple estimate should, however, be taken with a grain of salt, since no systematic search has yet (to the best of our knowledge) been undertaken for these sources. In addition, the target selection function is not well known and the depth and signal-to-noise ratios (S/N) of the various observations vary strongly. Proper statistical studies of the occurrence of the N-emitters ought to be carried out in the future.
4. Conclusions
Based on our examinaton of JWST/NIRSpec PRISM observations, we have identified a compact star-forming galaxy at z = 9.436 in the GOODS-North field that exhibits numerous strong UV-optical emission lines and a single UV line, N IV] λ1486. These properties have qualified this object as a new N-emitter. This brings the total number of these rare and enigmatic objects found thus far to 11.
From the emission lines, including the auroral [O III]λ4363 line, we have determined the abundances of H, N, O, Ne, and an upper limit on C, finding 12 + log(O/H) = 7.37 ± 0.15, N/O = − 0.59 ± 0.24, Ne/O = − 0.75 ± 0.08, and C/O < − 1.18. These properties make GN-z9p4 the third highest-redshift (after GLASS-z12 and GN-z11) and one of the most metal-poor N-emitters (with RXCJ2248 and possibly GLASS-z12) known so far.
With a super-solar N/O abundance ratio and a fairly normal C/O for low-metallicity (O/H), the observed ISM abundances of GN-z9p4 are found to be similar to most of the previously identified N-emitters, whose origin is debated. Comparing the stellar mass and SFR surface densities of the known N-emitters with those of star-forming galaxies, we have shown that N-emitters are exclusively found at the high-end tail of the distribution (typically with log(ΣM⋆)≳3.5 M⊙ pc−2 and log(ΣSFR)≳2 M⊙ yr−1 kpc−2), indicating that this phenomenon probably requires peculiar conditions (e.g. high ISM densities and compact regions), physical processes or “exotic” sources of nucleosynthesis.
Finally, we estimate that approximately ∼1 − 2% of the galaxies currently observed with JWST at z ≳ 5 are N-emitters, demonstrating the rarity of these objects. We also speculate that this phenomenon could be more frequent at higher redshifts.
We adopt a concordance cosmology with Ωm = 0.272, ΩΛ = 0.728, and H0 = 70.4 km s−1 Mpc−1. We have explored exponentially declining and delayed star formation histories, as well as the Calzetti and SMC attenuation and extinction laws.
References
- Asplund, M., Grevesse, N., Sauval, A. J., & Scott, P. 2009, ARA&A, 47, 481 [NASA ADS] [CrossRef] [Google Scholar]
- Asplund, M., Amarsi, A. M., & Grevesse, N. 2021, A&A, 653, A141 [NASA ADS] [CrossRef] [EDP Sciences] [Google Scholar]
- Bekki, K., & Tsujimoto, T. 2023, MNRAS, 526, L26 [NASA ADS] [CrossRef] [Google Scholar]
- Boquien, M., Burgarella, D., Roehlly, Y., et al. 2019, A&A, 622, A103 [NASA ADS] [CrossRef] [EDP Sciences] [Google Scholar]
- Bunker, A. J., Saxena, A., Cameron, A. J., et al. 2023, A&A, 677, A88 [NASA ADS] [CrossRef] [EDP Sciences] [Google Scholar]
- Cameron, A. J., Katz, H., Rey, M. P., & Saxena, A. 2023, MNRAS, 523, 3516 [NASA ADS] [CrossRef] [Google Scholar]
- Carnall, A. C., McLure, R. J., Dunlop, J. S., & Davé, R. 2018, MNRAS, 480, 4379 [Google Scholar]
- Castellano, M., Napolitano, L., Fontana, A., et al. 2024, ApJ, submitted [arXiv:2403.10238] [Google Scholar]
- Charbonnel, C., Schaerer, D., Prantzos, N., et al. 2023, A&A, 673, L7 [NASA ADS] [CrossRef] [EDP Sciences] [Google Scholar]
- Cleri, N. J., Olivier, G. M., Hutchison, T. A., et al. 2023, ApJ, 953, 10 [NASA ADS] [CrossRef] [Google Scholar]
- D’Antona, F., Vesperini, E., Calura, F., et al. 2023, A&A, 680, L19 [NASA ADS] [CrossRef] [EDP Sciences] [Google Scholar]
- Dopita, M. A., Fischera, J., Sutherland, R. S., et al. 2006, ApJS, 167, 177 [NASA ADS] [CrossRef] [Google Scholar]
- Eisenstein, D. J., Willott, C., Alberts, S., et al. 2023, ApJS, submitted [arXiv:2306.02465] [Google Scholar]
- Guseva, N. G., Izotov, Y. I., Stasińska, G., et al. 2011, A&A, 529, A149 [NASA ADS] [CrossRef] [EDP Sciences] [Google Scholar]
- Heintz, K. E., Brammer, G. B., Watson, D., et al. 2024, A&A, submitted [arXiv:2404.02211] [Google Scholar]
- Isobe, Y., Ouchi, M., Tominaga, N., et al. 2023, ApJ, 959, 100 [NASA ADS] [CrossRef] [Google Scholar]
- Izotov, Y. I., Stasińska, G., Meynet, G., Guseva, N. G., & Thuan, T. X. 2006, A&A, 448, 955 [CrossRef] [EDP Sciences] [Google Scholar]
- Izotov, Y. I., Guseva, N. G., Fricke, K. J., et al. 2021, A&A, 646, A138 [NASA ADS] [CrossRef] [EDP Sciences] [Google Scholar]
- Izotov, Y. I., Schaerer, D., Worseck, G., et al. 2023, MNRAS, 522, 1228 [NASA ADS] [CrossRef] [Google Scholar]
- James, B. L., Tsamis, Y. G., Barlow, M. J., et al. 2009, MNRAS, 398, 2 [Google Scholar]
- Ji, X., Übler, H., Maiolino, R., et al. 2024, MNRAS, submitted [arXiv:2404.04148] [Google Scholar]
- Kobayashi, C., & Ferrara, A. 2024, ApJ, 962, L6 [NASA ADS] [CrossRef] [Google Scholar]
- Langeroodi, D., & Hjorth, J. 2024, ApJL, submitted [arXiv:2404.13045] [Google Scholar]
- Maiolino, R., Scholtz, J., Witstok, J., et al. 2024, Nature, 627, 59 [NASA ADS] [CrossRef] [Google Scholar]
- Marques-Chaves, R., Schaerer, D., Kuruvanthodi, A., et al. 2024, A&A, 681, A30 [NASA ADS] [CrossRef] [EDP Sciences] [Google Scholar]
- Morishita, T., Stiavelli, M., Chary, R.-R., et al. 2024, ApJ, 963, 9 [NASA ADS] [CrossRef] [Google Scholar]
- Nagele, C., & Umeda, H. 2023, ApJ, 949, L16 [NASA ADS] [CrossRef] [Google Scholar]
- Nandal, D., Regan, J. A., Woods, T. E., et al. 2024, A&A, 683, A156 [NASA ADS] [CrossRef] [EDP Sciences] [Google Scholar]
- Oesch, P. A., Bouwens, R. J., Illingworth, G. D., et al. 2014, ApJ, 786, 108 [Google Scholar]
- Pascale, M., Dai, L., McKee, C. F., & Tsang, B. T.-H. 2023, ApJ, 957, 77 [NASA ADS] [CrossRef] [Google Scholar]
- Pasha, I., & Miller, T. B. 2023, J. Open Source Softw., 8, 5703 [NASA ADS] [CrossRef] [Google Scholar]
- Patrício, V., Richard, J., Verhamme, A., et al. 2016, MNRAS, 456, 4191 [Google Scholar]
- Roberts-Borsani, G., Treu, T., Shapley, A., et al. 2024, ApJ, submitted [arXiv:2403.07103] [Google Scholar]
- Schaerer, D., Marques-Chaves, R., Barrufet, L., et al. 2022, A&A, 665, L4 [NASA ADS] [CrossRef] [EDP Sciences] [Google Scholar]
- Senchyna, P., Plat, A., Stark, D. P., et al. 2024, ApJ, 966, 92 [NASA ADS] [CrossRef] [Google Scholar]
- Shirazi, M., & Brinchmann, J. 2012, MNRAS, 421, 1043 [NASA ADS] [CrossRef] [Google Scholar]
- Topping, M. W., Stark, D. P., Senchyna, P., et al. 2024, MNRAS, 529, 3301 [NASA ADS] [CrossRef] [Google Scholar]
- Vila-Costas, M. B., & Edmunds, M. G. 1993, MNRAS, 265, 199 [NASA ADS] [CrossRef] [Google Scholar]
- Villar-Martín, M., Cerviño, M., & González Delgado, R. M. 2004, MNRAS, 355, 1132 [CrossRef] [Google Scholar]
- Vink, J. S. 2023, A&A, 679, L9 [NASA ADS] [CrossRef] [EDP Sciences] [Google Scholar]
- Watanabe, K., Ouchi, M., Nakajima, K., et al. 2024, ApJ, 962, 50 [NASA ADS] [CrossRef] [Google Scholar]
- Weibel, A., Oesch, P. A., Barrufe, L., et al. 2024, MNRAS, submitted [arXiv:2403.08872] [Google Scholar]
- Zavala, J. A., Castellano, M., Akins, H. B., et al. 2024, arXiv e-prints [arXiv:2403.10491] [Google Scholar]
All Tables
Emission line flux (in 10−18 erg s−1 cm−2) and equivalent width (in Å) measurements or 3σ upper limits for GN-z9p4.
ISM properties, along with the ionic and total heavy element abundances (derived assuming no extinction), plus other properties of GN-z9p4.
All Figures
|
Fig. 1. JWST NIRSpec/PRISM 1D and 2D spectra of GN-z9p4 at z = 9.38 (top). The low-resolution spectrum is shown in black, and the 1σ uncertainty in red. Vertical dashed lines (green) mark the position of detected or un-detected nebular emission lines. X-axis at the bottom and top refer to the observed and rest-frame wavelengths in μm, respectively. Bottom panel shows “postage stamps” of a total size of 1″ × 1″ (corresponding 4.4 kpc × 4.4 kpc physical size at z = 9.38) of GN-z9p4 between 1.8 and 4.4 μm. |
| In the text | |
|
Fig. 2. Observed chemical abundances of all known N-emitters including GN-z9p4. Top: N/O versus O/H, bottom: C/O versus O/H. GN-z9p4 is shown by a black star. The N-emitters are sorted by increasing redshift in the legend. Only one measurement (for the densest region) is shown for GS_3073. For Mrk 996, two N/O are available, probing regions of low and high density (James et al. 2009). Low-z star-forming galaxies and HII regions from the compilation of Izotov et al. (2023) are shown by small black symbols. The dash-dotted line shows the average trend observed in low-z star-forming galaxies, as parametrized by Vila-Costas & Edmunds (1993) for N/O and C/O by Dopita et al. (2006), respectively. |
| In the text | |
|
Fig. 3. Observed mass and SFR surface densities of the known N-emitters including GN-z9p4, compared to the sample of 341 star-forming galaxies at 5 < z < 14 observed with JWST, analysed by Morishita et al. (2024). Among this group, objects with spectroscopic and photometric redshifts have been distinguished. |
| In the text | |
Current usage metrics show cumulative count of Article Views (full-text article views including HTML views, PDF and ePub downloads, according to the available data) and Abstracts Views on Vision4Press platform.
Data correspond to usage on the plateform after 2015. The current usage metrics is available 48-96 hours after online publication and is updated daily on week days.
Initial download of the metrics may take a while.