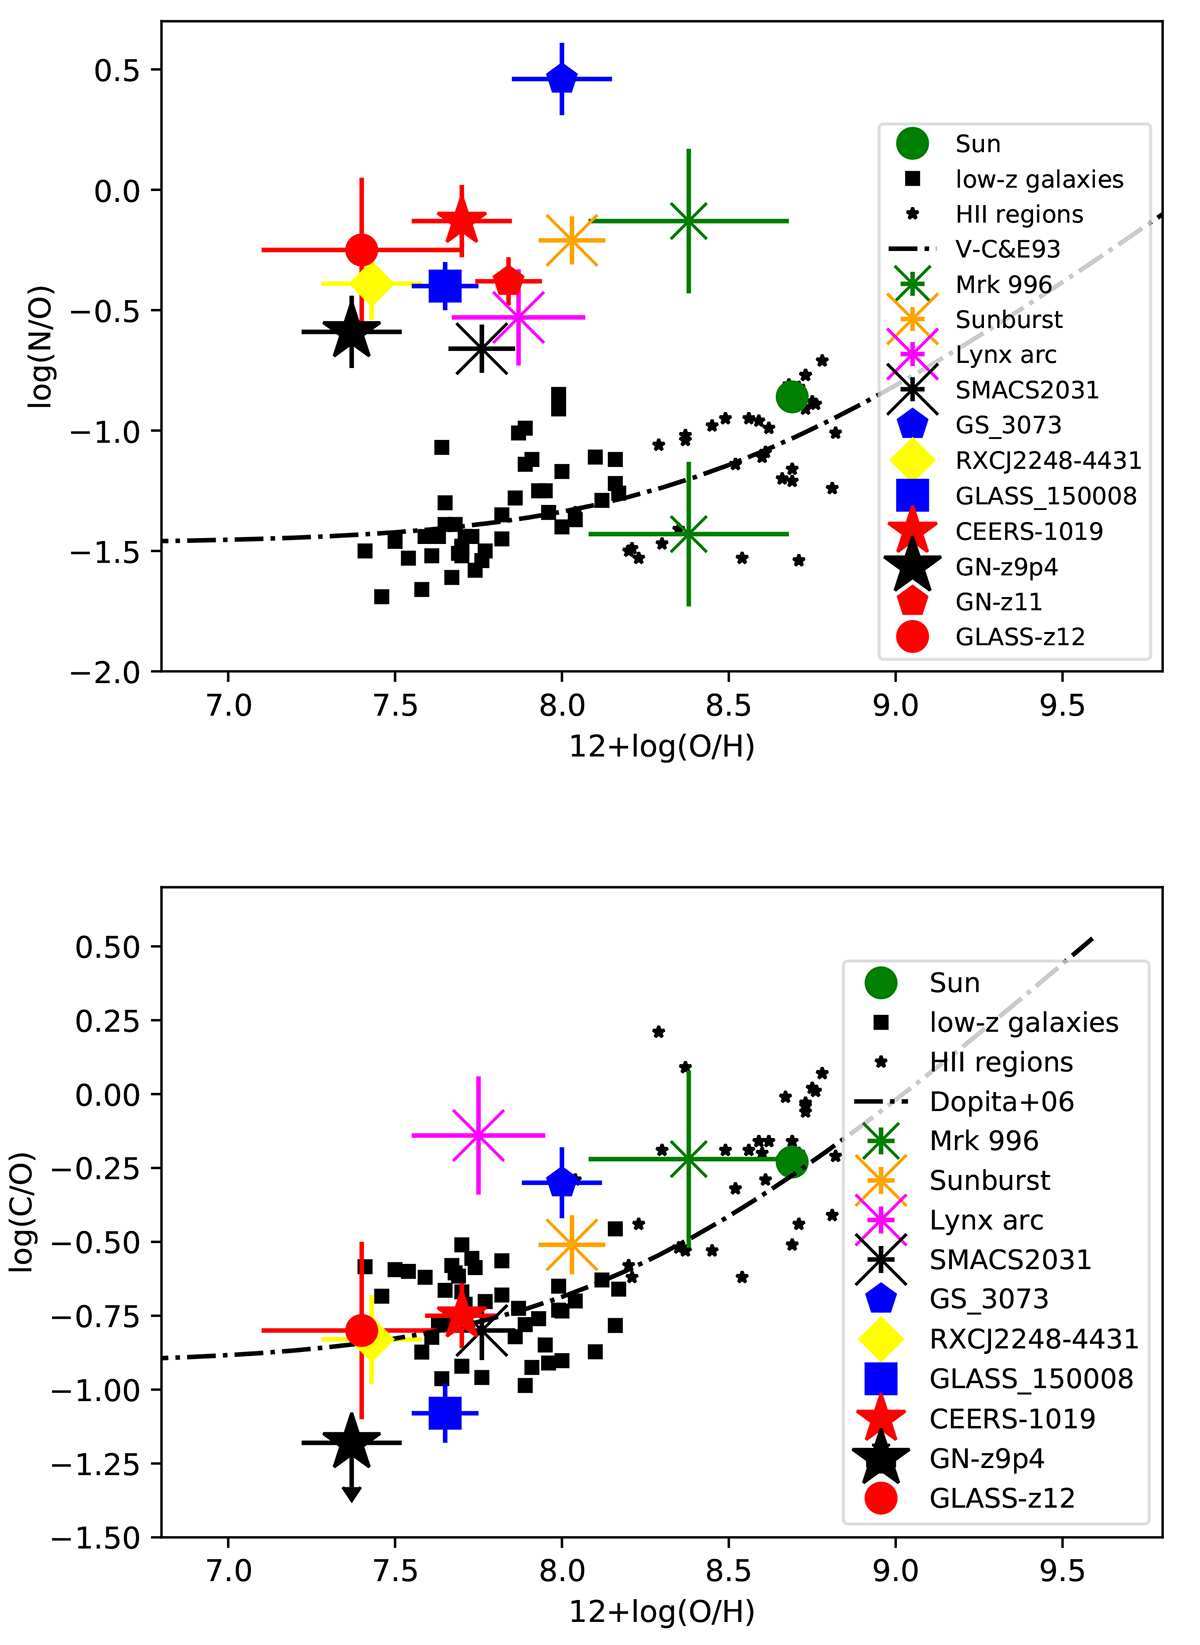
Fig. 2.
Download original image
Observed chemical abundances of all known N-emitters including GN-z9p4. Top: N/O versus O/H, bottom: C/O versus O/H. GN-z9p4 is shown by a black star. The N-emitters are sorted by increasing redshift in the legend. Only one measurement (for the densest region) is shown for GS_3073. For Mrk 996, two N/O are available, probing regions of low and high density (James et al. 2009). Low-z star-forming galaxies and HII regions from the compilation of Izotov et al. (2023) are shown by small black symbols. The dash-dotted line shows the average trend observed in low-z star-forming galaxies, as parametrized by Vila-Costas & Edmunds (1993) for N/O and C/O by Dopita et al. (2006), respectively.
Current usage metrics show cumulative count of Article Views (full-text article views including HTML views, PDF and ePub downloads, according to the available data) and Abstracts Views on Vision4Press platform.
Data correspond to usage on the plateform after 2015. The current usage metrics is available 48-96 hours after online publication and is updated daily on week days.
Initial download of the metrics may take a while.