Fig. 1.
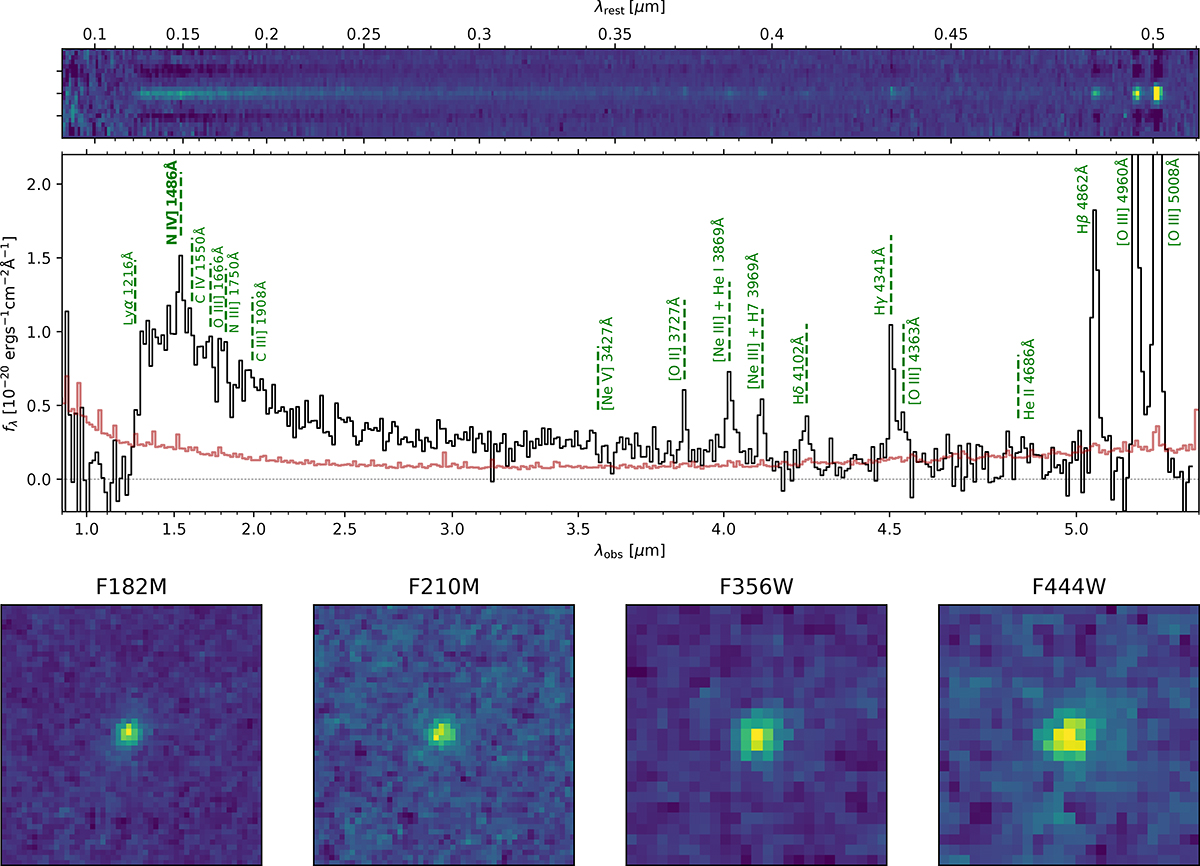
Download original image
JWST NIRSpec/PRISM 1D and 2D spectra of GN-z9p4 at z = 9.38 (top). The low-resolution spectrum is shown in black, and the 1σ uncertainty in red. Vertical dashed lines (green) mark the position of detected or un-detected nebular emission lines. X-axis at the bottom and top refer to the observed and rest-frame wavelengths in μm, respectively. Bottom panel shows “postage stamps” of a total size of 1″ × 1″ (corresponding 4.4 kpc × 4.4 kpc physical size at z = 9.38) of GN-z9p4 between 1.8 and 4.4 μm.
Current usage metrics show cumulative count of Article Views (full-text article views including HTML views, PDF and ePub downloads, according to the available data) and Abstracts Views on Vision4Press platform.
Data correspond to usage on the plateform after 2015. The current usage metrics is available 48-96 hours after online publication and is updated daily on week days.
Initial download of the metrics may take a while.