Fig. 5.
Download original image
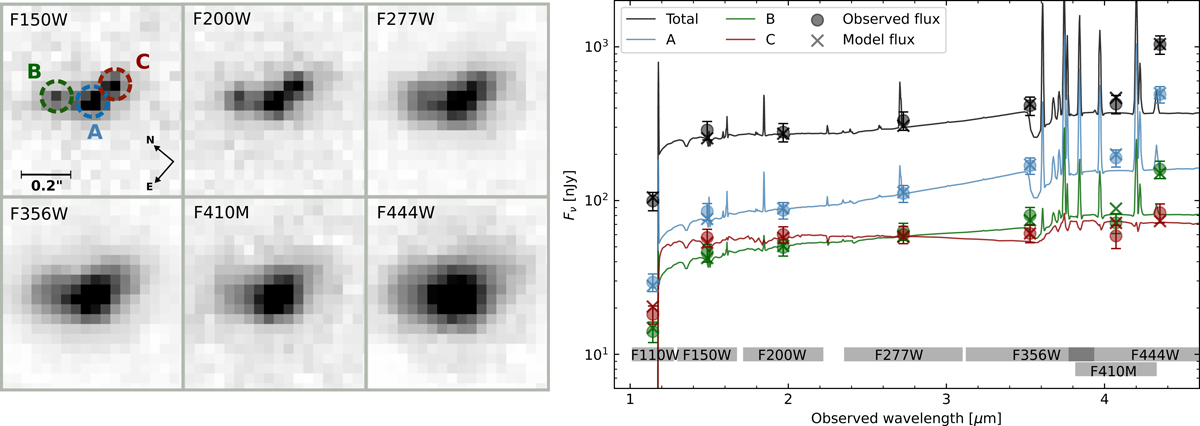
Multi-wavelength analysis of CEERS-1019. The left panel shows cutout images around CEERS-1019 in the NIRCam filters. In the F150W sub-panel, we show the positions of the three compact clumps resolved only at short wavelength, labeled A, B, and C (blue, green, and red, respectively) The right panel shows the SED best-fit models using CIGALE (Boquien et al. 2019) of the integrated light of CEERS-1019 (“total” in black), as well as the individual clumps (A, B, and C in blue, green, and red, respectively). Observed fluxes are marked with circles, while the predicted fluxes from the best fit are marked with crosses.
Current usage metrics show cumulative count of Article Views (full-text article views including HTML views, PDF and ePub downloads, according to the available data) and Abstracts Views on Vision4Press platform.
Data correspond to usage on the plateform after 2015. The current usage metrics is available 48-96 hours after online publication and is updated daily on week days.
Initial download of the metrics may take a while.