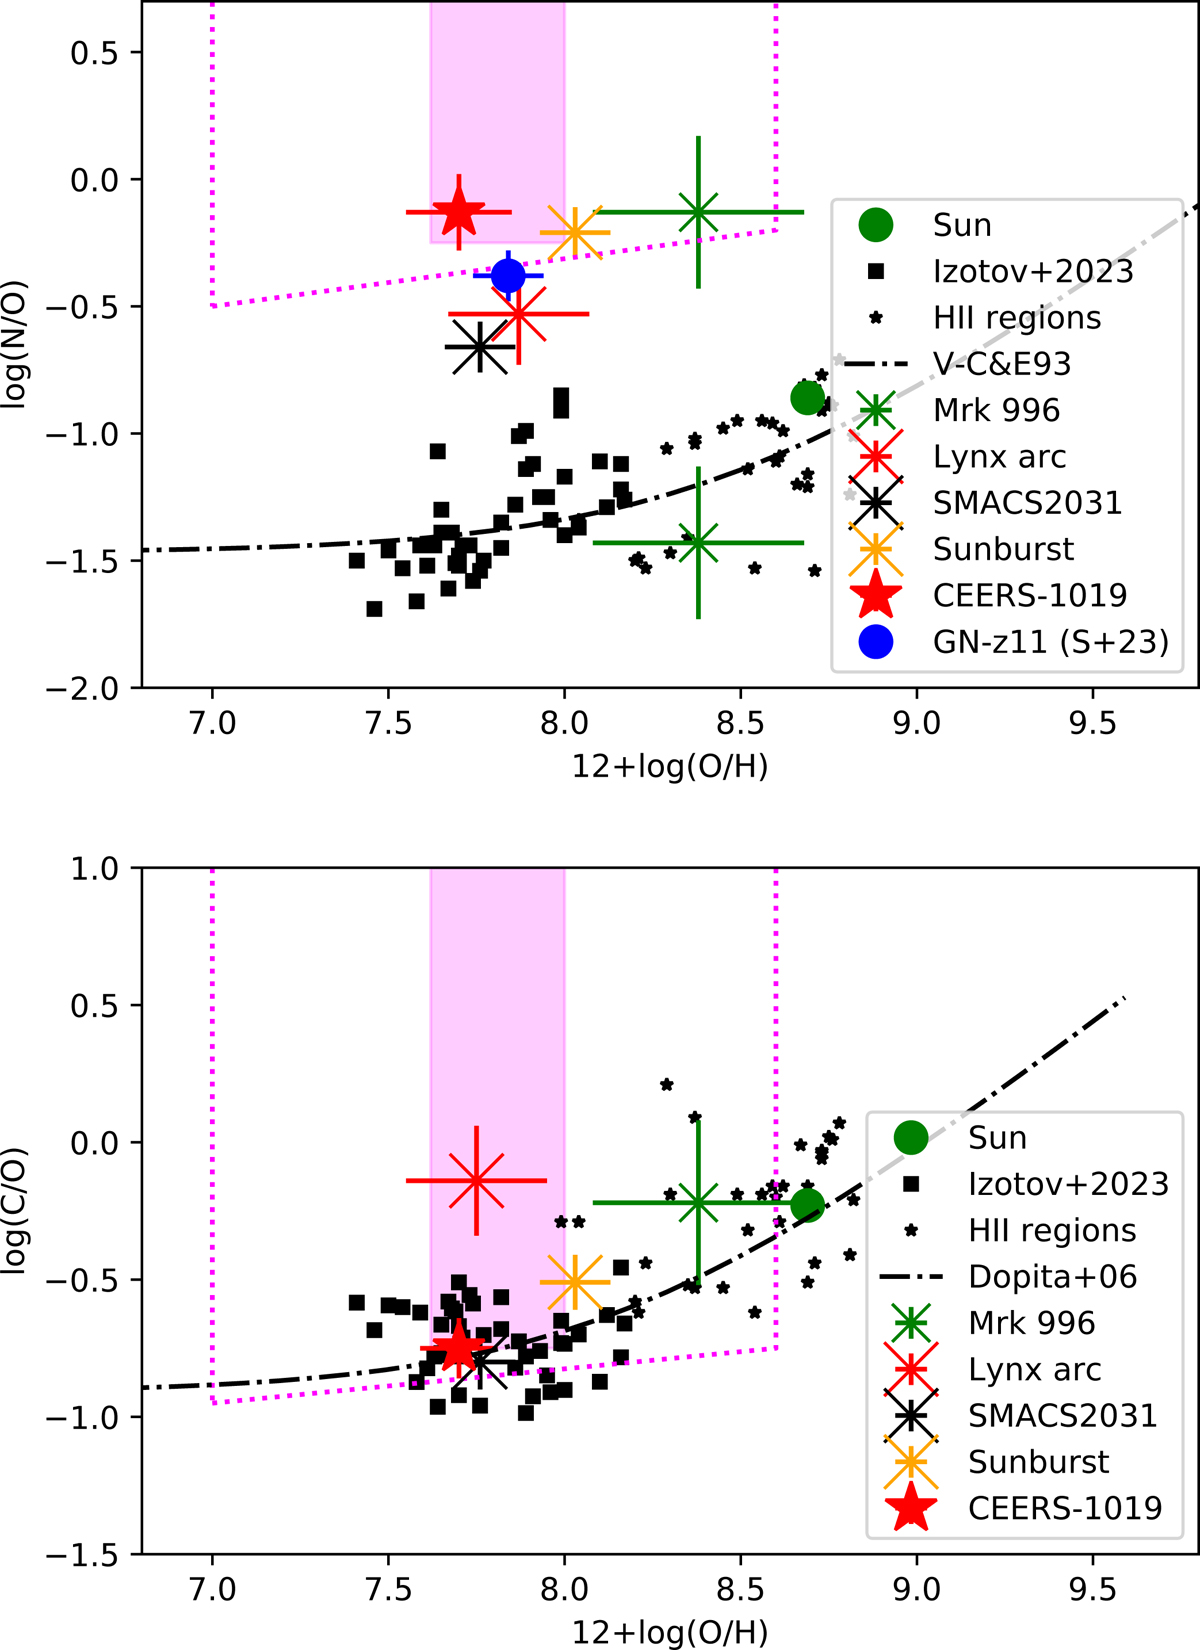
Fig. 6.
Download original image
Observed chemical abundances of the six N-emitters and comparison samples from the literature. Top: N/O versus O/H. Bottom: C/O versus O/H. CEERS-1019 is shown by a red star, GN-z11 by a blue circle. The z ∼ 2.6 − 3 lensed galaxies: Lynx arc, SMACS2023, and the Sunburst cluster are shown with red, black, and orange crosses, the low-z galaxy Mrk 996 is marked with a green cross (two N/O values from James et al. 2009 for the central region and from the total galaxy). The magenta shaded region and outlined box indicate the range of abundances allowed for GN-z11, according to Cameron et al. (2023a). Low-z star-forming galaxies and HII regions from the compilation of Izotov et al. (2023) are shown by small black symbols. The dash-dotted line shows the average trend observed in low-z star-forming galaxies, as parametrized by Vila-Costas & Edmunds (1993) for N/O and C/O by Dopita et al. (2006), respectively.
Current usage metrics show cumulative count of Article Views (full-text article views including HTML views, PDF and ePub downloads, according to the available data) and Abstracts Views on Vision4Press platform.
Data correspond to usage on the plateform after 2015. The current usage metrics is available 48-96 hours after online publication and is updated daily on week days.
Initial download of the metrics may take a while.