Fig. 3.

Download original image
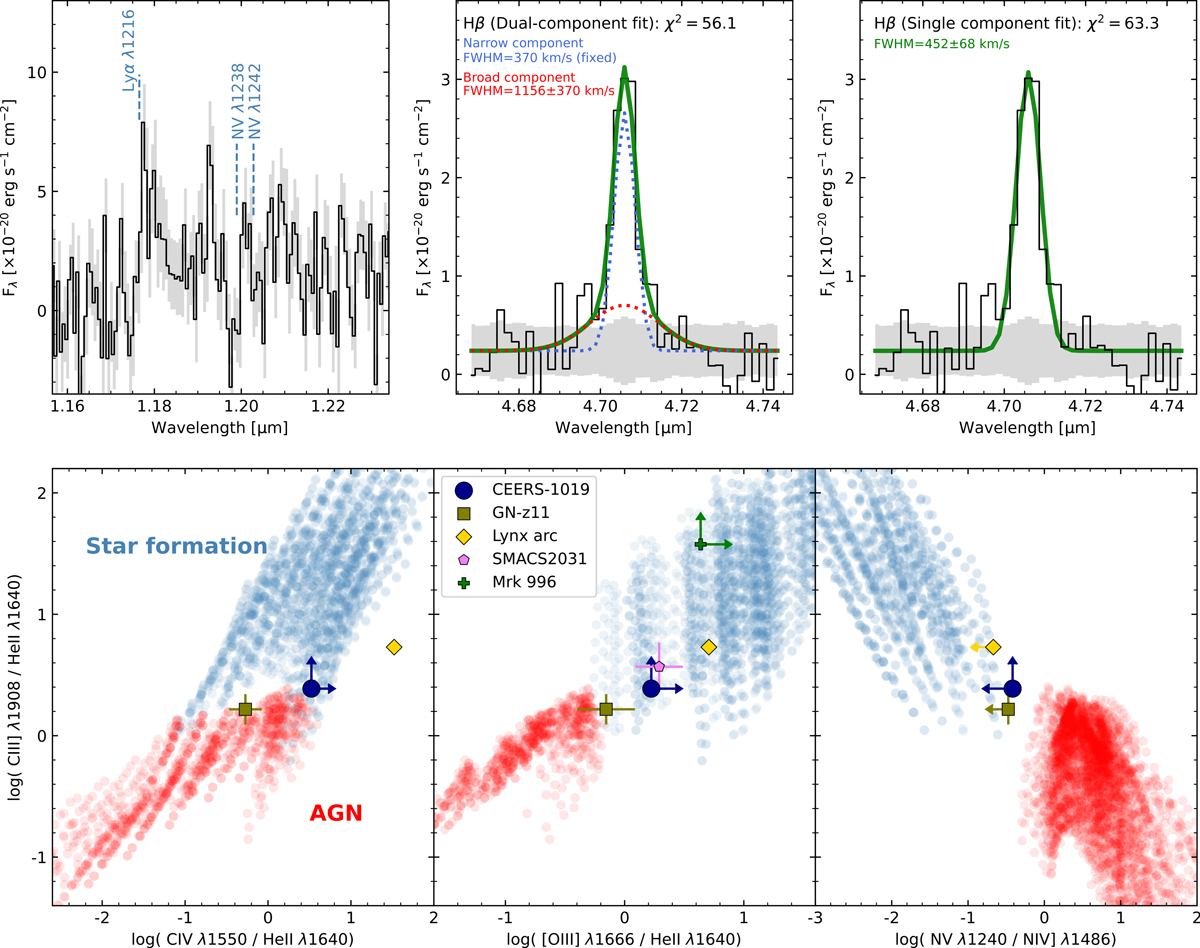
Star formation and AGN diagnostics. The top left panel shows the G140M spectrum of CEERS-1019 (in black and 1σ uncertainty in grey) around the expected positions of N Vλλ1238, 1242 (marked with vertical lines), which are not detected (1.44 × 10⁻¹⁸ erg s−1 cm−2 at 3σ). Lyα emission is also marked. The top middle and right panels show the best fits (green) to the Hβ emission line using dual-component (middle, narrow and broad components in blue and red, respectively) and single-component (right) Gaussian profiles. The bottom panels show star formation (blue) and AGN (red) photoionization models using several rest-frame UV lines. The position of CEERS-1019 (dark blue circle) aligns with the predictions of star-forming models in all diagnostic diagrams. The location of other known star-forming galaxies with strong nitrogen emission, GN-z11 (Bunker et al. 2023), the Lynx arc (Villar-Martín et al. 2004), SMACS2031 (Patrício et al. 2016), and Mrk 996 (Mingozzi et al. 2022) are also marked with different symbols as indicated in the legend.
Current usage metrics show cumulative count of Article Views (full-text article views including HTML views, PDF and ePub downloads, according to the available data) and Abstracts Views on Vision4Press platform.
Data correspond to usage on the plateform after 2015. The current usage metrics is available 48-96 hours after online publication and is updated daily on week days.
Initial download of the metrics may take a while.


