Fig. 4.
Download original image
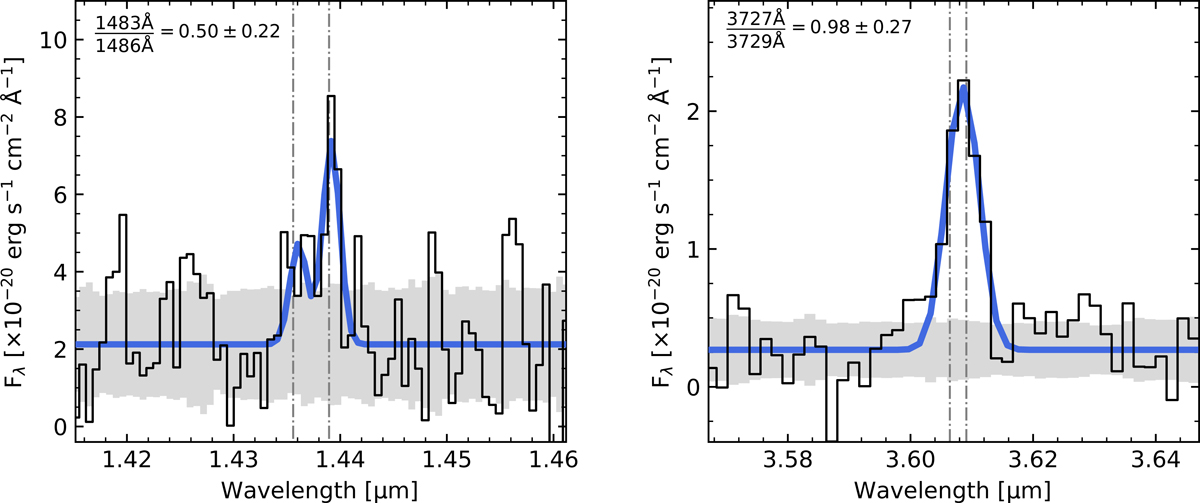
Best fit (blue) of density-sensitive emission lines, N IV] λλ1483, 1486 (left) and [O II] λλ3727, 3729 (right), using G140M and G395M medium-resolution spectra (black and 1σ uncertainty in grey), respectively. The fit uses two Gaussian profiles with similar widths and the expected position and separation between the two transitions (vertical lines).
Current usage metrics show cumulative count of Article Views (full-text article views including HTML views, PDF and ePub downloads, according to the available data) and Abstracts Views on Vision4Press platform.
Data correspond to usage on the plateform after 2015. The current usage metrics is available 48-96 hours after online publication and is updated daily on week days.
Initial download of the metrics may take a while.