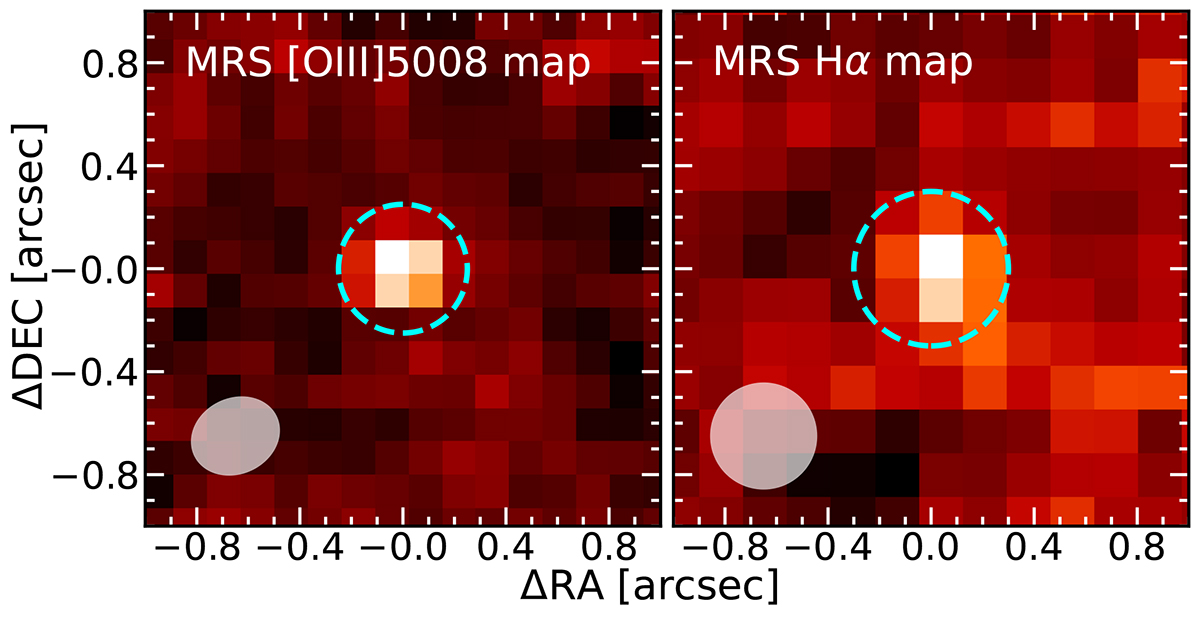
Fig. 1.
Download original image
MRS [O III] 5008 Å (left) and Hα (right) emission line maps. The [O III] 5008 Å and Hα line maps are generated by integrating a narrow velocity range, −150 < v [km s−1] < 150, around the peak of each emission line. The dashed cyan circles show the aperture chosen to extract the 1D spectra. The gray area represents the MRS spatial resolution (PSF FWHM) at the observed wavelength of each emission line. These line maps demonstrate that GN-z11 is spatially unresolved in the MRS observations.
Current usage metrics show cumulative count of Article Views (full-text article views including HTML views, PDF and ePub downloads, according to the available data) and Abstracts Views on Vision4Press platform.
Data correspond to usage on the plateform after 2015. The current usage metrics is available 48-96 hours after online publication and is updated daily on week days.
Initial download of the metrics may take a while.