Fig. 6.
Download original image
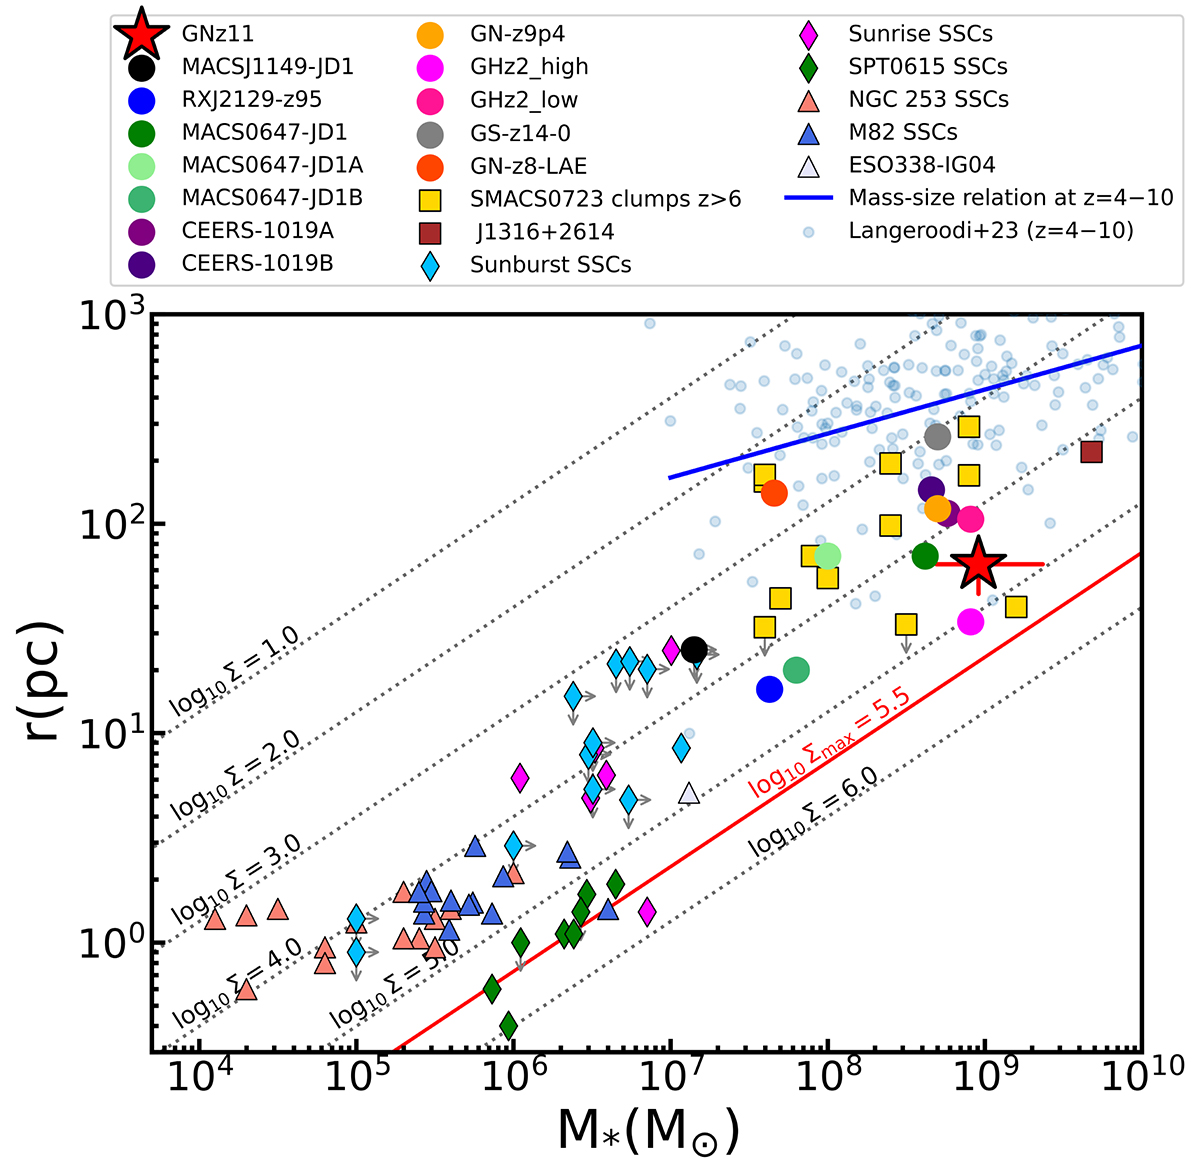
Mass-radius relation for GN-z11 including young star clusters in the nearby starbursts (NGC253, Leroy et al. 2018; M82, McCrady et al. 2003; McCrady & Graham 2007), low-z blue compact (ESO338-IG04, Östlin et al. 2007) and low-metallicity (SBS0335-052E, Adamo et al. 2010) galaxies. We also plot the values for high-z clusters (Sunburst, Vanzella et al. 2022; Sunrise, Vanzella et al. 2023b; SPT0615-JD1, Adamo et al. 2024), clumps (SMACS0723, Claeyssens et al. 2023), extremely UV-bright SFG (J1316+2614, Marques-Chaves et al. 2024b), and luminous galaxies at redshifts above 8 (GN-z8-LAE, Navarro-Carrera et al. 2024; CEERS-1019, Marques-Chaves et al. 2024a; MACS1149-JD1, Bradač et al. 2024; GN-z9p4, (Curti et al. 2024a; Schaerer et al. 2024); RXJ2129-z95, Williams et al. 2023; MACS0647-JD, Hsiao et al. 2023; GHz2, Calabro et al. 2024; GS-z14-0, Helton et al. 2024). The mass−size relation derived for z = 4–10 galaxies identified with the JWST (Langeroodi & Hjorth 2023) is shown (blue line) as reference. The dotted lines represent the constant stellar mass surface density in units of M⊙ pc−2. The line of log10Σ = 5.5 (in red) indicates the observed maximum value in clusters and the nucleus of galaxies, which was also predicted in dense systems under ineffective feedback-regulated conditions (Grudić et al. 2019). The stellar mass of GN-z11 is the average of the values presented in Bunker et al. (2023) and Tacchella et al. (2023).
Current usage metrics show cumulative count of Article Views (full-text article views including HTML views, PDF and ePub downloads, according to the available data) and Abstracts Views on Vision4Press platform.
Data correspond to usage on the plateform after 2015. The current usage metrics is available 48-96 hours after online publication and is updated daily on week days.
Initial download of the metrics may take a while.