Fig. 2.
Download original image
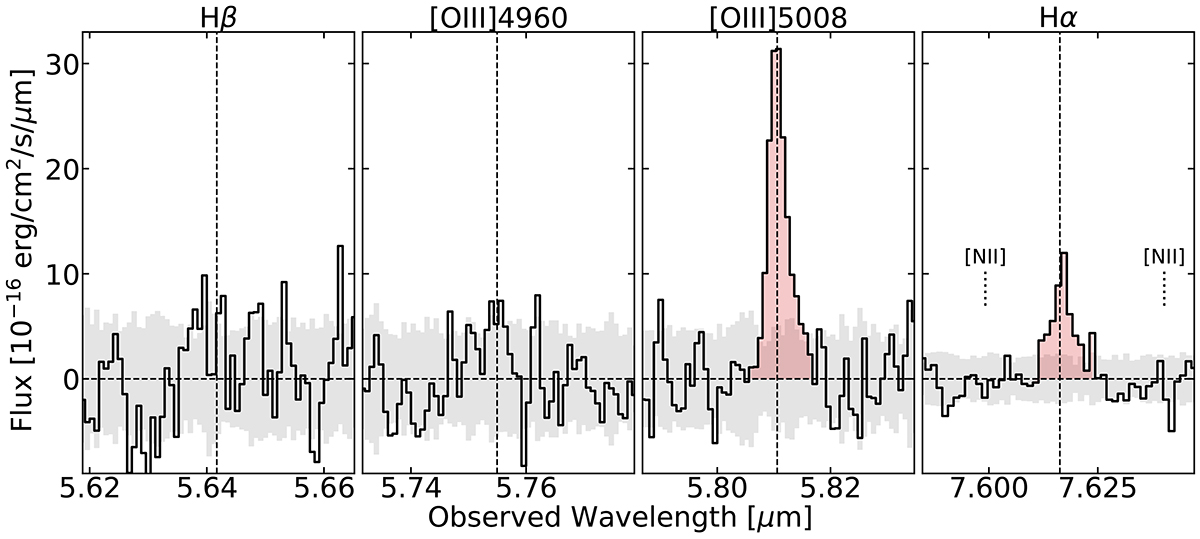
View of the rest-frame optical spectrum of GN-z11 by zooming in the Hβ, [O III] 4960,5008 Å, and Hα emission lines. The continuous black line shows the 1D extracted MRS spectrum. The gray area shows the ±1σ noise calculated from the standard deviation of the local background. The red area shows the spectral range used to calculate the integrated line flux. The vertical dashed black line shows the wavelength of the peak of each emission line considering a redshift of 10.602.
Current usage metrics show cumulative count of Article Views (full-text article views including HTML views, PDF and ePub downloads, according to the available data) and Abstracts Views on Vision4Press platform.
Data correspond to usage on the plateform after 2015. The current usage metrics is available 48-96 hours after online publication and is updated daily on week days.
Initial download of the metrics may take a while.