Fig. 5.
Download original image
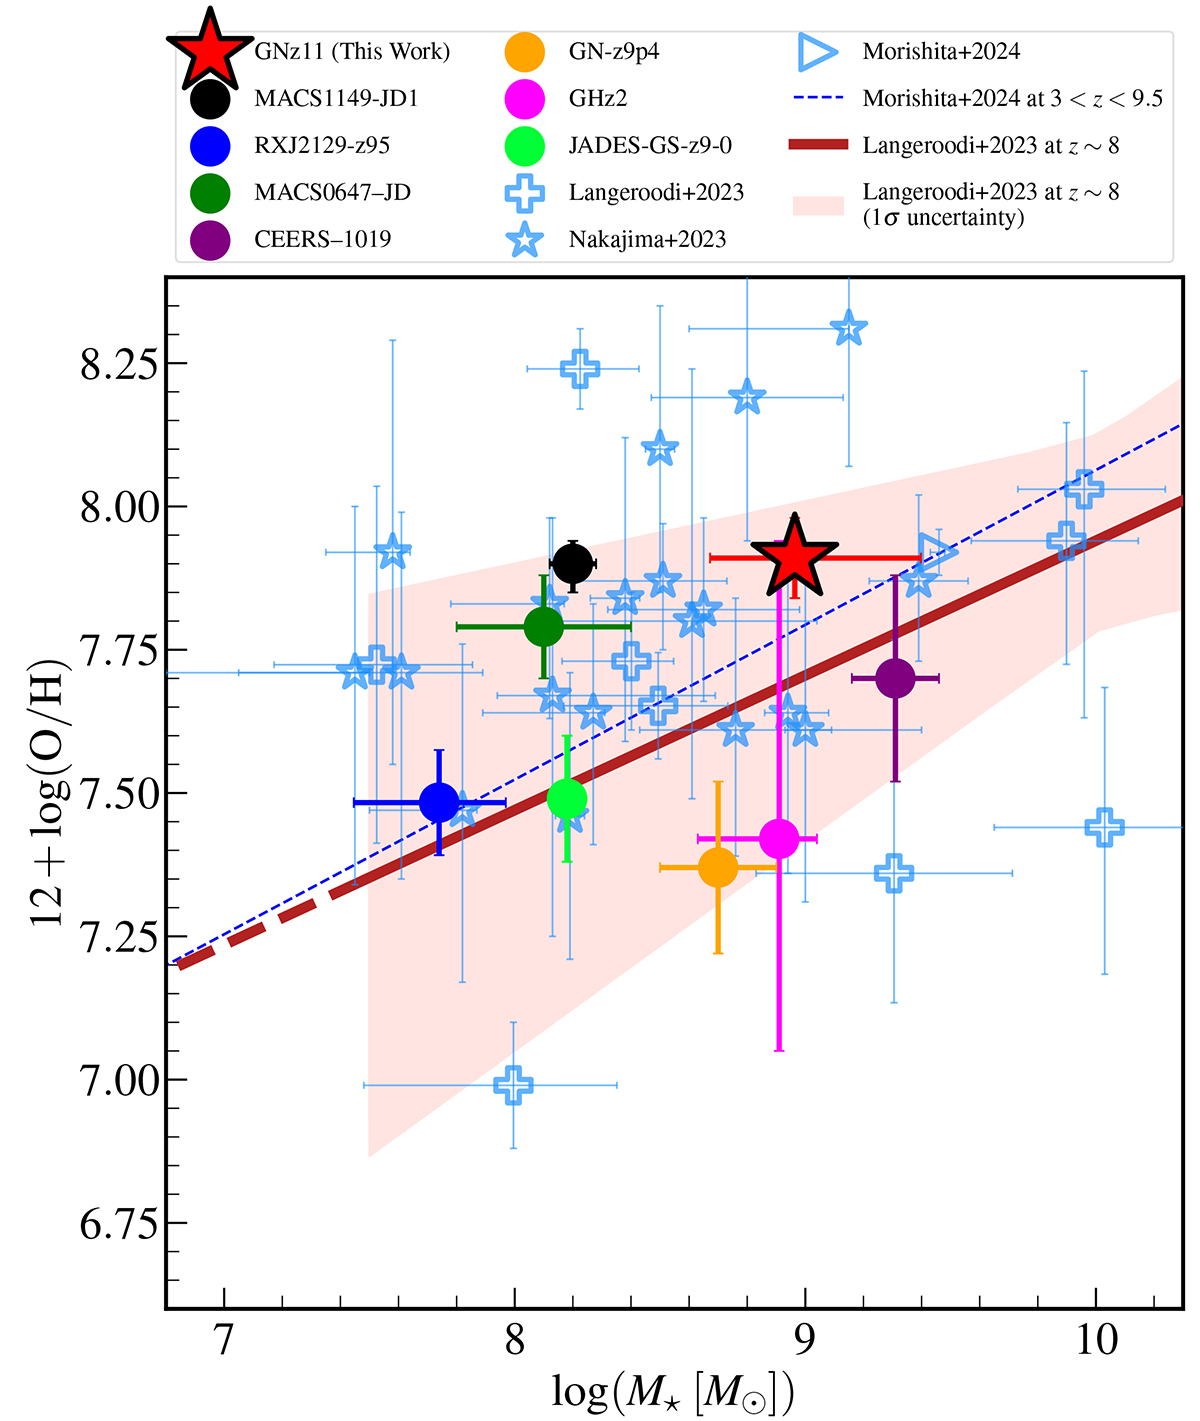
Mass-metallicity diagram for z > 7 galaxies. The large red star shows the measured stellar mass and gas-phase metallicity for GN-z11. The colored circles show the location of the remaining z > 9 galaxies, compiled from the literature: MACS1149-JD1 (Stiavelli et al. 2023), RXJ2129-z95 (Williams et al. 2023), MACS0647–JD (Hsiao et al. 2024a), CEERS–1019 (Nakajima et al. 2023; Marques-Chaves et al. 2024a), GN-z9p4 (Schaerer et al. 2024), GHz2 (Zavala et al. 2024), and JADES-GS-z9-0 (Laseter et al. 2024; Curti et al. 2024a). The empty blue symbols indicate the mass and metallicity of the 7 < z < 9 galaxies, compiled from Langeroodi et al. (2023) (pluses), Nakajima et al. (2023) (stars), Curti et al. (2024b) (squares), and Morishita et al. (2024) (triangles). The dashed blue line shows the best-fit mass-metallicity relation based on a sample of direct-method metallicity measurements at 3 < z < 9.5 (Morishita et al. 2024). The solid red line and the shaded red region show the best-fit mass-metallicity relation and its uncertainty at z ∼ 8 as measured by Langeroodi et al. (2023). GN-z11 agrees with the best-fit mass-metallicity relation at z ∼ 8, consistent with little to no evolution in the normalization of the mass-metallicity relation at z > 6. The stellar mass of GN-z11 is a mean of the values presented in Bunker et al. (2023) and Tacchella et al. (2023).
Current usage metrics show cumulative count of Article Views (full-text article views including HTML views, PDF and ePub downloads, according to the available data) and Abstracts Views on Vision4Press platform.
Data correspond to usage on the plateform after 2015. The current usage metrics is available 48-96 hours after online publication and is updated daily on week days.
Initial download of the metrics may take a while.