Fig. 3.
Download original image
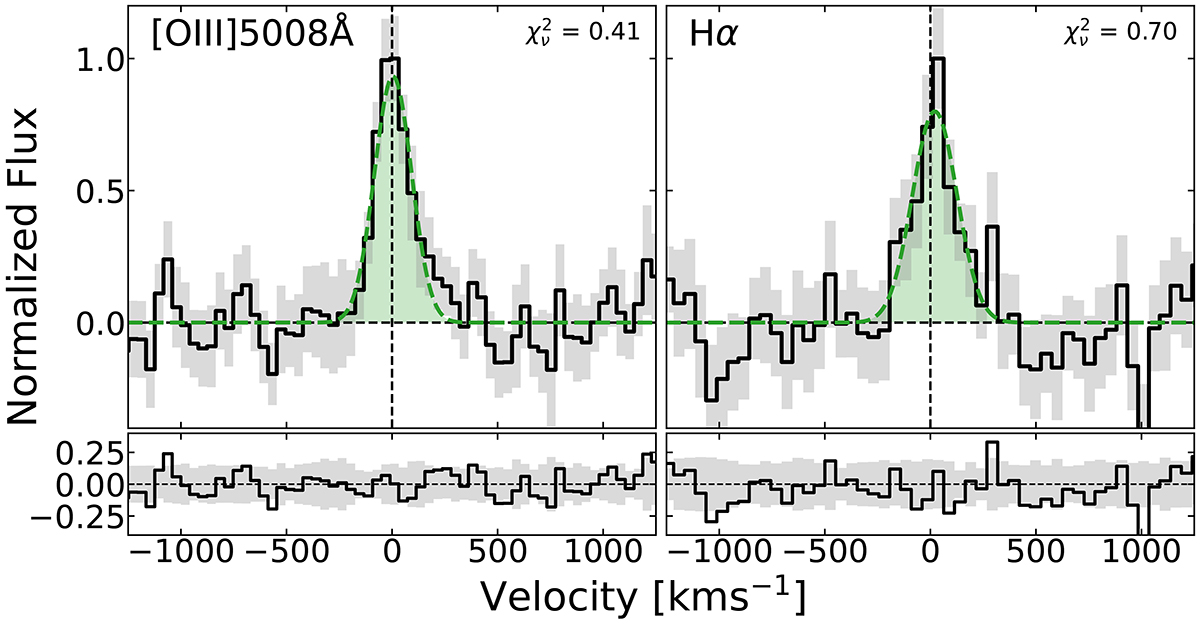
MRS [O III] 5008 Å and Hα emission line fits. The left and right panels show the one-component Gaussian fits, together with the fit residuals, for the [O III] 5008 Å and Hα emission lines, respectively. The continuous black line shows the 1D extracted MRS spectrum. The gray area shows the ±1σ uncertainty calculated from the standard deviation of the local background. The green dashed line shows the one-component Gaussian function that fits the spectra best. The black vertical dashed line is the wavelength at the peak of each emission line considering a redshift of 10.602. The ![]() for each emission line fit calculated in the velocity range, −500 < v [km s−1] < 500, is included.
for each emission line fit calculated in the velocity range, −500 < v [km s−1] < 500, is included.
Current usage metrics show cumulative count of Article Views (full-text article views including HTML views, PDF and ePub downloads, according to the available data) and Abstracts Views on Vision4Press platform.
Data correspond to usage on the plateform after 2015. The current usage metrics is available 48-96 hours after online publication and is updated daily on week days.
Initial download of the metrics may take a while.