Fig. 4.
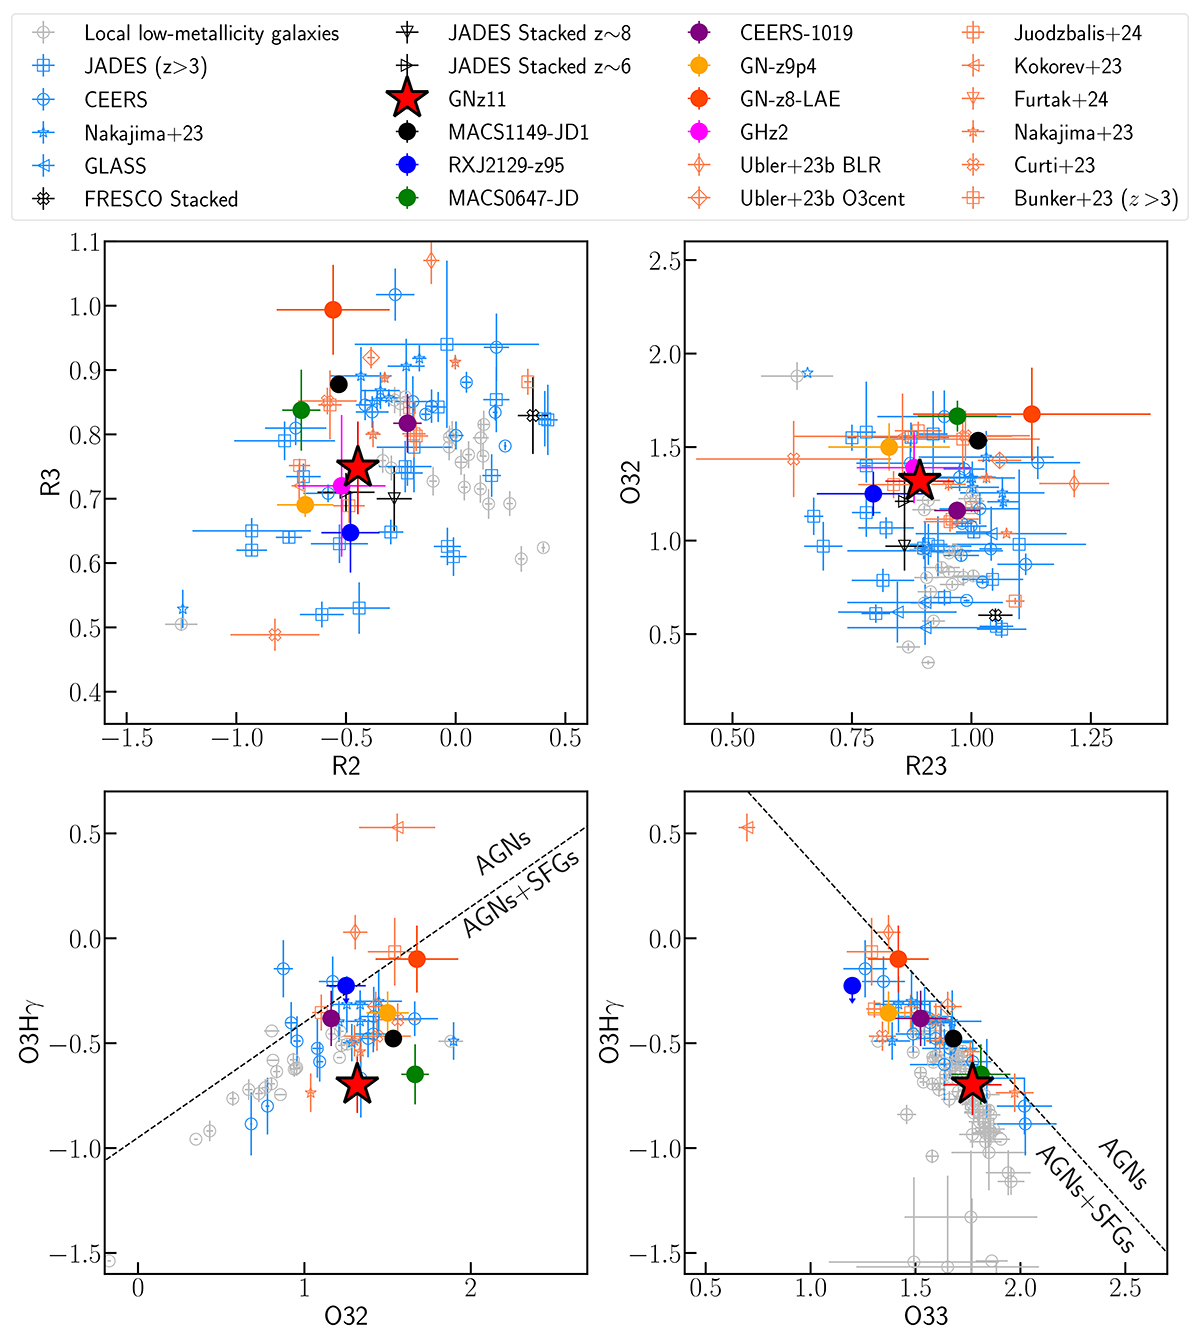
Download original image
Line ratio diagrams. This figure shows the position of GN-z11 (red star) on the R2–R3, R23–O32, O32–O3Hγ and O32–O33 diagrams. JWST-detected z > 8 galaxies are represented as filled circles. The blue and red markers represent the high-z SFGs and type 1 AGNs from different samples, respectively. Further details of these samples are presented in Sect. 3.3. The local low-metallicity subsample (gray markers), drawn from Izotov et al. (2006), Izotov & Thuan (2011), Izotov et al. (2016, 2019, 2024), was selected to be 12 + log(O/H) < 8. The JADES subsample, drawn from Bunker et al. (2023) and Cameron et al. (2023a), was selected to be z > 3. The dashed lines represent the separation between the AGN-dominant and the AGN+SFGs regions presented by Mazzolari et al. (2024). When no Hγ data were available, we considered Hγ = Hα/5.93.
Current usage metrics show cumulative count of Article Views (full-text article views including HTML views, PDF and ePub downloads, according to the available data) and Abstracts Views on Vision4Press platform.
Data correspond to usage on the plateform after 2015. The current usage metrics is available 48-96 hours after online publication and is updated daily on week days.
Initial download of the metrics may take a while.