| Issue |
A&A
Volume 695, March 2025
|
|
|---|---|---|
| Article Number | A256 | |
| Number of page(s) | 16 | |
| Section | Extragalactic astronomy | |
| DOI | https://doi.org/10.1051/0004-6361/202348724 | |
| Published online | 26 March 2025 | |
Fundamental relation in isolated galaxies, pairs, and triplets in the local Universe
1
Departamento de Física Teórica y del Cosmos, Edificio Mecenas, Campus Fuentenueva, Universidad de Granada, E-18071 Granada, Spain
2
Instituto Universitario Carlos I de Física Teórica y Computacional, Universidad de Granada, 18071 Granada, Spain
3
Instituto de Física, Pontificia Universidad Católica de Valparaíso, Casilla 4059 Valparaíso, Chile
4
Département de Physique, de Génie Physique et d’Optique, Université Laval, and Centre de Recherche en Astrophysique du Québec (CRAQ), Québec, QC G1V 0A6, Canada
⋆ Corresponding author; This email address is being protected from spambots. You need JavaScript enabled to view it.
Received:
24
November
2023
Accepted:
21
February
2025
Abstract
Context. The correlations between star formation rate (SFR), stellar mass (M⋆), and gas-phase metallicity for star-forming (SF) galaxies, known as global scaling relations or fundamental relations, have been studied during the past decades to understand the evolution of galaxies. However, the origin of these correlations and their scatter, which may also be related to their morphology or environment, is still a subject of debate.
Aims. In this work, we establish fundamental relations, for the first time, in isolated systems in the local Universe (with 0.005 ≤ z ≤ 0.080), which can give insight into the underlying physics of star formation. We used a sample of isolated galaxies to explore whether star formation is regulated by smooth secular processes. In addition, galaxies in physically bound isolated pairs and isolated triplets may also interact with each other, where interaction itself may enhance or regulate star formation and the distribution of gas and metals within galaxies.
Methods. We made use of published emission line flux information from the Sloan Digital Sky Survey (SDSS) to identify SF galaxies in the SDSS-based catalogue of isolated galaxies (SIGs), isolated pairs (SIPs), and isolated triplets (SITs). We also used these data to derive their aperture-corrected SFR (considering two different methods) and oxygen abundance, 12 + log(O/H), using bright line calibrations. Stellar masses for SIG, SIP, and SIT galaxies were estimated by fitting their spectral energy distribution on the five SDSS bands.
Results. The SFR results found using both methods seem to be consistent. We compared our results with a sample of SF galaxies in the SDSS. We found that, on average, at a fixed stellar mass, the SIG SF galaxies have lower SFR values than Main Sequence (MS) SF galaxies in the SDSS and central galaxies in the SIP and SIT. On average, SIG galaxies have higher 12 + log(O/H) values than galaxies in the SIP, SIT, and comparison sample. When distinguishing between central and satellite galaxies in the SIP and SIT, centrals and SIG galaxies present similar values (∼8.55), while satellites have values close to M33 (∼8.4). Using the Dn(4000) parameter as a proxy of the age of the stellar populations, we found that, on average, SIG and central galaxies have higher Dn(4000) values than satellites and comparison galaxies.
Conclusions. In general SIG galaxies do not present stellar starbursts produced by interactions with other galaxies, and therefore their gas is consumed more slowly and at a regular pace. On the contrary, SIP and SIT galaxies present higher SFR values at fixed mass (both in central and satellite galaxies). Therefore, the effect of adding one or two companion galaxies is noticeable and produces a similar effect as the typical average environment around galaxies in the local Universe. The successive interactions between the galaxies that form these pairs and triplets enhance the star formation. Based on our results for SIGs, we propose a ground level ‘nurture-free’ SFR–M⋆ and gas metallicity-SFR–M⋆ relations for SF galaxies in the local Universe.
Key words: galaxies: evolution / galaxies: formation / galaxies: fundamental parameters / galaxies: general / galaxies: star formation
© The Authors 2025
 Open Access article, published by EDP Sciences, under the terms of the Creative Commons Attribution License (https://creativecommons.org/licenses/by/4.0), which permits unrestricted use, distribution, and reproduction in any medium, provided the original work is properly cited.
This article is published in open access under the Subscribe to Open model. This email address is being protected from spambots. You need JavaScript enabled to view it. to support open access publication.
1. Introduction
Star formation rate (SFR), stellar mass (M⋆), and gas-phase metallicity, measured by the oxygen abundances, 12 + log(O/H), for instance, are key physical quantities that must be considered in galaxy evolution studies (Noeske et al. 2007; Mannucci et al. 2010; Yates et al. 2012; Wu & Zhang 2021; Greener et al. 2022; Fraser-McKelvie et al. 2022). With a continuous inflow and collapse of cold gas, galaxies form new stars, a process measured by the SFR, with the subsequent increment of their stellar mass, and they undergo chemical evolution, which is measured by the stellar or gas metallicity (Gao & Solomon 2004; Vale Asari et al. 2009; Gao et al. 2018; Lin et al. 2019, 2020). Stars produce heavy elements (metals) that are dispersed into the interstellar medium (ISM), contributing to the chemical enrichment of the galaxy. Gas flows (both inflows and outflows) regulate the level of metal content by diluting its gas phase or directly expelling the enriched gas out of the galactic potential well, contributing as well to the metal enrichment of the circumgalactic medium (CGM), which extends beyond the ISM but within the virial radius (Finlator & Davé 2008; Tumlinson et al. 2017). Therefore, these three quantities, as physical measurements of these processes, must somehow be related.
The correlations between these three quantities for star-forming (SF) galaxies, known as global scaling relations or fundamental relations, have been studied during the past decades. Observations have shown that there is a relation between the stellar mass and gas metallicity, the MZR relation (Tremonti et al. 2004), and between the SFR and M⋆, known as the main sequence for SF galaxies or star formation main sequence (SFMS; Brinchmann et al. 2004; Daddi et al. 2007; Peng et al. 2010; Whitaker et al. 2012; Popesso et al. 2019). There is also a correlation of the SFR with the gas content (Ellison et al. 2008; Andrews & Martini 2013), especially the molecular gas, usually referred as the star formation law or Kennicutt-Schmidt (KS) law (Schmidt 1959; Kennicutt 1998). Moreover, SFR, M⋆, and gas metallicity are also correlated in a fundamental plane (Mannucci et al. 2010; Lara-López et al. 2010, 2013), often referred to as the “fundamental metallicity relation” (FMR or MZSFR). Hereafter we refer to this relation as the fundamental relation. However, the origin of these correlations and their scatter, which may also be related to their morphology or environment, is still a subject of debate (Foster et al. 2012; Sánchez Almeida & Sánchez-Menguiano 2019; Sánchez-Menguiano et al. 2019; Duplancic et al. 2020; Pearson et al. 2021; Mesa et al. 2021; Namiki et al. 2021; Duarte Puertas et al. 2022).
As noted by Curti et al. (2020), differences can be related to the choice of the metallicity diagnostics and calibrations. However, when the measurements of all the quantities involved (especially metallicity) are performed self-consistently (and the associated observational uncertainties are properly taken into account as well), results suggest that the evolution of galaxies is regulated by smooth, secular processes and that an equilibrium condition is set between the involved physical mechanisms over cosmic time (Curti et al. 2017, 2020; Cresci et al. 2019). In addition, Wang & Lilly (2021) recently built a theoretical framework to understand the correlation between SFR, gas mass, and metallicity as well as their variability, which potentially uncovers the relevant physical processes of star formation at different scales, that is, applicable from 100 pc scales up to galactic scales, from individual galaxies up to the overall galaxy population, and at both low and high redshifts (Tacconi et al. 2018; Ellison et al. 2021; Pessa et al. 2021). They conclude that on galactic scales, the SF and metal-enhancement is primarily regulated by the time-varying inflow rate of gas from the surrounding intergalactic medium. In this framework, a revision of these fundamental relations in galaxies evolving secularly, in an equilibrium between gas inflow, outflow, and star formation, is still missing and would provide valuable information to constrain chemical evolution models for SF galaxies (Cid Fernandes et al. 2007; Lilly et al. 2013; Zahid et al. 2017; Fraser-McKelvie et al. 2022).
In this work, we establish fundamental relations, for the first time, in isolated systems in the local Universe, which can give insight into the underlying physics of star formation. Compared to isolated galaxies, galaxies in isolated pairs and isolated triplets (the smallest and most isolated galaxy groups) may share a common circumgalactic medium (CGM) that regulates the distribution of gas and metal (Heckman et al. 1990; Tumlinson et al. 2011, 2017), so that their evolution may be linked to some extent. In addition, galaxies in physically bound isolated pairs and triplets, may also interact with each other, where the interaction itself enhance or regulate star formation and the distribution of gas and metals (Ellison et al. 2020).
This work is presented as follows. In Sect. 2 we present the Sloan Digital Sky Survey (SDSS) data that we used and the samples of isolated systems. In Sect. 3, we describe the methodology that we followed in order to obtain the SFR and gas-phase metallicity of the galaxies. Our main results are introduced in Sect. 4, and the associated discussion is in Sect. 5. Finally, a summary and the main conclusions of our work are given in Sect. 6. Throughout the paper, we use a cosmology with ΩΛ0 = 0.7, Ωm0 = 0.3, and H0 = 70 km s−1 Mpc−1.
2. Data and samples
2.1. Isolated systems in the Sloan Digital Sky Survey
The samples of isolated systems that we use in this study are based on the catalogues of isolated galaxies, isolated pairs, and isolated triplets compiled by Argudo-Fernández et al. (2015) using photometric and spectroscopic data from the Sloan Digital Sky Survey Data Release 10 (SDSS-DR10, Ahn et al. 2014). We refer to these catalogues as SDSS-based Isolated Galaxies (SIG), SDSS-based Isolated Pairs (SIP), and SDSS-based Isolated Triplets (SIT). The SDSS uses a 2.5 m telescope equipped with a CCD camera to image the sky in five optical bands (u, g, r, i, z, magnitude limits: u:22.0; g:22.2; r:22.2; i:21.3; z:20.5) and two digital spectrographs (York et al. 2000; Ahn et al. 2014). The full photometric catalogue for SDSS-DR10 imaging consists of 1 231 051 050 objects, of which 208 478 448 are galaxies. Similarly, the full spectroscopic catalogue for SDSS-DR10 has ∼3 358 200 objects, of which 1 848 851 are galaxies.
The SDSS spectroscopic primary galaxy sample is complete in the apparent magnitude range 14.5 ≤ mr ≤ 17.7 (Strauss et al. 2002). For this reason, Argudo-Fernández et al. (2015) defined a sample of primary galaxies (33 081 galaxies), with 14.5 ≤ mr ≤ 15.2, separated from a sample of tracers (1 607 947 galaxies), with mr ≤ 17.7, allowing neighbour galaxies fainter by a magnitude of up to 2.5 than the primary galaxies within the SDSS spectroscopic completeness to be found. The primary sample is also limited to a redshift range of 0.005 ≤ z ≤ 0.080 in order to discard galaxies affected by large peculiar velocities and errors or large uncertainties in their photometric measurements. An additional star-galaxy separation was applied to remove stars misclassified as galaxies by the SDSS automated pipeline. Argudo-Fernández et al. (2015) also ensured that primary galaxies have 1 Mpc radius fields completely encircled within the photometric SDSS-DR10 footprint to avoid edge effects.
The candidate galaxies in the SIG, and the central galaxies in the SIP and SIT were selected from the primary sample if there were no, one, or two neighbours within 1 Mpc projected field radius and the radial velocity differences, Δ v, were from −500 to 500 km s−1 with respect to the primary galaxy, respectively. In addition, Argudo-Fernández et al. (2015) performed a visual inspection of the samples to identify any galaxy without spectroscopic information in the SDSS near primary galaxies (for example due to fibre collision), and these primary galaxies were removed from the samples. To select physically bound isolated pairs and isolated triplets, they set the restriction on velocity differences is up to 160 km s−1 (2σ of the Gaussian distribution of velocity differences for satellite galaxies) within a projected distance of 450 kpc. Under these conditions, Argudo-Fernández et al. (2014) found that ∼95% of the neighbours were physically bound companions. Argudo-Fernández et al. (2015) defined the final samples, identifying 3702 isolated galaxies that have been isolated for a large part of their lifetime (Verley et al. 2007a), 1240 isolated pairs, and 315 isolated triplets.
2.2. Selection of the star-forming galaxies
In this work we made use of the emission line flux information provided by Max-Planck-Institut für Astrophysik and Johns Hopkins University (MPA-JHU)1 (Kauffmann et al. 2003a; Brinchmann et al. 2004; Tremonti et al. 2004; Salim et al. 2007). The ∼97% of our sample of SIG, SIP, and SIT galaxies is included in MPA-JHU, being 3611, 2416, and 921 galaxies, respectively. Using the MPA-JHU catalogue we obtained the emission line fluxes, and their errors, of [O II]λλ 3727, 3729, [O III]λ 5007, Hβ, [N II]λ 6584, Hα, and [S II]λλ 6717, 6731. We corrected all the emission line fluxes considered in this work for extinction assuming the theoretical case B recombination (the theoretical Balmer decrement, IHα/Hβ = 2.86; T = 104 K, and low-density limit ne ∼ 102 cm−3; Osterbrock 1989; Storey & Hummer 1995) together with the Cardelli et al. (1989) extinction curve with Rv = Av/E(B−V) = 3.1 (O’Donnell 1994; Schlegel et al. 1998). The selection of the subsamples of SF galaxies has been made on the basis of the following conditions:
-
i)
The signal-to-noise ratio2 (S/N) of the emission lines Hα, Hβ, [O III], and [N II] is ≥3. Taking into account this condition leaves subsamples of 2888 SIG, 1958 SIP, and 710 SIT galaxies.
-
ii)
We considered those galaxies that are SF, below the Kauffman demarcation in the BPT diagnostic diagram [O III]λ 5007/Hβ versus [N II]λ 6583/Hα (e.g. Baldwin et al. 1981; Veilleux & Osterbrock 1987; Kewley et al. 2001; Kauffmann et al. 2003b) to differentiate them from active galactic nuclei (AGN) and composite galaxies, as shown in Fig. 1.
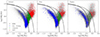 |
Fig. 1. [O III]λ 5007/Hβ versus [N II]λ 6583/Hα diagnostic diagram (BPT) for isolated galaxies (left panel), galaxies in isolated pairs (middle panel), and galaxies in isolated triplets (right panel). In each panel, blue, green, and red points represent SF galaxies, composite galaxies, and AGN galaxies, respectively. Grey points show the position in the BPT diagram of the SDSS galaxies in the MPA-JHU catalogue. The dashed line shows the Kewley et al. (2001) demarcation and the continuous line shows the Kauffmann et al. (2003b) curve. |
After applying both conditions, we are left with subsamples of 1282 SIG, 1209 SIP, and 460 SIT SF galaxies. From now on when we refer to SIG, SIP, and SIT galaxies we are referring to the subsamples of SF galaxies.
2.3. The control and comparison sample of SDSS star-forming galaxies
To compare the properties of SF galaxies in the SIG, SIP, and SIT, we used the catalogue of SDSS SF galaxies from Duarte Puertas et al. (2017), hereafter the DP17 sample. In fact, we followed the same methodology to select SF galaxies, and to derive SFR and oxygen abundances, as explained in Sect. 3. The DP17 sample is based on the MPA-JHU public catalogue, with the addition of photometric information from the SDSS-DR12 (Alam et al. 2015). They restricted the galaxies to a stellar mass range 108.5 < M⋆/M⊙ < 1011.5 and redshift 0.005 ≤ z ≤ 0.220. They applied other restrictions related to the derivation of the aperture-corrected Hα flux, see Duarte Puertas et al. (2017) for details. Since there are not restrictions regarding the environment, galaxies in the comparison sample can be located in any environment, mainly in denser structures (such as filaments and walls).
The panels in Fig. 2 show the distributions of stellar mass for SIG, SIP, and SIT galaxies in comparison to the DP17 sample, extended to masses lower than 108.5 M⋆ (242 385 galaxies, as shown in Table 2). When distinguishing between central and satellite galaxies in the SIP and SIT, the central panel shows that central galaxies in the SIP and SIT have stellar mass mean values similar to the SIG and the DP17 sample, while the values for satellite galaxies are generally lower (see also Table 2).
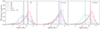 |
Fig. 2. Distributions of the stellar mass for SF galaxies in the samples used in this work. From left to right: Distributions for all the galaxies (including both central and satellites for isolated pairs and isolated triplets); distributions for isolated and central galaxies in isolated pairs and triplets; and distributions for satellite galaxies in isolated pairs (dash-dotted light-green distribution) and triplets (dash-dotted cyan distribution). The distributions in the first two panels follow line style and colours as indicated in the legend. We note that in the last panel we keep the distribution for isolated galaxies for reference. For reference, we also show the distribution for the DP17 sample, extended for low-mass galaxies (log(M⋆/M⊙) < 8.5) as explained in Sect. 2.3 and the Centrals-CS sample in all the panels. The median values for each subsample of galaxies are indicated by a vertical line, following the respective colour and line style of each distribution. The number of galaxies in each sample, as well as their corresponding median values, standard deviations, mean values and associated errors, are presented in Table 2. |
We note that the DP17 sample contains galaxies in a redshift range (z ≲ 0.22) larger than the SIG, SIP, and SIT (limited to z < 0.08). Even if the slope of the main sequence does not significantly vary between z = 0 and z = 1 (Donnari et al. 2019), and the mass-metallicity relation remains intact up to z ∼ 2.5 (Savaglio et al. 2005; Erb et al. 2006; Stott et al. 2013), we also defined a control sample of SF galaxies to minimise any possible selection effects. We selected galaxies from the DP17 sample, considering the galaxies with 14.5 ≤ mr ≤ 15.2 and z < 0.08 (following the criteria to select primary galaxies in the SIG, SIP, and SIT as in Argudo-Fernández et al. 2015). The control sample, hereafter Centrals-CS, is composed of 5212 SF galaxies (see also Table 2).
Figure 3 shows that the Centrals-CS sample is comparable to central galaxies (i.e. SIG and central galaxies in the SIP and the SIT) in terms of completeness in stellar mass and redshift, following the methodology in Sampaio et al. (2024) and O’Kane et al. (2024). The samples are limited to a stellar mass range within 8.5 ≤ log(M⋆/M⊙) ≤ 11.5 to have a significant number of galaxies. Henceforth, for this study, we computed the relations between stellar mass, SFR, and oxygen abundances for central galaxies and the Centrals-CS sample, within this stellar mass range. These samples are composed of 1703 central galaxies (1275 from the SIG, 354 from the SIP, and 74 from the SIT) and 5086 galaxies in the control sample. To analyse these properties in the context of galactic conformity, we considered satellite galaxies versus central galaxies in the SIP and SIT, in all the stellar mass range (1207 galaxies from the SIP and 460 from the SIT).
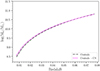 |
Fig. 3. Stellar mass completeness as a function of redshift for central galaxies (black dash-dotted line) and the control sample (magenta dashed line) within a stellar mass range 8.5 ≤ log(M⋆/M⊙) ≤ 11.5 (1703 central galaxies and 5086 galaxies in the control sample). The completeness has been estimated using the 95% percentile of stellar mass at redshift bins with a width of 0.005 and applying a logarithmic fit of the form log10(M⋆/M⊙) = A + B log10(z) over the redshift range. |
2.4. Quantification of the environment
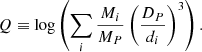
To estimate the gravitational interaction strength produced by the neighbours on the central galaxy with respect to its internal binding forces, we used the Q parameter (Verley et al. 2007b; Sabater et al. 2013; Argudo-Fernández et al. 2013, 2014, 2015) defined as:
 (1)
(1)
The subscripts p and i are for primary and neighbour galaxies, respectively, where M is the stellar mass of the galaxy, DP is the diameter of the primary galaxy, and di is the projected physical distance of the ith neighbour to the primary galaxy. Stellar masses were estimated using the five optical bands (ugriz) with the routine kcorrect (Blanton & Roweis 2007) with a Kroupa (2001) universal initial mass function (IMF).
We used this tidal strength parameter, provided by Argudo-Fernández et al. (2015), to consider the effects of the local environment on primary galaxies, henceforth centrals, by the companion galaxies, henceforth satellites, in isolated pairs (Qpair) and isolated triplets (Qtrip).
3. Methodology
3.1. Star formation rate derivation
It is known that the SDSS fibres (3″ diameter) cover a limited portion of the galaxies in the local Universe (z < 0.1), which implies that only a limited amount of the Hα emission of each galaxy is measured. Using aperture corrections is necessary when we derive an extensive quantity, that is, the value of this quantity depends on the portion of the galaxy considered. This occurs when we derive the total SFR of the SDSS SF galaxies at low redshift. The difference between the total SFR and the SFR in the fibre is, on average, ∼0.65 dex (Duarte Puertas et al. 2017).
The SFR was derived from the Hα luminosity and the conversion factor ηHα (Brinchmann et al. 2004), where SFR = L(Hα)/ηHα. The parameter ηHα varies with the physical properties of the galaxy, total stellar mass, and metallicity (see Charlot et al. 2002; Hirashita et al. 2003; Brinchmann et al. 2004)3.
In this work, SIG, SIP, and SIT galaxies have been aperture corrected using the two different recipes described in Duarte Puertas et al. (2017): i) the empirical Iglesias-Páramo et al. (2013, 2016) aperture corrections from the CALIFA survey; and ii) the refined method of Hopkins et al. (2003) as used in Duarte Puertas et al. (2017). Hopkins et al. (2003) assumed that the Hα emission-line flux can be traced across the whole galaxy by the r-band emission. They derived the total Hα flux as a function of the difference between the total petrosian r-band magnitude (rpetro) and the corresponding magnitude within the SDSS fibre (rfibre) as:  (see also Pilyugin et al. 2013). Duarte Puertas et al. (2017) refined this methodology taking into account that the parameter ηHα is not a constant value and recalculated the SFR for all the SDSS SF galaxies in the MPA-JHU catalogue. The SFRs derived by using both methods are consistent (see Duarte Puertas et al. 2017, for more details).
In addition to SFR, we also used the Dn(4000) from the MPA-JHU catalogue for this work. In particular, we used the Dn(4000) that corresponds to the narrow definition of the 4000 Å break strength from Balogh et al. (1999). We used this parameter as the stellar population age indicator, which is small for galaxies with younger stellar populations, and large for older stellar populations. We used the divisor value at Dn(4000) = 1.67 following Mateus et al. (2006).
Compiled data for our sample of SF galaxies.
3.2. O/H derivation
We derived the oxygen abundance, 12 + log(O/H), using bright lines calibrations (i.e. [O II], [O III], Hβ, [N II], Hα, [S II]) due to the fact that the faint temperature sensitive lines are not available in our sample of galaxies. Duarte Puertas et al. (2021, 2022) performed a comparison between different empirical methods (Pérez-Montero & Contini 2009; Pilyugin & Grebel 2016; Curti et al. 2017) and the H II-CHI-mistry code (Pérez-Montero 2014) to derive the oxygen abundance. As can be seen in Fig. 1 of Duarte Puertas et al. (2022), a qualitative check was made by comparing the stellar mass – metallicity relation (MZR) for the Milky Way and 10 galaxies with: i) precise oxygen abundance values derived by the direct method from available electron temperature measurements with a sample of ∼200 000 SDSS SFg galaxies; and ii) with the oxygen abundance derived using the R-calibrator of Pilyugin & Grebel (2016). The figure shows that these 11 galaxies are contained in the footprint of SDSS SF galaxies. For this reason, in this work we have considered the empirical calibrations proposed by Pilyugin & Grebel (2016).
We derived the oxygen abundance using the empirical calibration S of Pilyugin & Grebel (2016)4. This calibrator uses the [S II] emission line instead of [O II]. We used the calibrator S because for those SDSS galaxies with z < 0.020, the emission line [O II]λ,3727,3729 is not covered in the spectra. For the ∼200 000 SDSS SF galaxies sample, the average difference between the oxygen abundance values derived with the S and R calibrators from Pilyugin & Grebel (2016) is ∼0.03 dex, a value much lower than the average error of the calibrators.
For the derivation of the oxygen abundance we have only considered those SF galaxies whose S/N for [S II]λλ 6717, 6731 is ≥3. After taking into account this condition we are left with 1269 SIG, 1191 SIP, and 446 SIT galaxies.
4. Results
In this work we have used aperture corrected SFR considering two different methods, using the empirical aperture corrections of Iglesias-Páramo et al. (2013, 2016) and by using the refined method of Hopkins et al. (2003) as applied in Duarte Puertas et al. (2017). The SFR results found in both cases are consistent, with the standard deviation of the difference is ∼0.13 dex. Throughout the next sections, we show the results using the second method. As a result, we have compiled Table 1 where we show a sample of the online table of our SF galaxies. In column 1 we show the SDSS spectroscopic name. Column 2 shows the stellar mass. Columns 3, 4, and 5 show the SFR, the oxygen abundance, and the Dn(4000). Table 1 also shows the uncertainties for each property considered5. The propagation of the uncertainties for the derivation of the SFR and the oxygen abundance have been estimated using the python package uncertainties6. Since there is no stellar mass estimation in the MPA-JHU for all the SIG, SIP, and SIT SF galaxies, we used stellar masses in Argudo-Fernández et al. (2015), estimated using k-correct, via a PCA-like technique based on SPS models, which do not have associated errors, as explained in Blanton & Roweis (2007). Estimates of the uncertainty from the SPS model in the order of 0.10 dex (Behroozi et al. 2010), which is also in agreement with the mean error of stellar masses in MPA (0.12 dex) and in the comparison sample (0.09 dex). We therefore adopted a value of 0.10 dex for the error of the stellar masses, which is also implemented for the estimation of the uncertainties of the coefficients in our fits.
The distribution of the physical parameters, including the specific star formation rate (sSFR = SFR/M⋆), for the galaxies in our samples is shown in Fig. 4. The median values for each subsample of galaxies are marked in each panel with dashed lines (red for SIG, green for SIP, blue for SIT, and grey for DP17 galaxies and magenta for Centrals-CS galaxies, where Table 2 shows the median and mean values and corresponding errors. The median values for SIP and SIT galaxies are lower than those of SIG and DP17 galaxies (about 0.5 dex), which is mainly caused by satellite galaxies, which generally have lower SFR values. These differences disappear when considering the sSFR (as shown in the second row of panels in Fig. 4).
 |
Fig. 4. Distributions of the SFR, sSFR, oxygen abundance, and Dn(4000), from upper to lower panels, for SF galaxies in the samples used in this work (similar to Fig. 2). The median values for each subsample of galaxies are indicated by a vertical line, following the respective colour and line style of each distribution. The number of galaxies in each sample, as well as their corresponding median values, standard deviations, mean values and associated errors, are presented in Table 2. |
Mean and median values of the distributions of physical properties for SF galaxies in this study.
We present our results as follows: first, in Sect. 4.1, we show the SFR–M⋆ relation of SIG and central galaxies in the SIP and SIT, in the stellar mass range 8.5 ≤ log(M⋆/M⊙) ≤ 11.5. Second, in Sect. 4.2, we present the 12 + log(O/H)–M⋆ relation, while in Sect. 4.3 we show the fundamental relation for the same samples of galaxies. In Sect. 4.4 we explore the dependence of the local environment on the SFR and 12 + log(O/H) for galaxies in isolated pairs and triplets and if there is any dependence in terms of galactic conformity.
4.1. Star formation rate as a function of the M⋆
In the left panel of Fig. 5 we show the SFR–M⋆ relation for SF galaxies in the SIG, and central galaxies in the SIP and SIT, compared to the Centrals-CS sample (control sample) and the relation in Duarte Puertas et al. (2017) for DP17 galaxies (comparison sample), in the stellar mass range 8.5 ≤ log(M⋆/M⊙) ≤ 11.5. The MS for each sample has been obtained as the linear fit to the running median of the data in the form of log(SFR) = a log(M⋆) − b. The parameters of the fits, with their corresponding uncertainties, and the number of bins considered to calculate the running median, are shown in Table 3. The slope of the SFR–M⋆ relation is comparable in all samples, which is expected since the slope of the main sequence does not vary significantly between z = 0 and z = 1 (Donnari et al. 2019). However, the effect of the addition of one companion galaxy is noticeable in the SIG, SIP, and SIT samples, with higher SFR values at fixed stellar mass. The mean Δ MSSDSS for SIG galaxies is −0.21 dex, slightly lower than for SIP and SIT galaxies (−0.13 dex and 0.08 dex, respectively).
 |
Fig. 5. Relation between the SFR and M⋆ (left panel) and the 12 + log(O/H) and M⋆ (right panel) for central SF galaxies with 8.5 ≤ log(M⋆/M⊙) ≤ 11.5. The relations are presented as the first and third order fit (respectively) to the running median in both axes. The relations for SIG galaxies (red dashed line) and central galaxies in the SIP and SIT (in green and blue dashed lines, respectively) are represented with their corresponding 1σ error. For comparison, we also show the relations for SF galaxies in DP17 and the control sample (black dotted line and grey dashed line, respectively). The number of galaxies considered in bin for each sample, as well as the parameters of the fits with their corresponding uncertainties, are presented in Table 3 and Table 4, respectively. |
Parameters of the MS for SF galaxies in this study.
Parameters of the MZR for SF galaxies in this study.
4.2. Oxygen abundance as a function of the M⋆
In the right panel of Fig. 5, we show the MZR relation as the oxygen abundance, 12 + log(O/H), versus the total stellar mass for SF galaxies in the SIG, and central galaxies in the SIP and SIT, compared to galaxies in the DP17 and Centrals-CS samples, in the stellar mass range 8.5 ≤ log(M⋆/M⊙) ≤ 11.5. The MZR for each sample has been obtained as the third-order fit to the running median of the data in the form of 12 + log(O/H) = a log (M⋆)3 + b log(M⋆)2 + c log(M⋆) + d. The MZR relation in all samples is comparable within 1σ. The parameters of the fits, with their corresponding uncertainties, and the number of bins considered to calculate the running median, are shown in Table 4.
4.3. Fundamental relation
After deriving the SFR corrected for aperture effects and the oxygen abundance for our whole sample, we show the stellar mass – metallicity – SFR relation (MZSFR) in the panels of Fig. 6 for SF galaxies in the SIG (circles), and central galaxies in the SIP (squares) and SIT (triangles), with 8.5 ≤ log(M⋆/M⊙) ≤ 11.5. From this figure, it can be seen that galaxies are located in the expected zone in this diagram. There are no outlier galaxies in this relation for SIG, SIP, and SIT galaxies. In addition, we found that the MZSFR is well represented by the first-order fit to the three-dimensional surface defined by the values of the M⋆, 12 + log(O/H), and SFR in the form of 12 + log(O/H) = a log(M⋆) + b log(SFR) + c. The parameters of the fits, with their corresponding uncertainties, are shown in Table 5.
 |
Fig. 6. Fundamental relation (SFR–M⋆–O/H) for central SF galaxies with 8.5 ≤ log (M⋆/M⊙) ≤ 11.5 colour coded by the galaxy Dn(4000). The marker size in the left panel is proportional to the 12 + log(O/H) values, while the marker size in the right panel is proportional to the SFR values. For reference, contours show the location of SF galaxies in the DP17 sample. |
Parameters of the MZRSFR for SF galaxies in this study.
4.4. Effect of the local environment and galactic conformity
To explore the effect of the local environment in the above relations we used the tidal strength parameter described in Sect. 2.4 on central galaxies in the SIP and SIT. Fig. 7 shows the relation between the SFR (upper left panel), 12 + log(O/H) (upper right panel), sSFR (lower left panel), and Dn(4000) (lower right panel) of the central galaxy in the SIP and SIT with the tidal strength parameter Qlocal, colour-coded by the value of the same property for the corresponding satellite galaxy. Complementarily, Fig. 8 shows the relation between these four properties for central and satellite galaxies, colour-coded by the Qlocal parameter.
 |
Fig. 7. Effect of the environment on the SFR, 12 + log(O/H), sSFR, and Dn(4000) for SF galaxies. Local tidal strength affecting the central galaxies in the isolated pairs (circles) and triplets (stars) versus: 1) the SFR of the central galaxy, coloured by the SFR of the satellite galaxy (left upper panel); 2) the 12 + log(O/H) of the central galaxy, coloured by the 12 + log(O/H) of the satellite galaxy (right upper panel); 3) the sSFR of the central galaxy, coloured by the sSFR of the satellite galaxy (left lower panel); and 4) the Dn(4000) of the central galaxy, coloured by the Dn(4000) of the satellite galaxy (right upper panel). Squares and error bars represent the median trend (coloured according to the colour bar of each panel) and dispersion, respectively, in three bins of the local tidal strength parameter (Qlocal ≤ −4, −4 < Qlocal ≤ 0, and Qlocal > 0). In the upper left on each panel we present a representative error, given by the median value of the error of the SFR (multiplied by 10 for better visualisation), 12 + log(O/H), sSFR, and Dn(4000) for central galaxies. The tidal strength parameter values from Argudo-Fernández et al. (2015) do not have an associated error. |
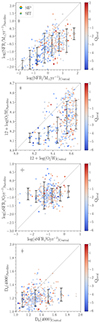 |
Fig. 8. Galactic conformity on the SFR, 12 + log(O/H), sSFR, and Dn(4000) for SF galaxies, coloured by the local tidal strength affecting the central galaxies in the isolated pairs (circles) and isolated triplets (stars). Upper panel: the SFR of the central galaxy versus the SFR of the satellite galaxy. Second panel: 12 + log(O/H) of the central galaxy versus 12 + log(O/H) of the satellite galaxy. Third panel: sSFR of the central galaxy, versus the sSFR of the satellite galaxy. Lower panel: Dn(4000) of the central galaxy versus Dn(4000) of the satellite galaxy. Grey dashed line is 1:1 relationship. Squares and error bars represent the median trend (coloured according to the colour bar) and dispersion, respectively, in three bins of the SFR, 12 + log(O/H), sSFR, and Dn(4000). In the upper left on each panel we present a representative error, given by the median value of the error of the property in each panel for central and satellite galaxies. The median value of the uncertainties of the SFR is multiplied by 10 for better visualisation. |
To understand the differences between central and satellite galaxies, in the third row panels of Fig. 4 we explored the distribution of the oxygen abundance considering all SF galaxies in the DP17, Centrals-CS, and SIG samples, in addition to: i) all SF galaxies in the SIP and SIT (left panel); ii) only the central galaxies in the SIP and SIT (central panel); and iii) only the satellite galaxies in the SIP and SIT (right panel). The median values for each galaxy sample are shown in Table 2 and are marked with different line styles and colours according to the legend.
5. Discussion
5.1. SFR as a function of the M⋆
From Fig. 5 we show that, at a fixed stellar mass, the SIG SF galaxies have lower SFR values (∼0.2 dex) than the MS of the sample of SDSS SF galaxies from Duarte Puertas et al. (2017). According to Duarte Puertas et al. (2022) and (Vásquez-Bustos et al. 2025), the difference with the MS (Δ MS) is related to the age of the stellar population of the galaxies (measured by the Dn(4000) parameter), being galaxies above the MS younger than below the MS. Therefore SF SIG galaxies are systematically older than SF centrals and SDSS galaxies. Indeed, the lower panels in Fig. 4 show that the median value of the Dn(4000) for SIG galaxies (1.34 ± 0.02) is slightly higher than for DP17 galaxies (1.28 ± 0.03), as the median values are nearly equivalent within the error margins. Therefore, SF isolated galaxies are older than SF SDSS galaxies on average. When we focus on the SIP and SIT galaxies the difference of the SFR at fixed stellar mass become smaller, with the values matching those of the MS, due to the contribution of satellite galaxies, which in general have lower SFR and Dn(4000) values than central galaxies. When considering central galaxies, the mean and median values of the Dn(4000) parameter are comparable; however, as shown in Fig. 5, the effect of the addition of one companion galaxy is noticeable in the MS defined for SF galaxies in the SIG, SIP and SIT, with increasing SFR values at fixed stellar mass.
The SIG galaxies have not interacted with another galaxy for at least 5 Gyr (Verley et al. 2007c); therefore the secular processes of the galaxy dominate their evolution. These galaxies have not had stellar starburst produced by interactions with other galaxies and the gas is consumed more slowly, therefore their stellar population do not have undergone any strong acceleration processes in their recent lifetime. When we focus on SIP or SIT SF galaxies we can see that the SFR values are higher at a fixed mass (both in central and satellite galaxies). The successive interactions between the galaxies that form these pairs and triplets have enhanced star formation.
We also found that the SFR–M⋆ relation for SF isolated galaxies is tighter than SF SDSS galaxies. The scatter for isolated galaxies is 0.38 dex meanwhile the scatter in the DP17 sample is 0.45 dex. The values for SIP and SIT galaxies are also comparable with SDSS galaxies (0.41 dex and 0.44 dex, respectively). The scatter of the MS for SF galaxies is therefore affected by the local environment. The relation for the MS we obtained for isolated (SIG) SF galaxies in the local Universe is:
 (2)
(2)
with a =0.952 ± 0.005 and b = − 9.586 ± 0.052, as shown in Table 3. This relation, presented in Fig. 9, slightly differs from the MS defined by Duarte Puertas et al. (2017), where the small differences account for the effects of the local environment. We therefore propose this relation as a ground level nurture-free MS for SF galaxies in the local Universe.
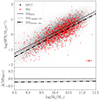 |
Fig. 9. Nurture-free main sequence defined for isolated SF galaxies with 8.5 ≤ log(M⋆/M⊙) ≤ 11.5. In addition, we represent the location of isolated SF galaxies in the diagram (red points). For comparison, we also show the relation for SF galaxies in Duarte Puertas et al. (2017) and the control sample (black continuous line and black dashed line, respectively), with grey points showing the values for SF galaxies in the DP17 sample. In the lower right corner we present a representative error, given by the median value of the error of the log SFR (multiplied by 10 for better visualisation) for each sample following the colours in the legends, and the median error of the log M⋆ for galaxies in the comparison sample from the MPA catalogue, which is in agreement with the error we consider for galaxies in the SIG, SIP, and SIT samples (log (M⋆/M⊙) = 0.10 dex). The lower panel show the average difference with the Main Sequence in Duarte Puertas et al. (2017). |
5.2. Oxygen abundance as a function of the M⋆
The SIG SF galaxies are located at the top of the MZR relation and can be considered as metal-rich galaxies. From Fig. 4 we show that the SIG galaxies present higher values, on average, than the sample of SF galaxies from Duarte Puertas et al. (2017), the SIP and SIT galaxies (considering both central and satellite galaxies) with mean values of 8.53 ± 0.01 dex, 8.46 ± 0.02 dex, 8.41 ± 0.02 dex and 8.38 ± 0.02 dex, respectively (as shown in Table 2). The difference in the oxygen abundance derived between the SIG galaxies and the SDSS galaxies is very small (∼0.05 dex) and is within the error range of the calibrators used to derive the oxygen abundance. This result is similar to what has been found in previous studies (e.g. Pilyugin et al. 2017). When we separated the central and satellite galaxies into the SIP and SIT systems, as presented in the central and right panels of Fig. 4, we found that the central galaxies, in SIP and SIT, show similar oxygen abundance values to those in the SIG galaxies and galaxies in the Central-CS, and therefore values similar to those obtained for field galaxies in the Duarte Puertas et al. (2017) sample. However, satellite galaxies show lower oxygen abundance values (∼0.18 dex) than central SF galaxies. These differences are larger than the proper uncertainty in the calibrators, and also larger than the difference found by Ellison et al. (2008) (0.05–0.1 dex). Therefore the difference we see in the left panel between the SIG galaxies with galaxies in the SIP and SIT is due to the properties of the satellite galaxies.
In summary, central galaxies present slightly higher abundances than SDSS galaxies, and satellite galaxies have significantly lower abundances. However, the differences that we observe in the MZR for SIP and SIT galaxies with respect to SDSS galaxies are mainly due to the stellar mass, being satellite galaxies in general less massive than central galaxies. The dispersion with respect to the MZR is smaller in isolated SF galaxies (0.06 dex) with respect to SDSS SF galaxies (0.09 dex), pairs, and triplets (0.08 dex for both samples). When SIP and SIT are separated in central and satellite galaxies, the dispersion in the MZR for centrals is similar to SIG galaxies (0.06 dex on average), while the dispersion for satellites is closer to SDSS galaxies (0.08 dex on average). Even if the MZR for SIG galaxies is also tighter than for SDSS SF galaxies, as in the case of the SFR–M⋆ relation, the differences are too small to be related to the local environment, and more sensitive to stellar mass. Therefore, SF galaxies in isolated systems follows the MZR for SF galaxies in the local Universe. Moreover, we do not have galaxies in the ‘outlier’ subsample of galaxies found by Duarte Puertas et al. (2022) that populate the youngest part of the 12 + log(O/H)–M⋆ diagram in all the stellar mass range, from dwarf galaxies to Milky-Way like stellar mass galaxies.
5.3. Fundamental relation
After visiting the stellar mass – SFR relation and the stellar mass – metallicity relation for SF galaxies in the SIG, SIP, and SIT, we explored the stellar mass – metallicity – SFR relation (MZSFR), known as the fundamental relation for SF galaxies, as presented in Fig. 6. We do not find that galaxies in isolated systems are located in a particular area, as we do not find either outlier galaxies. As expected, more massive galaxies in the three samples show higher values of SFR and 12 + log(O/H). Less massive galaxies, which in general are satellite galaxies in the SIP and SIT, show lower values of the SFR and oxygen abundance, populating that corresponding region of the MZSFR.
When exploring the three-dimensional MZSFR diagram as a function of Dn(4000), as shown in Fig. 6, we confirm the results of Duarte Puertas et al. (2022) for SF galaxies in the SDSS, where the MZSFR is found to be modelled by the age of the stellar populations. As expected, we find that galaxies with younger stellar populations have high SFR values at fixed 12 + log(O/H) while galaxies with older stellar populations have lower SFR values at fixed 12 + log(O/H). This correlation is also expected since Dn(4000) is also a parameter sensitive to the recent star formation history (Baker et al. 2023).
As originally found by Mannucci et al. (2010), Lara-López et al., and confirmed by simulations (Yates et al. 2012; Lagos et al. 2016), the fundamental relation between the stellar mass, the SFR, and the oxygen abundances defines a three-dimensional surface. The first-order fit to the data to a plane in the form of 12 + log(O/H) = a log(M⋆) + b log(SFR) + c (with a, b, and c constants) shows that the plane defined by isolated galaxies and central galaxies in pairs is similar (see Table 5), being the planes less steep than the planes defined by central SIT galaxies, and galaxies in the Centrals-CS and DP17 sample. The similarity between the plane defined by the SIG and SIP samples is explained by their similar MZR relations. However, we also find that the scatter of the MZSFR relation for SIG galaxies is the lowest with respect to any other sample, which might be related to the fact of showing also a tighter scatter in its MS relation. Considering that central galaxies have a similar stellar mass distribution (as shown in the upper panels of Fig. 4), we interpret that the difference in the slope between the plane defined by SDSS galaxies is due to the influences of their local and large-scale environments. Hence, as we did for the SFR–M⋆ relation for isolated SIG SF galaxies, we propose a nurture-free fundamental plane for galaxies evolving secularly, in an equilibrium between gas inflow, outflow and star formation. This relation is defined as:
 (3)
(3)
with a =0.17 ± 0.02, b = − 0.00001 ± 0.00994, and c =6.8 ± 0.2, as shown in Table 5. The uncertainties of the coefficients has been calculated using MCMC method within the mean errors of the stellar mass (0.1 dex), the SFR (0.008 dex), and the oxygen abundances (0.02 dex).
When performing the second-order fit to the data for SDSS galaxies, this shows curve shapes towards galaxies with high SFR and low 12 + log(O/H) values in the low-mass and high-mass ends. These shapes are not found in the fits for SF galaxies in the SIG, SIP, and SIT samples, confirming our previous results: galaxies in isolated systems do not populate the subsample of ‘outlier’ galaxies found by Duarte Puertas et al. (2022).
Median values of the distributions of Dn(4000) parameter for all the galaxies in this study.
5.4. Effect of the local environment and galactic conformity
5.4.1. Galactic conformity for star-forming galaxies
To explore the effect of the environment and galactic conformity in terms of the properties studied in this work, and to improve the statistical significance, we presented the results as a function of central versus satellite considering the SIP and SIT samples together. In general, there is no strong correlation between the SFR (or the sSFR), the oxygen abundance, and the Dn(4000) with the local environment, as shown in Fig. 7. However, central galaxies with the lowest values of Qlocal (< −4) also present low values of the SFR (mean log(SFR) = −0.57) and 12 + log(O/H) (mean value ∼8.41), in comparison with centrals with Qlocal > 0 (mean log(SFR) = 0.43 and mean 12 + log(O/H) =8.57, respectively). In case of satellite galaxies, the mean SFR increases from log(SFR) = −1.05 to log(SFR) = −0.46, and the mean oxygen abundance from 12 + log(O/H) =8.23 to 12 + log(O/H) =8.45, when Qlocal < −4 and Qlocal > 0, respectively. In a companion paper (Duarte Puertas et al., in prep.) we have found that galaxies with lower values of Qlocal have higher values of projected distance between central and satellite galaxies and, therefore, are more isolated. On the other hand, according to Vásquez-Bustos et al. (2023), galaxies in isolated systems with Qlocal > −2 shows signs of interactions. These systems are therefore mainly composed of central galaxies with high values of the SFR and gas-phase metallicity (8.5 < 12 + log(O/H) < 8.6).
In terms of galactic conformity, there is a correlation between the SFR of the central galaxy and its satellite. Low SFR centrals have low SFR satellites (in particular systems with low Qlocal), and high SFR centrals have high SFR satellites, where the SFR of the satellites is in general lower than central galaxies in all cases. In other words, in the upper panel of Fig. 8 we show that, for most isolated systems where both members are SF galaxies, the SFR of the central galaxy is higher than the one of the satellite galaxy. This correlation disappears when normalising by the stellar mass of the galaxies (sSFR). Therefore, in terms of SFR, central and satellites are disturbed in the same proportion with respect to their own mass.
We observe two trends when considering the oxygen abundances of the central galaxy. Systems with low Qlocal are in general composed of centrals with low 12 + log(O/H) (< 8.4 dex) and slightly lower satellites (< 8.3 dex). On the other hand, centrals with high 12 + log(O/H) values (> 8.4 dex) have all ranges of values for satellites, independently on the tidal strength parameter of the system. Looking at the oxygen abundances of the satellites, satellite galaxies with 12 + log(O/H) < 8.3 dex have central galaxies presenting values in the range of 8.1 dex to solar7, while for satellite galaxies with 12 + log(O/H) > 8.3 dex, the central galaxies show a nearly constant value around the solar value. These trends are observable in pairs (289 central-satellite associations) and triplets (106 central-satellite associations). Therefore to show these with a larger statistic, we considered the two isolated systems for a total of 395 centrals and their respective satellite.
5.4.2. Galactic conformity for all BPT galaxies
In agreement with our previous findings, we do not observe any correlation for the Dn(4000) parameter. This might be due to the fact that we are focusing on SF galaxies only, and then central and satellites have, in general, young stellar populations. Therefore, to explore the galactic conformity in isolated systems in terms of the age of the stellar populations, we consider the Dn(4000) for all central and their respective satellites, independently on their classification in the BPT diagram. The distribution for galaxies in each sample is shown in Fig. 10, where Table 6 shows the median values when separating into young and old stellar populations. As is also presented in the table, the fraction of young galaxies is in general higher than the fraction of old galaxies in all the samples and subsamples (central and satellite galaxies), except in central SIT galaxies, where the fraction of old galaxies is about 15% higher than young galaxies. The difference between the fraction of young and old galaxies is minimal in the comparison sample (∼3% only), where the difference in the SIG and central galaxies in the SIP is about 15% and 3.5%, respectively. This indicates that when considering all the galaxies (independently of their position in the BPT diagram), there are more young galaxies in the SIG than in the comparison sample; however SF isolated galaxies are systematically older, considering our previous results regarding the stellar mass – SFR relation.
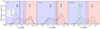 |
Fig. 10. Distributions of the Dn(4000) for all galaxies (SF, composite, and AGN), following the format in Fig. 4. Vertical lines indicate the median values for all the galaxies in each sample, with the respective colour and line style according to the legend. Arrows indicate the median values when separating into young and old stellar populations (blue and red areas, respectively). The corresponding median values and standard deviations are presented in Table 6. |
In Fig. 11 we show the Dn(4000) of central galaxies with the local environment, coloured by the Dn(4000) of satellite galaxies (left panel), and the Dn(4000) of central galaxies with the Dn(4000) of its corresponding satellite, coloured by the local environment (right panel). We do not find any relation with the Qlocal parameter. Regarding galactic conformity, we find that the Dn(4000) of satellites is, in general, lower than central, with values typically under 1.4 dex, and a wide range of values for central galaxies. Moreover, we find that in general the difference in the fraction between young and old galaxies is greater in the satellite than in central galaxies (as shown in Table 6). The fraction of young satellites in the SIP is 72% larger than the fraction of old satellites, and about 60% in the SIT. These trends are expected by sample selection, where the central galaxy is generally more massive than satellites, and therefore older, presenting more early-type morphologies (Duarte-Puertas et al., in prep.). Systems with low values of the Dn(4000) for both, central and satellite, are found in systems with intermediate (∼ − 2) and extreme (< −5 and > 0) Qlocal values. The median Dn(4000) for SIP and SIT centrals is higher than SIG galaxies (0.06 and 0.16 dex, respectively, as shown in the central panel of Fig. 10), therefore isolated galaxies are slightly younger than central galaxies in isolated pairs and isolated triplets. However, when separating into young and old stellar populations (see Table 6), the differences between centrals and isolated galaxies are much smaller, with young centrals slightly younger than young isolated galaxies, even if the fraction of young central galaxies in the SIT is lower. Systems with Qlocal > −2 and low values of Dn(4000) for central and satellite, might be then the case where interaction with the satellite is rejuvenating the stellar populations of the galaxies, as suggested in Vásquez-Bustos et al. (2023) for isolated triplets. In the case of systems with Qlocal < −4 (systems with largest protected separations between central and satellites), these are mainly isolated pairs with satellites with mean Dn(4000) = 1.2, for which a mean stellar age younger than 150 Myr is expected (Mateus et al. 2006). It might be worthy to explore if these ‘loose’ isolated systems are also mainly found in isolated large-scale environments, as cosmic voids, for instance, and therefore their dynamic evolution is slower than in denser environments.
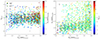 |
Fig. 11. Uper panel: Effect of the environment on the Dn(4000) as in Fig. 7 but for all the galaxies in the samples (SF, composite, and AGN). Right panel: Galactic conformity on the Dn(4000) as in Fig. 8 but for all the galaxies in the samples (SF, composite, and AGN). The median trends and dispersion are shown as a function of the Dn(4000) of the central galaxy (squares and error bars, respectively coloured according to the corresponding colour bar). |
6. Summary and conclusions
In this study we establish the relations between stellar mass, gas-phase metallicity, and SFR (i.e. the mass-metallicity, MZR, and the star formation rate-mass relation, SFRM) for galaxies in the SDSS catalogue of Isolated Galaxies (SIG), SDSS catalogue of Isolated Pairs (SIP), and SDSS catalogue of Isolated Triplets (SIT) compiled by Argudo-Fernández et al. (2015), to explore the influence of the environment on these relations in isolated systems in the local Universe (with 0.005 ≤ z ≤ 0.080).
The systems are isolated without neighbours in a volume of 1 Mpc projected field radius and a line-of-sight velocity difference Δv = 500 km s−1. Argudo-Fernández et al. (2015) explored the distribution of projected distances (d) and Δv of the galaxies in pairs and triplets to define physically bound isolated systems when Δv ≤ 160 km s−1 at projected distance d ≤ 450 kpc. We use the tidal strength parameter, Qlocal, provided by Argudo-Fernández et al. (2015) for the galaxies in these samples to explore the effects of the local environment.
We made use of public information of stellar masses and emission line fluxes provided by Max-Planck-Institut für Astrophysik and Johns Hopkins University (MPA-JHU, Kauffmann et al. 2003a; Brinchmann et al. 2004; Tremonti et al. 2004; Salim et al. 2007) to select 1282 SF isolated galaxies (out of 3702 galaxies in the SIG), 1209 SF galaxies isolated pairs (out of 2480 galaxies in the SIP), and 460 SF galaxies in isolated triplets (out of 945 galaxies in the SIT).
We used aperture-corrected methods to derive the SFR in these galaxies according to Duarte Puertas et al. (2022). We derive the oxygen abundance using the empirical calibration S of Pilyugin & Grebel (2016) from the [S II] emission line since the emission line [O II]λ,3727,3729 is not covered in the optical SDSS spectra for galaxies with z < 0.02. We also used the Dn(4000) spectral index, as defined in Balogh et al. (1999), as the stellar population age indicator (Mateus et al. 2006), which is small (Dn(4000) ≤ 1.67) for galaxies with younger stellar populations, and large (Dn(4000) > 1.67) for older stellar populations.
Our main conclusions are the following:
-
The SFRM for SF isolated galaxies shows a tighter correlation than the comparison sample of SF galaxies from the SDSS. We also find that, at fixed stellar mass, the SIG SF galaxies present lower SFR. This indicates that isolated galaxies have not had stellar starburst produced by interactions with other galaxies and the gas is consumed more slowly. Based on our results, we propose a ground level nurture-free SFR–M⋆ relation for SF galaxies in the local Universe.
-
The slope in the main sequence is comparable in all samples. However, the effect of the addition of one companion galaxy is noticeable in the SIG, SIP and SIT samples, with higher SFR values at fixed stellar mass. We also find that the successive interactions between galaxies that form isolated pairs and isolated triplets, both for central and satellites, have enhanced their star formation.
-
When exploring the MZR relation, we do not find a significant difference between isolated galaxies and field galaxies. However, when we explore central and satellite galaxies in isolated pairs and triplets, we find that central galaxies present oxygen abundances comparable with isolated galaxies, being more metal-rich than satellites. Therefore, the average abundance content on central galaxies is not altered by the presence of their companion.
-
SF galaxies in isolated galaxies, isolated pairs, and isolated triplets follow the fundamental relation, we have not found outlier galaxies. When exploring this relation as a function of the age, we find that galaxies with younger stellar populations have high SFR values at fixed 12 + log(O/H), while galaxies with older stellar populations have lower SFR values at fixed 12 + log(O/H).
-
In general, we do not find a strong correlation of these relations with the local environment in isolated pairs and isolated triplets. However, systems composed of central galaxies with high values of the SFR and gas-phase metallicity (8.5 < 12 + log(O/H) < 8.6) present high tidal strength parameter (Qlocal > − 2), which indicates that interactions might be happening between their member galaxies. The low values of Dn(4000) for central and satellite in these cases, might be indicating that the interaction with the satellite is rejuvenating the stellar populations of central galaxies.
-
For most isolated systems where both members are SF galaxies, the SFR of the central galaxy is higher than the one of the satellite galaxy. This correlation disappears when normalising by the stellar mass of the galaxies. This means that, in terms of SFR, central and satellites are disturbed in the same proportion with respect to their own mass.
-
Low oxygen abundance satellites in isolated pair and isolated triplets are found around all ranges of values for central galaxies; however high oxygen abundance satellites are found mainly surrounding high metallicity central galaxies.
Overall SF galaxies in isolated systems (isolated galaxies, isolated pairs, and isolated triplets) follow the expected correlations between SFR, stellar mass, and gas-phase metallicity for SF galaxies in the local Universe. These correlations are tighter for isolated galaxies. Therefore we propose a ‘nurture-free’ main sequence and fundamental plane for galaxies evolving evolving secularly, in an equilibrium between gas inflow, outflow and star formation. We do not find outlier galaxies in the fundamental relation. Star formation in isolated galaxies and central galaxies in isolated pairs and isolated triplets is mainly regulated by smooth secular processes. A slight increment of the SFR and metallicity is observed for both, central and satellite galaxies in isolated pairs and isolated triplets where interactions might be occurring in the systems.
Data availability
Full Table 1 is available at the CDS via anonymous ftp to cdsarc.cds.unistra.fr (130.79.128.5) or via https://cdsarc.cds.unistra.fr/viz-bin/cat/J/A+A/695/A256
Available at http://www.mpa-garching.mpg.de/SDSS/
We define S/N as the ratio between the flux and the error flux.
Eq. (6) in Duarte Puertas et al. (2017) parametrised the ηHα parameter, see also Fig. 7 in Brinchmann et al. (2004) for more details.
The empirical calibrators are calibrated against direct derivations of abundances that are taken into account electron temperature measurements.
The uncertainties for the Dn(4000) are taken from MPA-JHU.
Uncertainties: a Python package for calculations with uncertainties, Eric O. LEBIGOT, http://pythonhosted.org/uncertainties/
Solar metallicity: 12 + log(O/H) = 8.69 (Asplund et al. 2009).
Acknowledgments
We thank our referee whose valuable comments have certainly contributed to improve and clarify this paper. We acknowledge financial support from projects PID2020-113689GB-I00 and PID2023-149578NB-I00, financed by MCIN/AEI/10.13039/501100011033 and FEDER/UE; from FEDER/Junta de Andalucía-Consejería de Transformación Económica, Industria, Conocimiento y Universidades/Proyecto A-FQM-510-UGR20; from grant AST22_4.4 financed by Junta de Andalucía-Consejería de Universidad, Investigación e Innovación and Gobierno de España and European Union-NextGenerationEU; and from projects P20_00334 and FQM 108 financed by the Junta de Andalucía. M.A-F. acknowledges support from ANID FONDECYT iniciación project 11200107 and the Emergia program (EMERGIA20_38888) from Consejería de Universidad, Investigación e Innovación de la Junta de Andalucía. S.D.P. acknowledges financial support from Juan de la Cierva Formación fellowship (FJC2021-047523-I) financed by MCIN/AEI/10.13039/501100011033 and by the European Union “NextGenerationEU”/PRTR, Ministerio de Economía y Competitividad under grant PID2019-107408GB-C44 and PID2022-136598NB-C32, and also from the Fonds de Recherche du Québec – Nature et Technologies. Funding for SDSS-III has been provided by the Alfred P. Sloan Foundation, the Participating Institutions, the National Science Foundation, and the U.S. Department of Energy Office of Science. The SDSS-III web site is http://www.sdss3.org/. SDSS-III is managed by the Astrophysical Research Consortium for the Participating Institutions of the SDSS-III Collaboration including the University of Arizona, the Brazilian Participation Group, Brookhaven National Laboratory, Carnegie Mellon University, University of Florida, the French Participation Group, the German Participation Group, Harvard University, the Instituto de Astrofisica de Canarias, the Michigan State/Notre Dame/JINA Participation Group, Johns Hopkins University, Lawrence Berkeley National Laboratory, Max Planck Institute for Astrophysics, Max Planck Institute for Extraterrestrial Physics, New Mexico State University, New York University, Ohio State University, Pennsylvania State University, University of Portsmouth, Princeton University, the Spanish Participation Group, University of Tokyo, University of Utah, Vanderbilt University, University of Virginia, University of Washington, and Yale University. We acknowledge the use of STILTS and TOPCAT tools Taylor (2005). This research made use of Astropy, a community-developed core Python (http://www.python.org) package for Astronomy (Astropy Collaboration 2013, 2018); ipython (Pérez & Granger 2007); matplotlib (Hunter 2007); SciPy, a collection of open source software for scientific computing in Python (Virtanen et al. 2020); pandas, an open source data analysis and manipulation tool (The pandas development team 2020; Wes McKinney 2010); NumPy, a structure for efficient numerical computation (van der Walt et al. 2011); and Uncertainties: a Python package for calculations with uncertainties, Eric O. Lebigot, http://pythonhosted.org/uncertainties/.
References
- Ahn, C. P., Alexandroff, R., Allende Prieto, C., et al. 2014, ApJS, 211, 17 [NASA ADS] [CrossRef] [Google Scholar]
- Alam, S., Albareti, F. D., Allende Prieto, C., et al. 2015, ApJS, 219, 12 [Google Scholar]
- Andrews, B. H., & Martini, P. 2013, ApJ, 765, 140 [NASA ADS] [CrossRef] [Google Scholar]
- Argudo-Fernández, M., Verley, S., Bergond, G., et al. 2013, A&A, 560, A9 [NASA ADS] [CrossRef] [EDP Sciences] [Google Scholar]
- Argudo-Fernández, M., Verley, S., Bergond, G., et al. 2014, A&A, 564, A94 [NASA ADS] [CrossRef] [EDP Sciences] [Google Scholar]
- Argudo-Fernández, M., Verley, S., Bergond, G., et al. 2015, A&A, 578, A110 [NASA ADS] [CrossRef] [EDP Sciences] [Google Scholar]
- Asplund, M., Grevesse, N., Sauval, A. J., & Scott, P. 2009, ARA&A, 47, 481 [NASA ADS] [CrossRef] [Google Scholar]
- Astropy Collaboration (Robitaille, T. P., et al.) 2013, A&A, 558, A33 [NASA ADS] [CrossRef] [EDP Sciences] [Google Scholar]
- Astropy Collaboration (Price-Whelan, A. M., et al.) 2018, AJ, 156, 123 [Google Scholar]
- Baker, W. M., Maiolino, R., Belfiore, F., et al. 2023, MNRAS, 519, 1149 [Google Scholar]
- Baldwin, J. A., Phillips, M. M., & Terlevich, R. 1981, PASP, 93, 5 [Google Scholar]
- Balogh, M. L., Morris, S. L., Yee, H. K. C., Carlberg, R. G., & Ellingson, E. 1999, ApJ, 527, 54 [Google Scholar]
- Behroozi, P. S., Conroy, C., & Wechsler, R. H. 2010, ApJ, 717, 379 [Google Scholar]
- Blanton, M. R., & Roweis, S. 2007, AJ, 133, 734 [NASA ADS] [CrossRef] [Google Scholar]
- Brinchmann, J., Charlot, S., White, S. D. M., et al. 2004, MNRAS, 351, 1151 [Google Scholar]
- Cardelli, J. A., Clayton, G. C., & Mathis, J. S. 1989, ApJ, 345, 245 [Google Scholar]
- Charlot, S., Kauffmann, G., Longhetti, M., et al. 2002, MNRAS, 330, 876 [NASA ADS] [CrossRef] [Google Scholar]
- Cid Fernandes, R., Asari, N. V., Sodré, L., et al. 2007, MNRAS, 375, L16 [NASA ADS] [CrossRef] [Google Scholar]
- Cresci, G., Mannucci, F., & Curti, M. 2019, A&A, 627, A42 [NASA ADS] [CrossRef] [EDP Sciences] [Google Scholar]
- Curti, M., Cresci, G., Mannucci, F., et al. 2017, MNRAS, 465, 1384 [Google Scholar]
- Curti, M., Mannucci, F., Cresci, G., & Maiolino, R. 2020, MNRAS, 491, 944 [Google Scholar]
- Daddi, E., Dickinson, M., Morrison, G., et al. 2007, ApJ, 670, 156 [NASA ADS] [CrossRef] [Google Scholar]
- Donnari, M., Pillepich, A., Nelson, D., et al. 2019, MNRAS, 485, 4817 [Google Scholar]
- Duarte Puertas, S., Vilchez, J. M., Iglesias-Páramo, J., et al. 2017, A&A, 599, A71 [NASA ADS] [CrossRef] [EDP Sciences] [Google Scholar]
- Duarte Puertas, S., Vilchez, J. M., Iglesias-Páramo, J., et al. 2021, A&A, 645, A57 [NASA ADS] [CrossRef] [EDP Sciences] [Google Scholar]
- Duarte Puertas, S., Vilchez, J. M., Iglesias-Páramo, J., et al. 2022, A&A, 666, A186 [NASA ADS] [CrossRef] [EDP Sciences] [Google Scholar]
- Duplancic, F., Dávila-Kurbán, F., Coldwell, G. V., Alonso, S., & Galdeano, D. 2020, MNRAS, 493, 1818 [CrossRef] [Google Scholar]
- Ellison, S. L., Patton, D. R., Simard, L., & McConnachie, A. W. 2008, ApJ, 672, L107 [NASA ADS] [CrossRef] [Google Scholar]
- Ellison, S. L., Thorp, M. D., Pan, H.-A., et al. 2020, MNRAS, 492, 6027 [NASA ADS] [Google Scholar]
- Ellison, S. L., Lin, L., Thorp, M. D., et al. 2021, MNRAS, 501, 4777 [NASA ADS] [CrossRef] [Google Scholar]
- Erb, D. K., Shapley, A. E., Pettini, M., et al. 2006, ApJ, 644, 813 [NASA ADS] [CrossRef] [Google Scholar]
- Finlator, K., & Davé, R. 2008, MNRAS, 385, 2181 [NASA ADS] [CrossRef] [Google Scholar]
- Foster, C., Hopkins, A. M., Gunawardhana, M., et al. 2012, A&A, 547, A79 [NASA ADS] [CrossRef] [EDP Sciences] [Google Scholar]
- Fraser-McKelvie, A., Cortese, L., Groves, B., et al. 2022, MNRAS, 510, 320 [Google Scholar]
- Gao, Y., & Solomon, P. M. 2004, ApJ, 606, 271 [NASA ADS] [CrossRef] [Google Scholar]
- Gao, Y., Wang, E., Kong, X., et al. 2018, ApJ, 868, 89 [NASA ADS] [CrossRef] [Google Scholar]
- Greener, M. J., Aragón-Salamanca, A., Merrifield, M., et al. 2022, MNRAS, 516, 1275 [NASA ADS] [Google Scholar]
- Heckman, T. M., Armus, L., & Miley, G. K. 1990, ApJS, 74, 833 [Google Scholar]
- Hirashita, H., Buat, V., & Inoue, A. K. 2003, A&A, 410, 83 [NASA ADS] [CrossRef] [EDP Sciences] [Google Scholar]
- Hopkins, A. M., Miller, C. J., Nichol, R. C., et al. 2003, ApJ, 599, 971 [Google Scholar]
- Hunter, J. D. 2007, Comput. Sci. Eng., 9, 90 [NASA ADS] [CrossRef] [Google Scholar]
- Iglesias-Páramo, J., Vílchez, J. M., Galbany, L., et al. 2013, A&A, 553, L7 [NASA ADS] [CrossRef] [EDP Sciences] [Google Scholar]
- Iglesias-Páramo, J., Vílchez, J. M., Rosales-Ortega, F. F., et al. 2016, ApJ, 826, 71 [Google Scholar]
- Kauffmann, G., Heckman, T. M., White, S. D. M., et al. 2003a, MNRAS, 341, 33 [Google Scholar]
- Kauffmann, G., Heckman, T. M., Tremonti, C., et al. 2003b, MNRAS, 346, 1055 [Google Scholar]
- Kennicutt, R. C., Jr. 1998, ApJ, 498, 541 [Google Scholar]
- Kewley, L. J., Dopita, M. A., Sutherland, R. S., Heisler, C. A., & Trevena, J. 2001, ApJ, 556, 121 [Google Scholar]
- Kroupa, P. 2001, MNRAS, 322, 231 [NASA ADS] [CrossRef] [Google Scholar]
- Lagos, C. d. P., Theuns, T., Schaye, J., et al. 2016, MNRAS, 459, 2632 [NASA ADS] [CrossRef] [Google Scholar]
- Lara-López, M. A., Cepa, J., Bongiovanni, A., et al. 2010, A&A, 521, L53 [CrossRef] [EDP Sciences] [Google Scholar]
- Lara-López, M. A., López-Sánchez, Á. R., & Hopkins, A. M. 2013, ApJ, 764, 178 [CrossRef] [Google Scholar]
- Lilly, S. J., Carollo, C. M., Pipino, A., Renzini, A., & Peng, Y. 2013, ApJ, 772, 119 [NASA ADS] [CrossRef] [Google Scholar]
- Lin, L., Pan, H.-A., Ellison, S. L., et al. 2019, ApJ, 884, L33 [NASA ADS] [CrossRef] [Google Scholar]
- Lin, L., Ellison, S. L., Pan, H.-A., et al. 2020, ApJ, 903, 145 [CrossRef] [Google Scholar]
- Mannucci, F., Cresci, G., Maiolino, R., Marconi, A., & Gnerucci, A. 2010, MNRAS, 408, 2115 [NASA ADS] [CrossRef] [Google Scholar]
- Mateus, A., Sodré, L., Cid Fernandes, R., et al. 2006, MNRAS, 370, 721 [NASA ADS] [CrossRef] [Google Scholar]
- McKinney, W. 2010, Proceedings of the 9th Python in Science Conference, 56 [Google Scholar]
- Mesa, V., Alonso, S., Coldwell, G., Lambas, D. G., & Nilo Castellon, J. L. 2021, MNRAS, 501, 1046 [Google Scholar]
- Namiki, S. V., Koyama, Y., Koyama, S., et al. 2021, ApJ, 918, 68 [Google Scholar]
- Noeske, K. G., Weiner, B. J., Faber, S. M., et al. 2007, ApJ, 660, L43 [CrossRef] [Google Scholar]
- O’Donnell, J. E. 1994, ApJ, 422, 158 [Google Scholar]
- O’Kane, C. J., Kuchner, U., Gray, M. E., & Aragón-Salamanca, A. 2024, MNRAS, 534, 1682 [CrossRef] [Google Scholar]
- Osterbrock, D. E. 1989, Astrophysics of Gaseous Nebulae and Active Galactic Nuclei (University Science Books) [Google Scholar]
- Pearson, W. J., Wang, L., Brough, S., et al. 2021, A&A, 646, A151 [NASA ADS] [CrossRef] [EDP Sciences] [Google Scholar]
- Peng, Y.-J., Lilly, S. J., Kovač, K., et al. 2010, ApJ, 721, 193 [Google Scholar]
- Pérez, F., & Granger, B. E. 2007, Comput. Sci. Eng., 9, 21 [Google Scholar]
- Pérez-Montero, E. 2014, MNRAS, 441, 2663 [CrossRef] [Google Scholar]
- Pérez-Montero, E., & Contini, T. 2009, MNRAS, 398, 949 [CrossRef] [Google Scholar]
- Pessa, I., Schinnerer, E., Belfiore, F., et al. 2021, A&A, 650, A134 [NASA ADS] [CrossRef] [EDP Sciences] [Google Scholar]
- Pilyugin, L. S., & Grebel, E. K. 2016, MNRAS, 457, 3678 [NASA ADS] [CrossRef] [Google Scholar]
- Pilyugin, L. S., Lara-López, M. A., Grebel, E. K., et al. 2013, MNRAS, 432, 1217 [NASA ADS] [CrossRef] [Google Scholar]
- Pilyugin, L. S., Grebel, E. K., Zinchenko, I. A., Nefedyev, Y. A., & Mattsson, L. 2017, MNRAS, 465, 1358 [CrossRef] [Google Scholar]
- Popesso, P., Concas, A., Morselli, L., et al. 2019, MNRAS, 483, 3213 [Google Scholar]
- Sabater, J., Best, P. N., & Argudo-Fernández, M. 2013, MNRAS, 430, 638 [Google Scholar]
- Salim, S., Rich, R. M., Charlot, S., et al. 2007, ApJS, 173, 267 [NASA ADS] [CrossRef] [Google Scholar]
- Sampaio, V. M., de Carvalho, R. R., Aragón-Salamanca, A., et al. 2024, MNRAS, 532, 982 [NASA ADS] [CrossRef] [Google Scholar]
- Sánchez Almeida, J., & Sánchez-Menguiano, L. 2019, ApJ, 878, L6 [CrossRef] [Google Scholar]
- Sánchez-Menguiano, L., Sánchez Almeida, J., Muñoz-Tuñón, C., et al. 2019, ApJ, 882, 9 [CrossRef] [Google Scholar]
- Savaglio, S., Glazebrook, K., Le Borgne, D., et al. 2005, in The Spectral Energy Distributions of Gas-Rich Galaxies: Confronting Models with Data, eds. C. C. Popescu, & R. J. Tuffs, (AIP), AIP Conf. Ser., 761, 425 [Google Scholar]
- Schlegel, D. J., Finkbeiner, D. P., & Davis, M. 1998, ApJ, 500, 525 [Google Scholar]
- Schmidt, M. 1959, ApJ, 129, 243 [NASA ADS] [CrossRef] [Google Scholar]
- Storey, P. J., & Hummer, D. G. 1995, MNRAS, 272, 41 [NASA ADS] [CrossRef] [Google Scholar]
- Stott, J. P., Sobral, D., Bower, R., et al. 2013, MNRAS, 436, 1130 [CrossRef] [Google Scholar]
- Strauss, M. A., Weinberg, D. H., Lupton, R. H., et al. 2002, AJ, 124, 1810 [Google Scholar]
- Tacconi, L. J., Genzel, R., Saintonge, A., et al. 2018, ApJ, 853, 179 [Google Scholar]
- Taylor, M. B. 2005, in Astronomical Data Analysis Software and Systems XIV, eds. P. Shopbell, M. Britton, & R. Ebert, ASP Conf. Ser., 347, 29 [Google Scholar]
- The pandas development team 2020, https://doi.org/10.5281/zenodo.3509134 [Google Scholar]
- Tremonti, C. A., Heckman, T. M., Kauffmann, G., et al. 2004, ApJ, 613, 898 [Google Scholar]
- Tumlinson, J., Thom, C., Werk, J. K., et al. 2011, Science, 334, 948 [CrossRef] [Google Scholar]
- Tumlinson, J., Peeples, M. S., & Werk, J. K. 2017, ARA&A, 55, 389 [Google Scholar]
- Vale Asari, N., Stasińska, G., Cid Fernandes, R., et al. 2009, MNRAS, 396, L71 [NASA ADS] [Google Scholar]
- van der Walt, S., Colbert, S. C., & Varoquaux, G. 2011, Comput. Sci. Eng., 13, 22 [Google Scholar]
- Vásquez-Bustos, P., Argudo-Fernandez, M., Grajales-Medina, D., Duarte Puertas, S., & Verley, S. 2023, A&A, 670, A63 [NASA ADS] [CrossRef] [EDP Sciences] [Google Scholar]
- Vásquez-Bustos, P., Argudo-Fernández, M., Boquien, M., et al. 2025, A&A, in press, https://doi.org/10.1051/0004-6361/202451464 [NASA ADS] [CrossRef] [EDP Sciences] [Google Scholar]
- Veilleux, S., & Osterbrock, D. E. 1987, ApJS, 63, 295 [Google Scholar]
- Verley, S., Combes, F., Verdes-Montenegro, L., Bergond, G., & Leon, S. 2007a, A&A, 474, 43 [NASA ADS] [CrossRef] [EDP Sciences] [Google Scholar]
- Verley, S., Leon, S., Verdes-Montenegro, L., et al. 2007b, A&A, 472, 121 [NASA ADS] [CrossRef] [EDP Sciences] [Google Scholar]
- Verley, S., Odewahn, S. C., Verdes-Montenegro, L., et al. 2007c, A&A, 470, 505 [NASA ADS] [CrossRef] [EDP Sciences] [Google Scholar]
- Virtanen, P., Gommers, R., Oliphant, T. E., et al. 2020, Nat. Methods, 17, 261 [Google Scholar]
- Wang, E., & Lilly, S. J. 2021, ApJ, 910, 137 [NASA ADS] [CrossRef] [Google Scholar]
- Whitaker, K. E., van Dokkum, P. G., Brammer, G., & Franx, M. 2012, ApJ, 754, L29 [Google Scholar]
- Wu, Y.-Z., & Zhang, W. 2021, MNRAS, 503, 2340 [NASA ADS] [CrossRef] [Google Scholar]
- Yates, R. M., Kauffmann, G., & Guo, Q. 2012, MNRAS, 422, 215 [NASA ADS] [CrossRef] [Google Scholar]
- York, D. G., Adelman, J., Anderson, J. E., Jr., et al. 2000, AJ, 120, 1579 [NASA ADS] [CrossRef] [Google Scholar]
- Zahid, H. J., Kudritzki, R.-P., Conroy, C., Andrews, B., & Ho, I. T. 2017, ApJ, 847, 18 [Google Scholar]
All Tables
Mean and median values of the distributions of physical properties for SF galaxies in this study.
Median values of the distributions of Dn(4000) parameter for all the galaxies in this study.
All Figures
|
Fig. 1. [O III]λ 5007/Hβ versus [N II]λ 6583/Hα diagnostic diagram (BPT) for isolated galaxies (left panel), galaxies in isolated pairs (middle panel), and galaxies in isolated triplets (right panel). In each panel, blue, green, and red points represent SF galaxies, composite galaxies, and AGN galaxies, respectively. Grey points show the position in the BPT diagram of the SDSS galaxies in the MPA-JHU catalogue. The dashed line shows the Kewley et al. (2001) demarcation and the continuous line shows the Kauffmann et al. (2003b) curve. |
| In the text | |
|
Fig. 2. Distributions of the stellar mass for SF galaxies in the samples used in this work. From left to right: Distributions for all the galaxies (including both central and satellites for isolated pairs and isolated triplets); distributions for isolated and central galaxies in isolated pairs and triplets; and distributions for satellite galaxies in isolated pairs (dash-dotted light-green distribution) and triplets (dash-dotted cyan distribution). The distributions in the first two panels follow line style and colours as indicated in the legend. We note that in the last panel we keep the distribution for isolated galaxies for reference. For reference, we also show the distribution for the DP17 sample, extended for low-mass galaxies (log(M⋆/M⊙) < 8.5) as explained in Sect. 2.3 and the Centrals-CS sample in all the panels. The median values for each subsample of galaxies are indicated by a vertical line, following the respective colour and line style of each distribution. The number of galaxies in each sample, as well as their corresponding median values, standard deviations, mean values and associated errors, are presented in Table 2. |
| In the text | |
|
Fig. 3. Stellar mass completeness as a function of redshift for central galaxies (black dash-dotted line) and the control sample (magenta dashed line) within a stellar mass range 8.5 ≤ log(M⋆/M⊙) ≤ 11.5 (1703 central galaxies and 5086 galaxies in the control sample). The completeness has been estimated using the 95% percentile of stellar mass at redshift bins with a width of 0.005 and applying a logarithmic fit of the form log10(M⋆/M⊙) = A + B log10(z) over the redshift range. |
| In the text | |
|
Fig. 4. Distributions of the SFR, sSFR, oxygen abundance, and Dn(4000), from upper to lower panels, for SF galaxies in the samples used in this work (similar to Fig. 2). The median values for each subsample of galaxies are indicated by a vertical line, following the respective colour and line style of each distribution. The number of galaxies in each sample, as well as their corresponding median values, standard deviations, mean values and associated errors, are presented in Table 2. |
| In the text | |
|
Fig. 5. Relation between the SFR and M⋆ (left panel) and the 12 + log(O/H) and M⋆ (right panel) for central SF galaxies with 8.5 ≤ log(M⋆/M⊙) ≤ 11.5. The relations are presented as the first and third order fit (respectively) to the running median in both axes. The relations for SIG galaxies (red dashed line) and central galaxies in the SIP and SIT (in green and blue dashed lines, respectively) are represented with their corresponding 1σ error. For comparison, we also show the relations for SF galaxies in DP17 and the control sample (black dotted line and grey dashed line, respectively). The number of galaxies considered in bin for each sample, as well as the parameters of the fits with their corresponding uncertainties, are presented in Table 3 and Table 4, respectively. |
| In the text | |
|
Fig. 6. Fundamental relation (SFR–M⋆–O/H) for central SF galaxies with 8.5 ≤ log (M⋆/M⊙) ≤ 11.5 colour coded by the galaxy Dn(4000). The marker size in the left panel is proportional to the 12 + log(O/H) values, while the marker size in the right panel is proportional to the SFR values. For reference, contours show the location of SF galaxies in the DP17 sample. |
| In the text | |
|
Fig. 7. Effect of the environment on the SFR, 12 + log(O/H), sSFR, and Dn(4000) for SF galaxies. Local tidal strength affecting the central galaxies in the isolated pairs (circles) and triplets (stars) versus: 1) the SFR of the central galaxy, coloured by the SFR of the satellite galaxy (left upper panel); 2) the 12 + log(O/H) of the central galaxy, coloured by the 12 + log(O/H) of the satellite galaxy (right upper panel); 3) the sSFR of the central galaxy, coloured by the sSFR of the satellite galaxy (left lower panel); and 4) the Dn(4000) of the central galaxy, coloured by the Dn(4000) of the satellite galaxy (right upper panel). Squares and error bars represent the median trend (coloured according to the colour bar of each panel) and dispersion, respectively, in three bins of the local tidal strength parameter (Qlocal ≤ −4, −4 < Qlocal ≤ 0, and Qlocal > 0). In the upper left on each panel we present a representative error, given by the median value of the error of the SFR (multiplied by 10 for better visualisation), 12 + log(O/H), sSFR, and Dn(4000) for central galaxies. The tidal strength parameter values from Argudo-Fernández et al. (2015) do not have an associated error. |
| In the text | |
|
Fig. 8. Galactic conformity on the SFR, 12 + log(O/H), sSFR, and Dn(4000) for SF galaxies, coloured by the local tidal strength affecting the central galaxies in the isolated pairs (circles) and isolated triplets (stars). Upper panel: the SFR of the central galaxy versus the SFR of the satellite galaxy. Second panel: 12 + log(O/H) of the central galaxy versus 12 + log(O/H) of the satellite galaxy. Third panel: sSFR of the central galaxy, versus the sSFR of the satellite galaxy. Lower panel: Dn(4000) of the central galaxy versus Dn(4000) of the satellite galaxy. Grey dashed line is 1:1 relationship. Squares and error bars represent the median trend (coloured according to the colour bar) and dispersion, respectively, in three bins of the SFR, 12 + log(O/H), sSFR, and Dn(4000). In the upper left on each panel we present a representative error, given by the median value of the error of the property in each panel for central and satellite galaxies. The median value of the uncertainties of the SFR is multiplied by 10 for better visualisation. |
| In the text | |
|
Fig. 9. Nurture-free main sequence defined for isolated SF galaxies with 8.5 ≤ log(M⋆/M⊙) ≤ 11.5. In addition, we represent the location of isolated SF galaxies in the diagram (red points). For comparison, we also show the relation for SF galaxies in Duarte Puertas et al. (2017) and the control sample (black continuous line and black dashed line, respectively), with grey points showing the values for SF galaxies in the DP17 sample. In the lower right corner we present a representative error, given by the median value of the error of the log SFR (multiplied by 10 for better visualisation) for each sample following the colours in the legends, and the median error of the log M⋆ for galaxies in the comparison sample from the MPA catalogue, which is in agreement with the error we consider for galaxies in the SIG, SIP, and SIT samples (log (M⋆/M⊙) = 0.10 dex). The lower panel show the average difference with the Main Sequence in Duarte Puertas et al. (2017). |
| In the text | |
|
Fig. 10. Distributions of the Dn(4000) for all galaxies (SF, composite, and AGN), following the format in Fig. 4. Vertical lines indicate the median values for all the galaxies in each sample, with the respective colour and line style according to the legend. Arrows indicate the median values when separating into young and old stellar populations (blue and red areas, respectively). The corresponding median values and standard deviations are presented in Table 6. |
| In the text | |
|
Fig. 11. Uper panel: Effect of the environment on the Dn(4000) as in Fig. 7 but for all the galaxies in the samples (SF, composite, and AGN). Right panel: Galactic conformity on the Dn(4000) as in Fig. 8 but for all the galaxies in the samples (SF, composite, and AGN). The median trends and dispersion are shown as a function of the Dn(4000) of the central galaxy (squares and error bars, respectively coloured according to the corresponding colour bar). |
| In the text | |
Current usage metrics show cumulative count of Article Views (full-text article views including HTML views, PDF and ePub downloads, according to the available data) and Abstracts Views on Vision4Press platform.
Data correspond to usage on the plateform after 2015. The current usage metrics is available 48-96 hours after online publication and is updated daily on week days.
Initial download of the metrics may take a while.