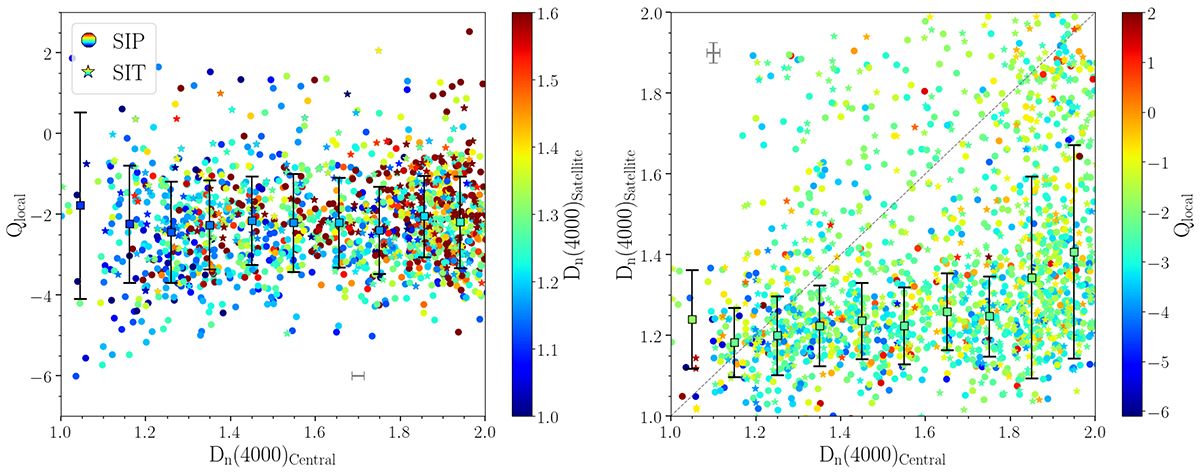
Fig. 11.
Download original image
Uper panel: Effect of the environment on the Dn(4000) as in Fig. 7 but for all the galaxies in the samples (SF, composite, and AGN). Right panel: Galactic conformity on the Dn(4000) as in Fig. 8 but for all the galaxies in the samples (SF, composite, and AGN). The median trends and dispersion are shown as a function of the Dn(4000) of the central galaxy (squares and error bars, respectively coloured according to the corresponding colour bar).
Current usage metrics show cumulative count of Article Views (full-text article views including HTML views, PDF and ePub downloads, according to the available data) and Abstracts Views on Vision4Press platform.
Data correspond to usage on the plateform after 2015. The current usage metrics is available 48-96 hours after online publication and is updated daily on week days.
Initial download of the metrics may take a while.