| Issue |
A&A
Volume 670, February 2023
|
|
|---|---|---|
| Article Number | A63 | |
| Number of page(s) | 12 | |
| Section | Extragalactic astronomy | |
| DOI | https://doi.org/10.1051/0004-6361/202245297 | |
| Published online | 06 February 2023 | |
Understanding the role of morphology and environment in the dynamical evolution of isolated galaxy triplets⋆
1
Instituto de Física, Pontificia Universidad Católica de Valparaíso, Casilla 4059 Valparaíso, Chile
e-mail: paulo.vasquez.b@mail.pucv.cl
2
Universidad de Granada (UGR), Departamento de Física Teórica y del Cosmos, Campus Fuente Nueva, Edificio Mecenas, 18071 Granada, Spain
3
Instituto Universitario Carlos I de Física Teórica y Computacional, Universidad de Granada, 18071 Granada, Spain
4
Facultad de Ingeniería, Departamento de Ciencias Básicas, Universidad Ean, Cl. 71 #9–84, Localidad de Chapinero, Bogotá, Cundinamarca, Colombia
5
Département de Physique, de Génie Physique et d’Optique, Université Laval, and Centre de Recherche en Astrophysique du Québec (CRAQ), Québec, QC G1V 0A6, Canada
6
Instituto de Astrofísica de Andalucía – CSIC, Glorieta de la Astronomía s.n., 18008 Granada, Spain
Received:
26
October
2022
Accepted:
16
November
2022
Context. The environments where galaxies reside affects their evolutionary histories. Galaxy triplets (systems composed of three physically bound galaxies) are one of simplest groups of galaxies, and are therefore excellent laboratories to study evolutionary mechanisms where effects of the environment are minimal.
Aims. We present a statistical study of the dynamical properties of isolated galaxy triplets as a function of their local and large-scale environments. To explore the connection of the dynamical evolution on the systems with the evolution of the galaxies composing the triplets, we consider observational properties such as morphology and star formation rate (SFR).
Methods. We used the SDSS-based catalogue of Isolated Triplets (SIT), which contains 315 triplets. We classified each triplet according to galaxy morphologies and defined a parameter Qtrip to quantify the total local tidal strengths in the systems. To quantify the dynamical stage of the system we used the parameters of harmonic radius RH, velocity dispersion σvr, crossing time H0tc, and virial mass Mvir.
Results. Triplets composed of three early-type galaxies present the smallest RH, indicating that they are in general more compact than triplets with one or more late-type galaxies. Among triplets with low values of RH and H0tc, SIT triplets with Qtrip < −2 are relaxed systems that are more dynamically evolved, while triplets with Qtrip > −2 show compact configurations due to interactions within the system, such as ongoing mergers.
Conclusions. We found that there is no dominant galaxy in triplets in terms of properties of stellar populations such as global colour and SFR. Moreover, the global SFR in isolated triplets composed of two or more early-type galaxies increases with the stellar mass ratio of the galaxies with respect to the central galaxy, therefore the system is globally ‘rejuvenated’.
Key words: galaxies: general / galaxies: evolution / galaxies: formation / galaxies: groups: general / galaxies: interactions
Full Table 1 is only available at the CDS via anonymous ftp to cdsarc.cds.unistra.fr (130.79.128.5) or via https://cdsarc.cds.unistra.fr/viz-bin/cat/J/A+A/670/A63
The Authors 2023
 Open Access article, published by EDP Sciences, under the terms of the Creative Commons Attribution License (https://creativecommons.org/licenses/by/4.0), which permits unrestricted use, distribution, and reproduction in any medium, provided the original work is properly cited.
This article is published in open access under the Subscribe-to-Open model. Subscribe to A&A to support open access publication.
1. Introduction
The distribution of galaxies in the universe is not homogeneous, it has been found that galaxies tend to group in structures composed of N galaxies where the most common are clusters with hundreds of galaxies (Ramella et al. 1994; Balogh et al. 1999; Lietzen et al. 2012). The simplest groups are galaxy triplets (Karachentseva et al. 1979; Karachentseva & Karachentseva 2000; Elyiv et al. 2009; Makarov & Karachentsev 2009), systems composed of three physically bound galaxies (N = 3). Originally, galaxy triplets were thought to be systems composed of a galaxy pair with a remote galaxy; however, recent studies have found that the majority of galaxy triplets show evidence of a long dynamical evolution where the system is embedded in a common dark matter halo and the member galaxies present similar properties (Chernin et al. 2000; Hernández-Toledo et al. 2011; Duplancic et al. 2013; Feng et al. 2016; Emel’yanov et al. 2016).
Recent analyses suggest that galaxy triplets composed of three luminous galaxies should not be considered as analogous to galaxy pairs with a third extra member, but rather as a natural extension of compact groups (Duplancic et al. 2015; Costa-Duarte et al. 2016). A compact group (CG) is a dense isolated galaxy system, composed of at least four galaxies, separated by a projected distance of the order of their size (50–100 kpc), and mean velocity dispersion about 230 km s−1 (Hickson 1982; Prandoni et al. 1994; McConnachie et al. 2009; Zheng & Shen 2020). As in CGs, the high compactness in galaxy triplets might promote strong interactions between the galaxy members, making galaxy triplets ideal laboratories for studying the environmental effects on galaxy evolution (Duplancic et al. 2018, 2021).
The are a few catalogues of galaxy triplets in the bibliography, the most studied of which were those compiled by Karachentseva et al. (1979), who studied K-triplets; Trofimov & Chernin (1995), who studied wide triplets (hereafter W-triplets); and O’Mill et al. (2012), who studied O-triplets. Also important is the SDSS catalogue of Isolated Triplets (the SIT catalogue) compiled by Argudo-Fernández et al. (2015). Using the K-triplets, W-triplets, and O-triplets, Duplancic et al. (2013) found that galaxies in triplets have similar properties (star formation rate, colours, and stellar population) to galaxies in compact groups. In particular, Duplancic et al. (2015) suggest that the formation of elliptical galaxies through mergers in galaxy triplets could be favoured by the configuration and dynamics of long-term evolved systems. In general, galaxy triplets with similar photometric properties reside and evolve in a common dark matter halo. In addition, Tawfeek et al. (2019) found that the dynamics of isolated triplets is slightly different to that in K-triplets. Therefore, it is still not well understood how the dynamics of these systems affects the evolution of the galaxies since it might be influenced by the large-scale environment.
Galaxy triplets can be found both within larger structures, as large groups and clusters, and in the field. Mendel et al. (2011) found that about half of CGs are embedded substructures of rich groups or clusters, while the other half are isolated structures or associated with comparably poor groups. Therefore, in order to better understand the evolution of the galaxies in triplets, it would be appropriate to consider isolated triplets (i.e., systems without close neighbours that might appreciably exert any influence during a past crossing time tcc ≈ 3 Gyr) to minimise the possible effects of neighbour galaxies in their large-scale environment. In this context, Argudo-Fernández et al. (2015) claimed that there is no difference in the degree of interactions with the large-scale environment for isolated galaxies, isolated pairs, and the galaxies found in the SIT, which suggests that they may have a common origin in their formation and evolution. Therefore, any difference in their observed properties is due to the influence of their local environment and the dynamics of the systems.
In this work we perform a statistical study of the dynamical properties of isolated galaxy triplets in the SIT as a function of their local environment. To explore the connection of the dynamical evolution of the systems with the evolution of the galaxies composing the triplets, we consider observational properties such as morphology and star formation rate (SFR). This work is organised as follows. In Sect. 2 we describe the SIT and how we classify the systems according to morphology and SFR. We also present the parameters we use to quantify the dynamical stage of the triplets, and to quantify both the local and large-scale structure (LSS) environment, as well as a new defined parameter to quantify the total local tidal strength of the triplet system. In Sect. 3 we present our results in terms of environments, dynamics, and their interconnections with galaxy properties; in Sect. 4 we present the corresponding discussion. Finally, we present a summary of the work and our conclusions in Sect. 5. Throughout the study a cosmology with ΩΛ0 = 0.7, Ωm0 = 0.3, and H0 = 70 km s−1 Mpc−1 is assumed.
2. Data and methodology
2.1. The SIT
As introduced in the previous section, for our study we used the SIT sample of isolated galaxy triplets (Argudo-Fernández et al. 2015). The sample is based on photometric and spectroscopic data from the Tenth public Data Release of the Sloan Digital Sky Survey (SDSS-DR10; Ahn et al. 2014), for galaxies with r-band model magnitudes within 14.5 ≤ mr ≤ 17.7 and redshift 0.005 ≤ z ≤ 0.080 (see lower panel of Fig. 1).
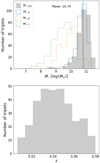 |
Fig. 1. Properties of the galaxies in the SIT. Upper panel: distribution of stellar masses of the A (M⋆, A), B (M⋆, B), and C galaxies (M⋆, C), in different colours and line styles (see legend) with respect to the total stellar mass of the isolated triplet (M⋆, trip = M⋆, A + M⋆, B + M⋆, C; in grey). The vertical black dashed line indicates the mean value of the M⋆, trip = 10.79 log(M⊙). Lower panel: redshift distribution of the SIT. |
The galaxies in the SIT are classified from the brightest to the faintest, denoted A, B, and C, respectively. Under this definition, the A galaxy is expected to be the most massive galaxy in the triplet (as shown in the upper panel of Fig. 1). SIT triplets usually show a hierarchical structure, as shown in Fig. 1, where the mass of the B galaxy is typically one-tenth of the mass of the A galaxy, and the mass ratio of the A to C galaxies is about 1/100.
The triplets in the SIT are selected under a restricted isolation criterion, where the system has no neighbours up to a projected physical distance of 1 Mpc within a line-of-sight velocity difference Δ v ≤ 500 km s−1. The B and C galaxies satisfy Δ v ≤ 160 km s−1 within a projected distance d ≤ 450 kpc from the A galaxy. The SIT on Argudo-Fernández et al. (2015) is composed of 315 isolated triplets, corresponding to 3% of the local Universe (z ≤ 0.080 Argudo-Fernández et al. 2015).
2.2. Morphology
Since the SIT is based on SDSS data, we use the morphology classification from Domínguez Sánchez et al. (2018), which provides deep learning-based morphological classification for ∼670 000 galaxies from the SDSS DR7 (Abazajian et al. 2009). The deep learning models used in Domínguez Sánchez et al. (2018) were trained and tested using visual morphological classification from the Galaxy Zoo project,1 in particular from the Galaxy Zoo 2 (GZ2, Willett et al. 2013) catalogue and the morphological classification by Nair & Abraham (2010). Domínguez Sánchez et al. (2018) provides a T type classification that ranges from −3 to 10, where T type ≤ 0 corresponds to early-type galaxies (i.e., elliptical and lenticular galaxies), and positive values to late-type galaxies, with T type = 10 for irregular galaxies.
We find that all galaxies in the SIT have morphology classifications in Domínguez Sánchez et al. (2018). For the purpose of this work, we only consider if the galaxies are classified as late-type (including irregulars) or early-type (considering ellipticals and lenticulars). We find 359 galaxies classified as early-type (38%), and 586 as late-type (62%). We therefore classified triplets in the SIT in four categories according to the morphology of the galaxies as follows:
– TL: triplets with three late-type galaxies, 65 triplets (20.6% of triplets in the SIT);
– TE: triplets with three early-type galaxies, 28 triplets (8.9% of triplets in the SIT);
– TCL: triplets with the central galaxy a late-type, 70 triplets (22.2% of triplets in the SIT).
– TCE: triplets with the central galaxy an early-type, 148 triplets (47.0% of triplets in the SIT).
The TCL and TCE categories are based on the morphology of the A galaxy when the three galaxies do not have the same morphology. An example of SIT triplets classified in each morphology category is shown in Fig. 2.
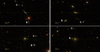 |
Fig. 2. SDSS-DR17 three-colour images of four selected SIT systems (SIT 86, SIT 222, SIT 217, and SIT 17 from upper left to lower right). This is an example of the morphological category classification: a) the system is composed of three spiral galaxies (TL, upper left panel); b) the system is composed of three elliptical galaxies (TE, upper right panel); c) the A galaxy is a spiral galaxy (TCL, lower left panel); and d) the A galaxy is an elliptical galaxy (TCE, lower right panel). North is up and east is left. The image scale is 0.215″ pixel−1, and the centre of the image represents the A galaxy. |
2.3. Star formation rate
For the purpose of this work, we use the GALEX-SDSS-WISE Legacy Catalog (GSWLC, Salim et al. 2016), which contains the physical properties, such as the star formation rate (SFR), of ∼700 000 galaxies with SDSS redshift below 0.30 (0.01 < z < 0.30) and magnitude mr < 18 mag. The GSWLC contains galaxies within the Galaxy Evolution Explorer (GALEX) satellite All Sky Survey (Martin et al. 2005) footprint, regardless of a detection, altogether covering 90% of the SDSS footprint. However, there are three versions of the catalogue (GSWLC-A, M, D), depending on the depth of the ultraviolet (UV) photometry.
Salim et al. (2016) used multiwavelength observations from the UV to the infrared (IR) to construct the spectral energy distribution (SED) and derive the physical properties (SFRs, stellar masses, and dust attenuation) with the CIGALE code (Burgarella et al. 2005; Noll et al. 2009; Boquien et al. 2019), using state-of-the-art UV–optical SED fitting techniques. In particular, we used the second version of the catalogue, GSWLC-2 (Salim et al. 2018), where the mid-infrared flux from 22 micron observations (or 12 micron if 22 micron is not detected) with the Wide-field Infrared Survey Explorer (WISE, Wright et al. 2010) are used in the SED fitting jointly with UV–optical photometry to derive more accurate SFRs. We used the medium-deep catalogue, GSWLC-M2, which covers 49% of SDSS dataset. The numbers of SIT triplets with SFR information for the three galaxies in each morphological category are 38 TL triplets (58.5% of SIT triplets classified as TL); 13 TE triplets (46.4% of SIT triplets classified as TE); 33 TCL triplets (47.1% of SIT triplets classified as TCL); and 58 TCE triplets (39.2% of SIT triplets classified as TCE).
2.4. Quantification of the environment
Argudo-Fernández et al. (2015) quantified the LSS environment and the level of interaction between the galaxies in the system, based on two complementary parameters: the projected number density (ηk, LSS), and tidal strength (Q) local and on LSS.
Projected number density is the density of neighbouring galaxies around the A galaxy defined by the distance to the fifth nearest neighbour (Verley et al. 2007)

with  , where dk is the projected distance to the kth nearest neighbour, with k ≤ 5 depending on the neighbours in the field out to a projected distance of 5 Mpc.
Tidal strength QA is an estimation of the sum of all the gravitational tidal force with respect to the central galaxy (Verley et al. 2007; Sabater et al. 2013; Argudo-Fernández et al. 2015)
![$$ \begin{aligned} Q_A \propto \log \left[\sum _{i}\frac{M_{\star i}}{M_{\star A}}\left(\frac{D_{A}}{d_{i}}\right)^{3}\right], \end{aligned} $$](/articles/aa/full_html/2023/02/aa45297-22/aa45297-22-eq3.gif)
where M⋆A and DA are the stellar mass and the diameter of the A galaxy, respectively, M⋆i is the stellar mass of the ith neighbour galaxy, and di is its projected distance to the A galaxy.
2.5. Dynamical parameters
We used the following parameters to quantify the dynamic configuration of the triplets in the SIT, as defined in Hickson (1982) and Hickson et al. (1992), which provide an estimation of the evolution stage on the systems.
Harmonic radius (RH) is the parameter that represents a measurement of the effective radius of a galaxy group or cluster

where Rij are the projected galaxy-galaxy separations (in Mpc).
Velocity dispersion ( ) corresponds to the dispersion of the radial velocities of the galaxies in the triplet

with vr ∝ cz.
Crossing time (H0tc) is a measure of the time that takes a single galaxy to go across the system. We expressed the crossing time with respect to other dynamical parameters such as harmonic radius and the velocity dispersion. This expression is normalised by cosmological terms:

Virial mass (Mvir) is the mass estimation of a gravitationally bound system of triplets; it is related to the radius of the system and the velocity dispersion, and a factor to account for the number of galaxies in the system. This estimator represents an approximation of the halo mass and baryonic mass:

The results of the quantification of the dynamical parameters for the SIT is presented in Sect. 3.2.
3. Results
3.1. Environment of galaxy triplets
The tidal strength parameter Q (Eq. (2)) provided by Argudo-Fernández et al. (2015) estimates the total tidal strengths exerted on the A galaxy in the SIT triplets. To quantify the tidal strength due to the LSS environment, QA, LSS considers all neighbour galaxies within Δ v ≤ 500 km s−1 and up to a projected distance of 5 Mpc (without considering the companion galaxies in the triplet). Figure 3 shows the diagram ηk, LSS vs. QA, LSS, similar to the lower right panel of Fig. 3 in Argudo-Fernández et al. (2015), but for SIT triplets only, colour-coded according to the morphological classification of the triplet. We note that these parameters do not take into account the influence of the B and C galaxies; therefore, they quantify the large-scale environment of the system. SIT triplets with lower values of both parameters are more isolated from the LSS environment. In general, we do not find a relation with the morphology of the triplets. However, as shown in the distribution of the QLSS in Fig. 3, TCE triplets for a fixed ηk present lower average QLSS values and larger scatter than the other categories.
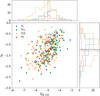 |
Fig. 3. Quantification of the LSS environment for the SIT. The morphological category for each triplet is depicted with different colours and symbols. Blue pentagons correspond to triplets where the three galaxies are spirals (TL), green crosses to triplets where the A galaxy is spiral (TCL), orange stars to triplets where the A galaxy is elliptical (TCE); and red triangles to triplets where the three galaxies on are ellipticals (TE), as indicated in the legend. The distribution and their mean values of the parameters QA, LSS and ηk, LSS for each morphological category is shown in the upper and right panel, respectively, following the same colour-coding. |
On the other hand, QA, trip is the local tidal strength considering the influence of the B and C galaxies on the A galaxy. Using this definition, Argudo-Fernández et al. (2015) were able to compare the tidal parameters on central galaxy among isolated galaxies, isolated pairs, and isolated triplets; however it does not necessarily account for the total local tidal strengths in the triplet (i.e., considering the tidal strengths on each galaxy of the triplet). In this regard, we defined a new parameter, Qtrip, which considers the total local tidal strengths as the mean of the local tidal strengths of each galaxy in the triplets:

Here QB, trip is the local tidal strength considering the influence of the A and C galaxies on the B galaxy, and QC, trip considering the influence of A and B galaxies on the C galaxy. The values of the estimation of the Qtrip parameter for each SIT triplet can be found in Table 1. The comparison of the new defined Qtrip parameter with respect to the classic QA, trip is shown in Fig. 4. We note that there is no need to define a new QA, LSS since the closest LSS associations are located at projected distances d ≥ 1 Mpc from the triplets, and therefore an average QLSS would provide the same values at a significant level.
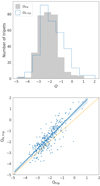 |
Fig. 4. Comparison of the new total local tidal strength parameter Qtrip with respect to the classic QA, trip parameter in Argudo-Fernández et al. (2015) for SIT isolated triplets. Upper panel: distribution of the Qtrip parameter (filled grey histogram) in comparison to the distribution of the QA, trip parameter (blue line histogram). Lower panel: scatter plot of the Qtrip parameter with respect to the QA, trip parameter (blue circles). The orange dashed line represents the y = x relation, the blue line represents the data linear regression, and the shaded light blue area indicates its corresponding error. |
Dynamical parameters, tidal strength, and morphology for SIT triplets.
3.2. Dynamics of galaxy triplets
We estimated the dynamical parameters of harmonic radius (RH), velocity dispersion (σvr), crossing time (H0tc), and virial mass (Mvir) for the SIT, as defined in Sect. 2.5. The values of the parameters for each SIT triplet can be found in Table 1.
The violin-box plots in Fig. 5 provide a global view of the quantification of the dynamical parameters as a function of the morphology of the SIT isolated triplets. In addition, the median values of the parameters for each morphological category, as defined in Sect. 2.2, are shown in Table 2. For comparison, the median value of the dynamical parameters for the SIT are RH = 157.59 kpc, σvr = 53.90 km s−1, H0tc = 0.38, and log(Mvir) = 12.13 M⊙, within an interquartile range RH = 131.60 kpc, σvr = 36.12 km s−1, H0tc = 0.43, and log(Mvir) = 0.73 M⊙.
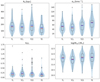 |
Fig. 5. Box plots of the dynamical parameters for the SIT, from upper left to lower right: harmonic radius (RH), velocity dispersion (σvr), crossing time (H0tc), and virial mass (Mvir). According to the dynamical parameters, the light blue shape represents the density diagram (violin plot), which shows for each dynamical parameter the form of the data distribution. The inner box on the violin plot is a representation of interquartile range of the median (red horizontal line) and its 95% of confidence intervals. We also show the mean values (blue horizontal line) and the outliers points of the distributions as black open circles, which represent the atypical points of the samples. |
Median values (Table A) and uncertainties (given by the interquartile range, Table B) of the dynamical parameters of the SIT, for each morphological type.
We found that TE triplets have the smallest RH value (153.22 kpc), as expected according to Hickson (1982), which indicates that isolated triplets composed of three elliptical galaxies are in general more compact than triplets with one or more spiral galaxies. We also found that TL and TCL triplets in general present lower values of the velocity dispersion than TCE and TE triplets. We discuss our results in more detail in Sect. 4.2.
3.3. Dynamics and environment as a function of galaxy morphology
The dynamical parameters provide a quantification of the evolutionary stage of the triplets, based on the configuration of the systems in terms of relative apparent positions and velocities between the member galaxies. Moreover, the environmental parameters quantify the local and LSS environments of the systems. We can therefore explore if there is any relation between the configuration of the SIT triplets and their environments. Since the evolutionary processes of the galaxies in the system leave an imprint in the morphology of its members, we also explore these relations as a function of the morphology of the triplets, based on the four categories defined in Sect. 2.2. We did not find any relation between the dynamical parameters (RH, σvr, H0tc, and Mvir) and the environment parameters project number density (ηk, LSS), tidal strength of LSS (QLSS), or even distance to nearest neighbour dnn. We also did not find a correlation between σvr and Mvir with the Qtrip (or QA, trip). To avoid distraction we do not show the corresponding scatter plots.
However, we did observe a trend for RH and H0tc with respect to the local tidal strength Qtrip, as well as with the QA, trip parameter. We show this relation in the two panels of Fig. 6. In general, RH decreases with increasing values of the local tidal strength; however, systems with the lowest RH spawn a wide range of tidal strength values. This relation is even more present when considering the H0tc versus the tidal strength, where larger values of the H0tc are only present in systems with weaker tidal strength. We also found a relation with the morphology of the triplet. We discuss these results in Sect. 4.3.
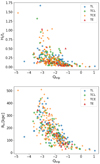 |
Fig. 6. Dependence of the dynamical parameters H0tc and RH with respect to the local environment. The morphology for each triplet is represented as in Fig. 3. Upper panel: adimensional crossing time dynamic parameter H0tc with respect to the total local tidal strength Qtrip. Lower panel: harmonic radius RH dynamic parameter, in kpc, with respect to the total local tidal strength Qtrip. |
3.4. SFR and mass as a function of galaxy morphology
Another method for exploring the evolution of galaxies is through their SFR. To complement the information we can obtain for the SIT systems regarding their dynamical configuration, we used the SFR–stellar mass (M⋆) diagram, which provides information of the evolutionary stage of a system in terms of its global star formation.
As mentioned in Sect. 2.3, we have SFR information for a subsample of SIT triples, based on the GSWLC-M2 catalogue (38 TL triplets, 13 TE triplets, 33 TCL triplets, and 58 TCE triplets). For those triplets we followed the work of Duplancic et al. (2013) to compute the global SFR–M⋆ diagram for galaxy triplets in the SDSS. We therefore compute the mean stellar mass content (defined as M⋆, trip = (M⋆, A + M⋆, B + M⋆, C)×3−1) and the mean star formation activity (defined as SFRtrip = (SFRA + SFRB + SFRC)×3−1). The global SFR–M⋆ diagram for SIT triplets is shown in Fig. 7. For comparison, the SFR–M⋆ diagram for SIT galaxies with respect to galaxies in the GSWLC-M2 catalogue is shown in Fig. 8. We found a stratified relation depending on the morphology of the triplets, where TL triplets show the highest global SFR at a given stellar mass, as expected, followed by TCL and TCE triplets, respectively, with TE triples showing the lowest values of the global SFR at a given stellar mass. We discuss these results further in Sect. 4.4.
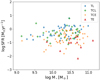 |
Fig. 7. Global SFR–M⋆ diagram for SIT triplets. The points correspond to galaxy triplets, where the morphology for each system is represented as in Fig. 3. Star formation rate (SFR) units are in solar masses per year (M⊙ yr−1) and stellar mass (M⋆) in solar masses (M⊙). Five galaxies with very low SFRs are not shown. |
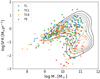 |
Fig. 8. SFR–M⋆ diagram for SIT galaxies. Symbol colour and style indicate the morphology of the triplet where the galaxy corresponds, as in Fig. 3. The black contours correspond to galaxies in the GSWLC-M2 catalogue (Salim et al. 2018). Star formation rate (SFR) units are in solar masses per year (M⊙ yr−1) and stellar mass (M⋆) in solar masses (M⊙). Five points with very low SFRs are not shown. |
4. Discussion
4.1. Environment of galaxy triplets
The introduction of the new parameter Qtrip provides more complete information of the tidal strengths within the system. It considers not only the local tidal strengths exerted on the A galaxy (QA, trip), as defined in Argudo-Fernández et al. (2015), but also the local tidal strengths exerted on the B (QB, trip) and the C (QC, trip) galaxies, as defined in Eq. (7). This definition allows us to interpret any correlation of the dynamical parameters of the triplets with the local environment.
According to Fig. 4, in general, there is a good agreement with the classic QA, trip parameter (correlation coefficient: 0.71). However, at higher tidal strengths the QA, trip values are higher than the Qtrip (as shown in the lower panel of Fig. 4). This difference is mainly due to closer projected distances of the B and/or C galaxies to the A galaxy, which affect more strongly the increase in value of the QA, trip parameter than higher stellar mass ratio, as defined in Eq. (2). This effect is smoothed when considering Qtrip. In addition, the distribution of Qtrip is narrower (σQtrip = 0.83) than QA, trip (σQA, trip = 1.10), reducing the number of outliers (as shown in the upper panel of Fig. 4).
We observed that there is no dependence of the Qtrip on the morphology of the triplet; however, we note that triplets with higher Qtrip present signs of interaction that can be detected in the optical images from a visual inspection. Relaxed triplets, without strong interactions between their member galaxies, present lower values of Qtrip, with higher values when stronger and visible interactions are happening in the system, as can be seen for instance in SIT 190 (see the right lower panel of Fig. 9). This relation is not very clear when using QA, trip alone. We therefore conclude, even if QA, trip provides a valuable general quantification of the local environment of the triplets, that the Qtrip parameter, considering the total local tidal strengths for each galaxy in the system, allows a more appropriate exploration of the effects environment on physical properties of the systems.
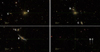 |
Fig. 9. SDSS-DR17 three-colour images of three selected SIT triplets as an example of systems with interacting galaxies (image scale 0.215″ pixel−1), and one selected triplet as an example of a relaxed galaxy triplet (image scale 1.067″ pixel−1). Upper left panel: SIT 133 (TCE triplet). Upper right panel: SIT 263 (TCE triplet). Lower left panel: SIT 45 (TL triplet). Lower right panel: SIT 190 (TE triplet), a relaxed isolated triplet with Qtrip = −2.72 and H0tc = 0.16. Since the scale is larger to cover the full triplet, a line has been added for an easier identification of the B and C galaxies and to avoid confusion with background and foreground galaxies. |
In general, we also do not find a relation on the LSS environment with the morphology of the galaxies in the triplets. However, as shown in the distribution of the QLSS in Fig. 3, TCE triplets present lower values of this parameter while presenting comparable values of the ηk, LSS. This might indicate that TCE triplets are surrounded by low mass neighbour galaxies in their LSS environment.
4.2. Dynamics of galaxy triplets
We investigated whether there is any connection between the morphology of the galaxies in isolated galaxy triplets and the dynamical evolution of the systems. According to Hickson (1982), compact groups mainly composed of elliptical galaxies are more compact, with lower values of harmonic radius (RH) than in compact groups with more diverse morphologies, and have lower values of crossing time (H0tc). Our results are in agreement with Hickson (1982) in the sense that TE triplets have the smallest RH values, indicating that isolated triplets composed of three elliptical galaxies are in general more compact than triplets with one or more spiral galaxies. TE triplets correspond to about 9% of the sample. For comparison, Tawfeek et al. (2019) found that only 3% of the isolated triplets can be considered compact systems; however, they do not distinguish between galaxy morphologies, and their criterion for selecting compact system is much more restrictive. For the H0tc parameter, the median value for TE triplets is not very different to the values for the other morphological categories; however, the interquartile range points towards lower values of H0tc, as shown in the lower left panel of Fig. 5.
We found that isolated triplets with a central elliptical galaxy (TCE triplets), which are predominant in the SIT (47.0%), show higher median values of RH, σvr, and Mvir than any other morphological category (see Table 2). This might be due to the fact that elliptical central galaxies are usually more massive than central spirals, and therefore physically bound satellite galaxies can be found at larger projected distances or higher velocity dispersions, as expected by their escape velocity (Argudo-Fernández et al. 2014). Neighbour galaxies with higher velocity may evade the gravitational attraction of the A galaxy and not be captured within the system. We note that we do not observe this trend in TE triplets because galaxies inside these systems might have been evolving cooperatively for a longer time, supported by the previous findings. Our results suggest that triplets composed of three early-type galaxies might be already relaxed systems with dynamical properties slightly different than in triplets presenting late-type galaxies.
Considering the previous findings for TCE triplets with respect to their LSS environment, we propose the scenario where TCE isolated triplets are primarily formed when an early-type galaxy is located in an environment mainly composed of low mass neighbour galaxies. These neighbours might be physically bound with the early-type galaxy when they are captured by its gravitational potential.
4.3. Dynamics and environment as a function of galaxy morphology
In general, we did not find any dependence of the dynamical parameters on the LSS environment, in agreement with Tawfeek et al. (2019). We also did not find any clear relation between the local environment and the velocity dispersion or the virial mass of the triplet. This result is interesting since by definition Qtrip strongly depends on the stellar mass. However, we found a dependence of Qtrip on RH, and by consequence on H0tc (see the upper and lower panels in Fig. 6). Isolated triplets with higher values of RH and H0tc usually have Qtrip < −2; therefore, the tidal strength by the triplet members is not strong. This indicates that less compact and younger triplets (i.e., evolved over a shorter time) present a low level of local interaction between its members, independently of the morphology of the galaxies.
On the other hand, the triplets with higher Qtrip show lower values of RH and H0tc; however, we note that not all triplets with low RH and H0tc have a high Qtrip. This result suggests that there are several possible configurations for isolated triplets among those with lowest RH and H0tc (i.e., the most compact and evolved triplets) according to Hickson et al. (1992), who classified compact groups in strongly interacting systems and less interacting systems.
We found that TE triplets generally present low values of RH and H0tc, which indicates that they are compact and long time evolved systems, in agreement with Hickson et al. (1992). However, we also found a wider range of morphologies among the systems with low values of RH and H0tc. Some TL, TCL, and TCE triplets also present low values of RH and H0tc for all values of Qtrip as shown in Fig. 6. In addition, as mentioned in Sect. 4.1, galaxies in isolated triplets with higher Qtrip values present signs of interaction, such as mergers or tidal tails, that are appreciable in their optical SDSS images. Hence these are not relaxed systems, even when presenting low H0tc values.
We therefore propose using the Qtrip parameter to provide an empirical limit value to help us to identify systems with ongoing interactions between their member galaxies. To do so, we performed a visual inspection of the 315 SIT triplets and classified the systems in three categories according to the observed level of interaction of their member galaxies. We classify them as ‘low interaction’ when, without being significantly close to its companion galaxy, there are visible interactions in the galaxy, such as tidal bridges and deformations, which could be due to past interactions in the system, or when there are close pairs with minimal interaction (41 isolated triplets); as ‘mid interaction’ in the presence of tidal tails and ongoing mergers (19 isolated triplets); and as ‘strong interaction’ when the galaxies are close to the last merging stage of core fusion (9 isolated triplets). We refer to these systems as low, mid, and strong, respectively, in Fig. 10. As shown in this figure, for values of Qtrip > −2 and H0tc < 1 we start to observe interactions in some of the systems, mainly low and mid interactions, while SIT triplets with Qtrip > −0.45 present ongoing mergers (mid interactions) or strong interactions.
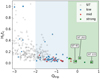 |
Fig. 10. Crossing time vs tidal strength, zoomed in on the area from Qtrip > −3 for better visualisation. Symbol style indicates the morphology of the triplet where the galaxy corresponds, as in Fig. 3. Grey dots represent the full sample of triplets, while blue dots represent galaxies showing signs of interaction, green dots represent galaxies showing slight signs of interaction, and red dots represent galaxies with strong signs of interaction. The blue shaded area represents systems that may have a level of interaction of all types from −2 < Qtrip < −0.45, while the green area represents mergers or ongoing merger types from Qtrip > −0.45. Three example cases are indicated (black squares): SIT 263, SIT 45, SIT 133. |
We found that, in general, interactions in galaxy triplets occur between two member galaxies, primarily between the A galaxy and another galaxy. An example of an isolated triplet in each category is presented in Fig. 9. There is only one isolated triplet where the three galaxies are interacting, SIT 45. In a separate work, we consider two scenarios for the present configuration of the triplet, one where the A galaxy in this triplet is a tidal galaxy formed from a previous interaction between the B and C galaxies, and another where the A galaxy arrives to the system after the interaction (Grajales-Medina et al. 2023).
We propose using the Qtrip parameter to classify the dynamical state of isolated triplets with low values of RH (i.e., the most compact) and H0tc since not all these triplets would be long time evolved or relaxed systems. SIT triplets with Qtrip < −2 are relaxed systems, more dynamically evolved, while triplets with Qtrip > −2 show compact configurations due to interactions happening in the systems, such as ongoing mergers. This empirical value is in agreement with numerical simulations. According to previous works, the evolution of a galaxy may be affected by external influence when the corresponding tidal force amounts to 1% of the internal binding force (Athanassoula 1984; Byrd & Howard 1992). This theoretical value corresponds to a tidal strength of Q = −2, which allows us to separate the interactions that might affect the evolution of isolated galaxies (Verley et al. 2007; Argudo-Fernández et al. 2013). We note that this empirical value is limited to the magnitude limit of SDSS optical images, where the 95% completeness limits for each band are (u, g, r, i, z) = (22.15, 22.2, 22.2, 21.3, 20.5), respectively (York et al. 2000; Gunn et al. 2006).
4.4. SFR and mass as a function of galaxy morphology
The SFR–M⋆ diagram for SIT galaxies in Fig. 8 shows that most of the galaxies are star-forming galaxies located along the main sequence. A small number are quiescent galaxies (low SFR–M⋆), most of them early-type (since they belong to TE triplets), and galaxies in the green valley below the main sequence. In general, most of the late-type galaxies belonging to TL triplets are star-forming galaxies, but we also find four galaxies in the green valley. Similarly, about a dozen early-type galaxies in TE triplets are located in the green valley and the main sequence. This result is expected since Paspaliaris et al. (2023) found that 47% of early-type galaxies in their sample present ongoing star formation, with SFRs comparable to star-forming late-type galaxies. They also found that, in general, star-forming galaxies are mainly found in low-density environments; therefore, it is expected to find star-forming early-type galaxies in isolated triplets.
As mentioned in Sect. 3.4, we followed the work developed by Duplancic et al. (2013) to derive the global SFR–M⋆ diagram for SIT triplets presented in Fig. 7. The upper panel of Fig. 6 in Duplancic et al. (2013) shows a stratified relation where blue triplets show the highest global SFR at a given stellar mass, while red triplets show the lowest values of the global SFR at a given stellar mass. We confirmed that this stratification also exists when considering the morphology of the triplets. TL triplets show the highest global SFR at a given stellar mass, followed by TCL and TCE triplets, respectively, with TE triples showing the lowest values. We checked that this stratification disappears when considering only the SFR and M⋆ for the A galaxy in the triplet. This might indicate that the physical properties of galaxy triplets, such as colour or SFR, do not depend on the properties of the central galaxy, but on the global properties considering the three galaxies in the system. Therefore, there would be no dominant galaxy in triplets in terms of properties of stellar populations such as colour and SFR. In this sense, it would be interesting to investigate if similar results are found when considering other properties, for instance nuclear activity.
Since the C and B galaxies are usually less massive than the A galaxy (Argudo-Fernández et al. 2015), we further explored the observed stratification relation of global SFR with morphology of the triplet in terms of the stellar mass ratio of the B and C galaxies with respect to the A galaxy. As shown in Fig. 11, this stratification is still present. Moreover, we find that the global SFR in TE triplets increases with mass ratio. To better understand this trend, new more refined morphological subcategories were defined for TCL and TCE triplets, taking into account the number of galaxies with a certain morphology. If TCL and TCE triplets have two late-type galaxies and one early-type galaxy, an ‘l’ was added to the name; if the triplets contain two early-type galaxies and one early-type galaxy, an ‘e’ was added, resulting in the following categories:
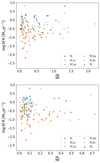 |
Fig. 11. Global SFR for SIT triplet vs. stellar mass ratio. Upper panel: global SFR vs. mass ratio of the B galaxy with respect to the A galaxy (M⋆, B/M⋆, A). Lower panel: global SFR vs. mass ratio of the C galaxy with respect to the A galaxy (M⋆, C/M⋆, A). The morphological categories represented in the legend are as follows: blue diamonds correspond to triplets with three late-type galaxies (TL), green unfilled stars to triplets with two late-type galaxies (with the central late-type galaxy) and one early-type (TCLl), green stars to triplets with the central late-type galaxy and two early-type galaxies (TCLe), unfilled orange crosses to triplets with two late-type galaxies and the central early-type (TCEl), orange diamonds to triplets with two early-type galaxies (with the central early-type galaxy) and one late-type (TCEe), and red triangles to triplets with three elliptical galaxies (TE). |
– TL: Triplets with three late-type galaxies (38 triplets);
– TCLe: Triplets with the central galaxy as late-type, while their companions are a late-type and early-type galaxies (5 triplets);
– TCLl: Triplets with the central galaxy as late-type, while their companions are both late-type galaxies (28 triplets);
– TCEe: Triplets with the central galaxy as early-type, while their companions are a late-type and early-type galaxies (20 triplets);
– TCEl: Triplets with the central galaxy as early-type, while their companions are both late-type galaxies (38 triplets);
– TE: Triplets with three early-type galaxies (13 triplets).
We found that this trend is also observed in TCEe triplets. The more similar the stellar mass of the B and C galaxy with respect to the stellar mass of the A galaxy, the higher the global SFR in TE and TCEe isolated triplets. For the rest of the morphological categories we do not observe any relation.
Thomas et al. (2010) suggests that elliptical galaxies in low density environments may be rejuvenated by eventually accreting cold gas. This rejuvenation phase might be mainly due to galaxy mergers and interactions, with a subsequent transition into a secular evolution phase (Kormendy & Kennicutt 2004). A number of the star-forming early-type galaxies in Paspaliaris et al. (2023) show signs of interactions.
Our results suggest that when isolated triplets are composed of two or more early-type galaxies, the global SFR of the system increases with the stellar mass ratio of the galaxies with respect to the central A galaxy, and therefore the system is globally ‘rejuvenated’. This might be triggered by the gas supply being accreted from the companion galaxy.
5. Summary and conclusions
We present a statistical study of the dynamical properties of isolated galaxy triplets as a function of their environment, exploring the connections of the dynamical evolution of the systems with respect to the evolution of the galaxies composing the triplets. We therefore consider observational properties such as morphology and star formation rate (SFR).
We used the SDSS-based catalogue of Isolated Triplets (SIT, Argudo-Fernández et al. 2015) which contains 315 isolated galaxy triplets. We classified each triplet according to galaxy morphologies using the classification performed by Domínguez Sánchez et al. (2018). SIT triplets were classified as TL when the three galaxies are late-type; TCL when only the central galaxy in triplets is a late-type galaxy; TCE when only the central galaxy is an early-type galaxy; and TE when the three galaxies composing the triplet are early-type galaxies.
To quantify the local and LSS environments we used the QA parameter defined in Argudo-Fernández et al. (2015), as explained in Sect. 2.4, and we defined a new Qtrip, which quantifies the total local tidal strength in the triplets, as presented in Sect. 3.1. To consider the dynamical stage of the system we used the parameters harmonic radius (RH), velocity dispersion (σvr), crossing time (H0tc), and virial mass (Mvir), as explained in Sect. 2.5.
In general, we did not find any dependence of the dynamical parameters on the LSS environment. We also did not find any clear relation between the local environment and the velocity dispersion or the virial mass of the triplet. However, we found a dependence of Qtrip on RH, and by consequence on H0tc. For a complete analysis, we investigated if star formation in the system is affected by its morphology, environment, and dynamical stage. We found a stratified relation depending of the morphology of the triplets, where TL triplets show the highest global SFR at a given stellar mass, followed by TCL and TCE triplets, with TE triples showing the lowest values of the global SFR at a given stellar mass.
We draw the following main conclusions:
-
The local tidal strength environment parameter on central galaxy QA, trip provides a valuable general quantification of the local environment of the triplets; however, the Qtrip parameter considering the total local tidal strengths for each galaxy in the system allows a more appropriate exploration of the effects environment on physical properties of the systems.
-
In general, we do not find a relation in the local and in the LSS environment with respect to the morphology of the triplets. However, we find that TCE triplets might be mainly surrounded by low mass neighbour galaxies in their LSS environment.
-
We find that TCE triplets show higher median values of RH, σvr, and Mvir than any other morphological category. This might be due to the fact that elliptical central galaxies are usually more massive than central spirals, and therefore physically bound satellite galaxies can be found at larger projected distances or higher velocity dispersion, as expected by their escape velocity.
-
TE triplets are in general more compact than triplets with one or more late-type galaxies. Their dynamical parameters also indicate that these are relaxed systems, where their galaxies might have been evolving cooperatively for a long time.
-
The LSS environment does not have an influence in the dynamical configuration of the isolated triplets. However, there is a dependence on the local environment. Less compact and younger triplets (i.e., less long time evolved) present a low level of interaction between its members, independently of the morphology of the galaxies.
-
We can use the Qtrip parameter to classify the dynamical state of isolated triplets with low values of RH and H0tc. SIT triplets with Qtrip < −2 are relaxed systems, more dynamically evolved, while triplets with Qtrip > −2 show compact configurations due to interactions happening in the systems, such as ongoing mergers.
-
There is a stratification in the global SFR of the triplets, which disappears when considering only the properties of the central galaxy. Therefore, there is no dominant galaxy in triplets in terms of properties of stellar populations such as colour and SFR.
-
We find that the global SFR in isolated triplets composed of two or more early-type galaxies increases with the stellar mass ratio of the galaxies with respect to the central A galaxy, and therefore the system is globally ‘rejuvenated’.
Considering our findings for TCE triplets with respect to their LSS environment and dynamical parameters, we propose the scenario where TCE isolated triplets are primarily formed when an early-type galaxy is located in an environment mainly composed of low mass neighbour galaxies. These neighbours might be physically bound with the early-type galaxy if they are captured by its gravitational potential. This would be the main formation mechanism in isolated triplets, since TCE triplets are the predominant morphology in the SIT (47%), with a percentage even larger than expected if galaxies are distributed randomly in terms of their morphology (38% early-type and 62% late-type).
Acknowledgments
We thank the anonymous referee for the constructive revision of this work. PVB and MAF acknowledge financial support by the DI-PUCV research project 039.481/2020. MAF also acknowledges support from FONDECYT iniciación project 11200107 and the Emergia program (EMERGIA20_38888) from Consejería de Transformación Económica, Industria, Conocimiento y Universidades and University of Granada. SV acknowledges support from project P20_00334 financed by the Junta de Andalucía and from FEDER/Junta de Andalucía-Consejería de Transformación Económica, Industria, Conocimiento y Universidades/Proyecto A-FQM-510-UGR20. SDP is grateful to the Fonds de Recherche du Québec – Nature et Technologies and acknowledges financial support from the Spanish Ministerio de Economía y Competitividad under grants AYA2016-79724-C4-4-P and PID2019-107408GB-C44, from Junta de Andalucía Excellence Project P18-FR-2664, and also acknowledges support from the State Agency for Research of the Spanish MCIU through the ‘Center of Excellence Severo Ochoa’ award for the Instituto de Astrofísica de Andalucía (SEV-2017-0709). This research made use of ASTROPY, a community-developed core PYTHON (http://www.python.org) package for Astronomy (Astropy Collaboration 2013); IPYTHON (Pérez & Granger 2007); MATPLOTLIB (Hunter 2007); NUMPY (Walt et al. 2011); SCIPY (Jones et al. 2001); and TOPCAT (Taylor 2005). This research made use of ASTRODENDRO, a Python package to compute dendrograms of Astronomical data (http://www.dendrograms.org/). This research has made use of the NASA/IPAC Extragalactic Database, operated by the Jet Propulsion Laboratory of the California Institute of Technology, un centract with the National Aeronautics and Space Administration. Funding for SDSS-III has been provided by the Alfred P. Sloan Foundation, the Participating Institutions, the National Science Foundation, and the U.S. Department of Energy Office of Science. The SDSS-III Web site is http://www.sdss3.org/. The SDSS-IV site is http://www.sdss.org. Based on observations made with the NASA Galaxy Evolution Explorer (GALEX). GALEX is operated for NASA by the California Institute of Technology under NASA contract NAS5-98034. This publication makes use of data products from the Wide-field Infrared Survey Explorer, which is a joint project of the University of California, Los Angeles, and the Jet Propulsion Laboratory/California Institute of Technology, funded by the National Aeronautics and Space Administration.
References
- Abazajian, K. N., Adelman-McCarthy, J. K., Agüeros, M. A., et al. 2009, ApJS, 182, 543 [Google Scholar]
- Ahn, C. P., Alexandroff, R., Allende Prieto, C., et al. 2014, ApJS, 211, 17 [NASA ADS] [CrossRef] [Google Scholar]
- Argudo-Fernández, M., Verley, S., Bergond, G., et al. 2013, A&A, 560, A9 [NASA ADS] [CrossRef] [EDP Sciences] [Google Scholar]
- Argudo-Fernández, M., Verley, S., Bergond, G., et al. 2014, A&A, 564, A94 [NASA ADS] [CrossRef] [EDP Sciences] [Google Scholar]
- Argudo-Fernández, M., Verley, S., Bergond, G., et al. 2015, A&A, 578, A110 [NASA ADS] [CrossRef] [EDP Sciences] [Google Scholar]
- Astropy Collaboration (Robitaille, T. P., et al.) 2013, A&A, 558, A33 [NASA ADS] [CrossRef] [EDP Sciences] [Google Scholar]
- Athanassoula, E. 1984, Phys. Rep., 114, 321 [Google Scholar]
- Balogh, M. L., Morris, S. L., Yee, H. K. C., Carlberg, R. G., & Ellingson, E. 1999, ApJ, 527, 54 [Google Scholar]
- Boquien, M., Burgarella, D., Roehlly, Y., et al. 2019, A&A, 622, A103 [NASA ADS] [CrossRef] [EDP Sciences] [Google Scholar]
- Burgarella, D., Buat, V., & Iglesias-Páramo, J. 2005, MNRAS, 360, 1413 [NASA ADS] [CrossRef] [Google Scholar]
- Byrd, G. G., & Howard, S. 1992, AJ, 103, 1089 [NASA ADS] [CrossRef] [Google Scholar]
- Chernin, A. D., Dolgachev, V. P., & Domozhilova, L. M. 2000, MNRAS, 319, 851 [Google Scholar]
- Costa-Duarte, M. V., O’Mill, A. L., Duplancic, F., Sodré, L., & Lambas, D. G. 2016, MNRAS, 459, 2539 [NASA ADS] [CrossRef] [Google Scholar]
- Domínguez Sánchez, H., Huertas-Company, M., Bernardi, M., Tuccillo, D., & Fischer, J. L. 2018, MNRAS, 476, 3661 [Google Scholar]
- Duplancic, F., O’Mill, A. L., Lambas, D. G., Sodré, L., & Alonso, S. 2013, MNRAS, 433, 3547 [NASA ADS] [CrossRef] [Google Scholar]
- Duplancic, F., Alonso, S., Lambas, D. G., & O’Mill, A. L. 2015, MNRAS, 447, 1399 [NASA ADS] [CrossRef] [Google Scholar]
- Duplancic, F., Coldwell, G. V., Alonso, S., & Lambas, D. G. 2018, MNRAS, 481, 2458 [NASA ADS] [CrossRef] [Google Scholar]
- Duplancic, F., Lambas, D. G., Alonso, S., & Coldwell, G. V. 2021, MNRAS, 504, 4389 [NASA ADS] [CrossRef] [Google Scholar]
- Elyiv, A., Melnyk, O., & Vavilova, I. 2009, MNRAS, 394, 1409 [NASA ADS] [CrossRef] [Google Scholar]
- Emel’yanov, N. V., Kovalev, M. Y., & Chernin, A. D. 2016, Astron. Rep., 60, 397 [CrossRef] [Google Scholar]
- Feng, S., Shao, Z.-Y., Shen, S.-Y., et al. 2016, RAA, 16, 72 [NASA ADS] [Google Scholar]
- Grajales-Medina, D., Argudo-Fernández, M., Vásquez-Bustos, P., et al. 2023, A&A, 669, A23 [NASA ADS] [CrossRef] [EDP Sciences] [Google Scholar]
- Gunn, J. E., Siegmund, W. A., Mannery, E. J., et al. 2006, AJ, 131, 2332 [NASA ADS] [CrossRef] [Google Scholar]
- Hernández-Toledo, H. M., Méndez-Hernández, H., Aceves, H., & Olguín, L. 2011, AJ, 141, 74 [CrossRef] [Google Scholar]
- Hickson, P. 1982, ApJ, 255, 382 [NASA ADS] [CrossRef] [Google Scholar]
- Hickson, P., Mendes de Oliveira, C., Huchra, J. P., & Palumbo, G. G. 1992, ApJ, 399, 353 [Google Scholar]
- Hunter, J. D. 2007, Comput. Sci. Eng., 9, 90 [NASA ADS] [CrossRef] [Google Scholar]
- Jones, E., Oliphant, T., Peterson, P., et al. 2001, SciPy: Open Source Scientific Tools for Python [Online; accessed 2016–01-15] [Google Scholar]
- Karachentseva, V. E., & Karachentseva, I. D. 2000, in IAU Colloq. 174: Small Galaxy Groups, eds. M. J. Valtonen, & C. Flynn, ASP Conf. Ser., 209, 11 [NASA ADS] [Google Scholar]
- Karachentseva, V. E., Karachentsev, I. D., & Shcherbanovsky, A. L. 1979, Astrofizicheskie Issledovaniia Izvestiya Spetsial’noj Astrofizicheskoj Observatorii, 11, 3 [Google Scholar]
- Kormendy, J., & Kennicutt, Robert C., Jr. 2004, ARA&A, 42, 603 [NASA ADS] [CrossRef] [Google Scholar]
- Lietzen, H., Tempel, E., Heinämäki, P., et al. 2012, A&A, 545, A104 [NASA ADS] [CrossRef] [EDP Sciences] [Google Scholar]
- Makarov, D. I., & Karachentsev, I. D. 2009, Astrophys. Bull., 64, 24 [NASA ADS] [CrossRef] [Google Scholar]
- Martin, D. C., Fanson, J., Schiminovich, D., et al. 2005, ApJ, 619, L1 [Google Scholar]
- McConnachie, A. W., Patton, D. R., Ellison, S. L., & Simard, L. 2009, MNRAS, 395, 255 [NASA ADS] [CrossRef] [Google Scholar]
- Mendel, J. T., Ellison, S. L., Simard, L., Patton, D. R., & McConnachie, A. W. 2011, MNRAS, 418, 1409 [NASA ADS] [CrossRef] [Google Scholar]
- Nair, P. B., & Abraham, R. G. 2010, ApJS, 186, 427 [Google Scholar]
- Noll, S., Burgarella, D., Giovannoli, E., et al. 2009, A&A, 507, 1793 [NASA ADS] [CrossRef] [EDP Sciences] [Google Scholar]
- O’Mill, A. L., Duplancic, F., García Lambas, D., Valotto, C., & Sodré, L. 2012, MNRAS, 421, 1897 [CrossRef] [Google Scholar]
- Paspaliaris, E. D., Xilouris, E. M., Nersesian, A., et al. 2023, A&A, 669, A11 [NASA ADS] [CrossRef] [EDP Sciences] [Google Scholar]
- Pérez, F., & Granger, B. E. 2007, Comput. Sci. Eng., 9, 21 [Google Scholar]
- Prandoni, I., Iovino, A., & MacGillivray, H. T. 1994, AJ, 107, 1235 [NASA ADS] [CrossRef] [Google Scholar]
- Ramella, M., Diaferio, A., Geller, M. J., & Huchra, J. P. 1994, AJ, 107, 1623 [NASA ADS] [CrossRef] [Google Scholar]
- Sabater, J., Best, P. N., & Argudo-Fernández, M. 2013, MNRAS, 430, 638 [Google Scholar]
- Salim, S., Lee, J. C., Janowiecki, S., et al. 2016, ApJS, 227, 2 [NASA ADS] [CrossRef] [Google Scholar]
- Salim, S., Boquien, M., & Lee, J. C. 2018, ApJ, 859, 11 [Google Scholar]
- Tawfeek, A. A., Ali, G. B., Takey, A., Awad, Z., & Hayman, Z. M. 2019, MNRAS, 482, 2627 [NASA ADS] [CrossRef] [Google Scholar]
- Taylor, M. B. 2005, in Astronomical Data Analysis Software and Systems XIV, eds. P. Shopbell, M. Britton, & R. Ebert, ASP Conf. Ser., 347, 29 [Google Scholar]
- Thomas, D., Maraston, C., Schawinski, K., Sarzi, M., & Silk, J. 2010, MNRAS, 404, 1775 [NASA ADS] [Google Scholar]
- Trofimov, A. V., & Chernin, A. D. 1995, AZh, 72, 308 [NASA ADS] [Google Scholar]
- Verley, S., Leon, S., Verdes-Montenegro, L., et al. 2007, A&A, 472, 121 [NASA ADS] [CrossRef] [EDP Sciences] [Google Scholar]
- Walt, S., Colbert, S. C., & Varoquaux, G. 2011, Comput. Sci. Eng., 13, 22 [NASA ADS] [CrossRef] [Google Scholar]
- Willett, K. W., Lintott, C. J., Bamford, S. P., et al. 2013, MNRAS, 435, 2835 [Google Scholar]
- Wright, E. L., Eisenhardt, P. R. M., Mainzer, A. K., et al. 2010, AJ, 140, 1868 [Google Scholar]
- York, D. G., Adelman, J., Anderson, J. E., Jr, et al. 2000, AJ, 120, 1579 [Google Scholar]
- Zheng, Y.-L., & Shen, S.-Y. 2020, ApJS, 246, 12 [NASA ADS] [CrossRef] [Google Scholar]
All Tables
Median values (Table A) and uncertainties (given by the interquartile range, Table B) of the dynamical parameters of the SIT, for each morphological type.
All Figures
|
Fig. 1. Properties of the galaxies in the SIT. Upper panel: distribution of stellar masses of the A (M⋆, A), B (M⋆, B), and C galaxies (M⋆, C), in different colours and line styles (see legend) with respect to the total stellar mass of the isolated triplet (M⋆, trip = M⋆, A + M⋆, B + M⋆, C; in grey). The vertical black dashed line indicates the mean value of the M⋆, trip = 10.79 log(M⊙). Lower panel: redshift distribution of the SIT. |
| In the text | |
|
Fig. 2. SDSS-DR17 three-colour images of four selected SIT systems (SIT 86, SIT 222, SIT 217, and SIT 17 from upper left to lower right). This is an example of the morphological category classification: a) the system is composed of three spiral galaxies (TL, upper left panel); b) the system is composed of three elliptical galaxies (TE, upper right panel); c) the A galaxy is a spiral galaxy (TCL, lower left panel); and d) the A galaxy is an elliptical galaxy (TCE, lower right panel). North is up and east is left. The image scale is 0.215″ pixel−1, and the centre of the image represents the A galaxy. |
| In the text | |
|
Fig. 3. Quantification of the LSS environment for the SIT. The morphological category for each triplet is depicted with different colours and symbols. Blue pentagons correspond to triplets where the three galaxies are spirals (TL), green crosses to triplets where the A galaxy is spiral (TCL), orange stars to triplets where the A galaxy is elliptical (TCE); and red triangles to triplets where the three galaxies on are ellipticals (TE), as indicated in the legend. The distribution and their mean values of the parameters QA, LSS and ηk, LSS for each morphological category is shown in the upper and right panel, respectively, following the same colour-coding. |
| In the text | |
|
Fig. 4. Comparison of the new total local tidal strength parameter Qtrip with respect to the classic QA, trip parameter in Argudo-Fernández et al. (2015) for SIT isolated triplets. Upper panel: distribution of the Qtrip parameter (filled grey histogram) in comparison to the distribution of the QA, trip parameter (blue line histogram). Lower panel: scatter plot of the Qtrip parameter with respect to the QA, trip parameter (blue circles). The orange dashed line represents the y = x relation, the blue line represents the data linear regression, and the shaded light blue area indicates its corresponding error. |
| In the text | |
|
Fig. 5. Box plots of the dynamical parameters for the SIT, from upper left to lower right: harmonic radius (RH), velocity dispersion (σvr), crossing time (H0tc), and virial mass (Mvir). According to the dynamical parameters, the light blue shape represents the density diagram (violin plot), which shows for each dynamical parameter the form of the data distribution. The inner box on the violin plot is a representation of interquartile range of the median (red horizontal line) and its 95% of confidence intervals. We also show the mean values (blue horizontal line) and the outliers points of the distributions as black open circles, which represent the atypical points of the samples. |
| In the text | |
|
Fig. 6. Dependence of the dynamical parameters H0tc and RH with respect to the local environment. The morphology for each triplet is represented as in Fig. 3. Upper panel: adimensional crossing time dynamic parameter H0tc with respect to the total local tidal strength Qtrip. Lower panel: harmonic radius RH dynamic parameter, in kpc, with respect to the total local tidal strength Qtrip. |
| In the text | |
|
Fig. 7. Global SFR–M⋆ diagram for SIT triplets. The points correspond to galaxy triplets, where the morphology for each system is represented as in Fig. 3. Star formation rate (SFR) units are in solar masses per year (M⊙ yr−1) and stellar mass (M⋆) in solar masses (M⊙). Five galaxies with very low SFRs are not shown. |
| In the text | |
|
Fig. 8. SFR–M⋆ diagram for SIT galaxies. Symbol colour and style indicate the morphology of the triplet where the galaxy corresponds, as in Fig. 3. The black contours correspond to galaxies in the GSWLC-M2 catalogue (Salim et al. 2018). Star formation rate (SFR) units are in solar masses per year (M⊙ yr−1) and stellar mass (M⋆) in solar masses (M⊙). Five points with very low SFRs are not shown. |
| In the text | |
|
Fig. 9. SDSS-DR17 three-colour images of three selected SIT triplets as an example of systems with interacting galaxies (image scale 0.215″ pixel−1), and one selected triplet as an example of a relaxed galaxy triplet (image scale 1.067″ pixel−1). Upper left panel: SIT 133 (TCE triplet). Upper right panel: SIT 263 (TCE triplet). Lower left panel: SIT 45 (TL triplet). Lower right panel: SIT 190 (TE triplet), a relaxed isolated triplet with Qtrip = −2.72 and H0tc = 0.16. Since the scale is larger to cover the full triplet, a line has been added for an easier identification of the B and C galaxies and to avoid confusion with background and foreground galaxies. |
| In the text | |
|
Fig. 10. Crossing time vs tidal strength, zoomed in on the area from Qtrip > −3 for better visualisation. Symbol style indicates the morphology of the triplet where the galaxy corresponds, as in Fig. 3. Grey dots represent the full sample of triplets, while blue dots represent galaxies showing signs of interaction, green dots represent galaxies showing slight signs of interaction, and red dots represent galaxies with strong signs of interaction. The blue shaded area represents systems that may have a level of interaction of all types from −2 < Qtrip < −0.45, while the green area represents mergers or ongoing merger types from Qtrip > −0.45. Three example cases are indicated (black squares): SIT 263, SIT 45, SIT 133. |
| In the text | |
|
Fig. 11. Global SFR for SIT triplet vs. stellar mass ratio. Upper panel: global SFR vs. mass ratio of the B galaxy with respect to the A galaxy (M⋆, B/M⋆, A). Lower panel: global SFR vs. mass ratio of the C galaxy with respect to the A galaxy (M⋆, C/M⋆, A). The morphological categories represented in the legend are as follows: blue diamonds correspond to triplets with three late-type galaxies (TL), green unfilled stars to triplets with two late-type galaxies (with the central late-type galaxy) and one early-type (TCLl), green stars to triplets with the central late-type galaxy and two early-type galaxies (TCLe), unfilled orange crosses to triplets with two late-type galaxies and the central early-type (TCEl), orange diamonds to triplets with two early-type galaxies (with the central early-type galaxy) and one late-type (TCEe), and red triangles to triplets with three elliptical galaxies (TE). |
| In the text | |
Current usage metrics show cumulative count of Article Views (full-text article views including HTML views, PDF and ePub downloads, according to the available data) and Abstracts Views on Vision4Press platform.
Data correspond to usage on the plateform after 2015. The current usage metrics is available 48-96 hours after online publication and is updated daily on week days.
Initial download of the metrics may take a while.