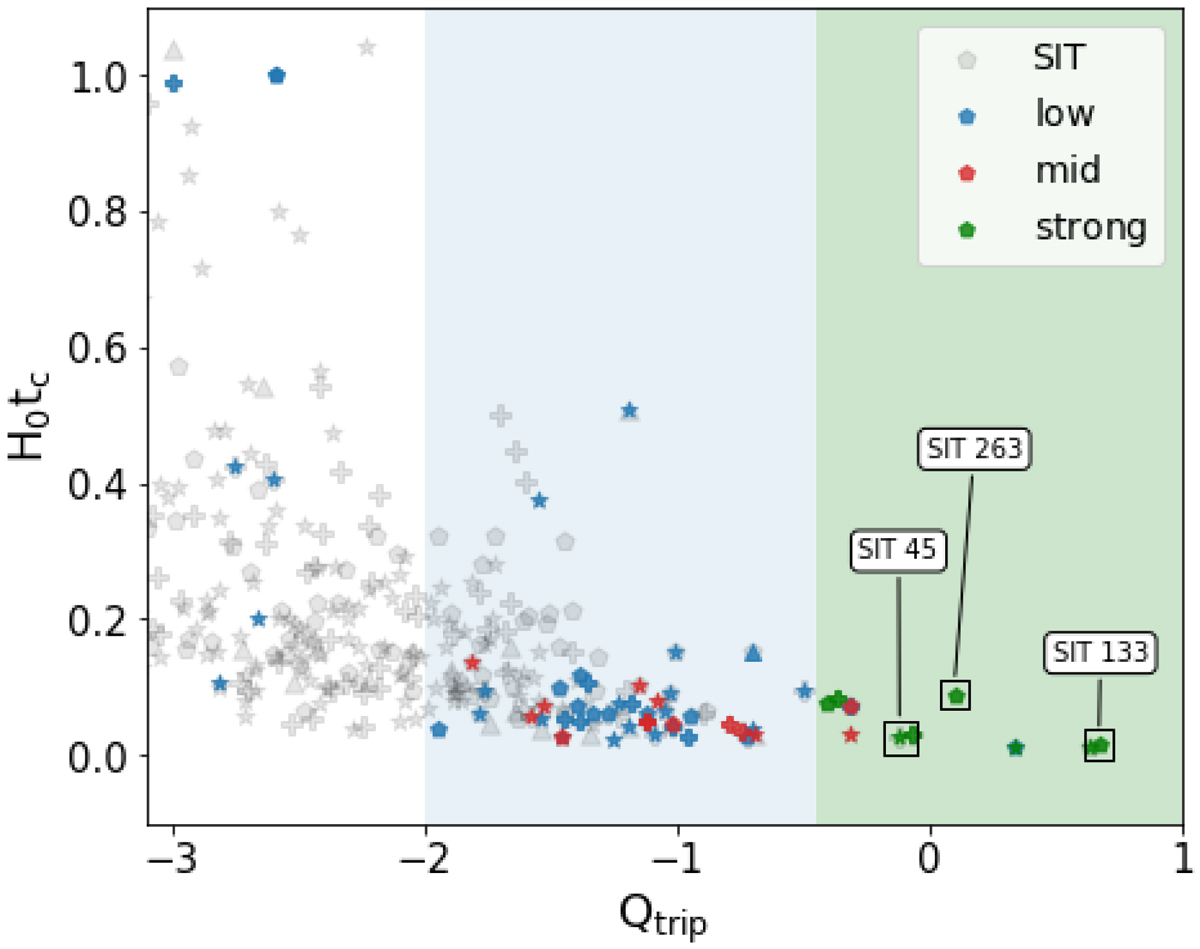
Fig. 10.

Download original image
Crossing time vs tidal strength, zoomed in on the area from Qtrip > −3 for better visualisation. Symbol style indicates the morphology of the triplet where the galaxy corresponds, as in Fig. 3. Grey dots represent the full sample of triplets, while blue dots represent galaxies showing signs of interaction, green dots represent galaxies showing slight signs of interaction, and red dots represent galaxies with strong signs of interaction. The blue shaded area represents systems that may have a level of interaction of all types from −2 < Qtrip < −0.45, while the green area represents mergers or ongoing merger types from Qtrip > −0.45. Three example cases are indicated (black squares): SIT 263, SIT 45, SIT 133.
Current usage metrics show cumulative count of Article Views (full-text article views including HTML views, PDF and ePub downloads, according to the available data) and Abstracts Views on Vision4Press platform.
Data correspond to usage on the plateform after 2015. The current usage metrics is available 48-96 hours after online publication and is updated daily on week days.
Initial download of the metrics may take a while.


