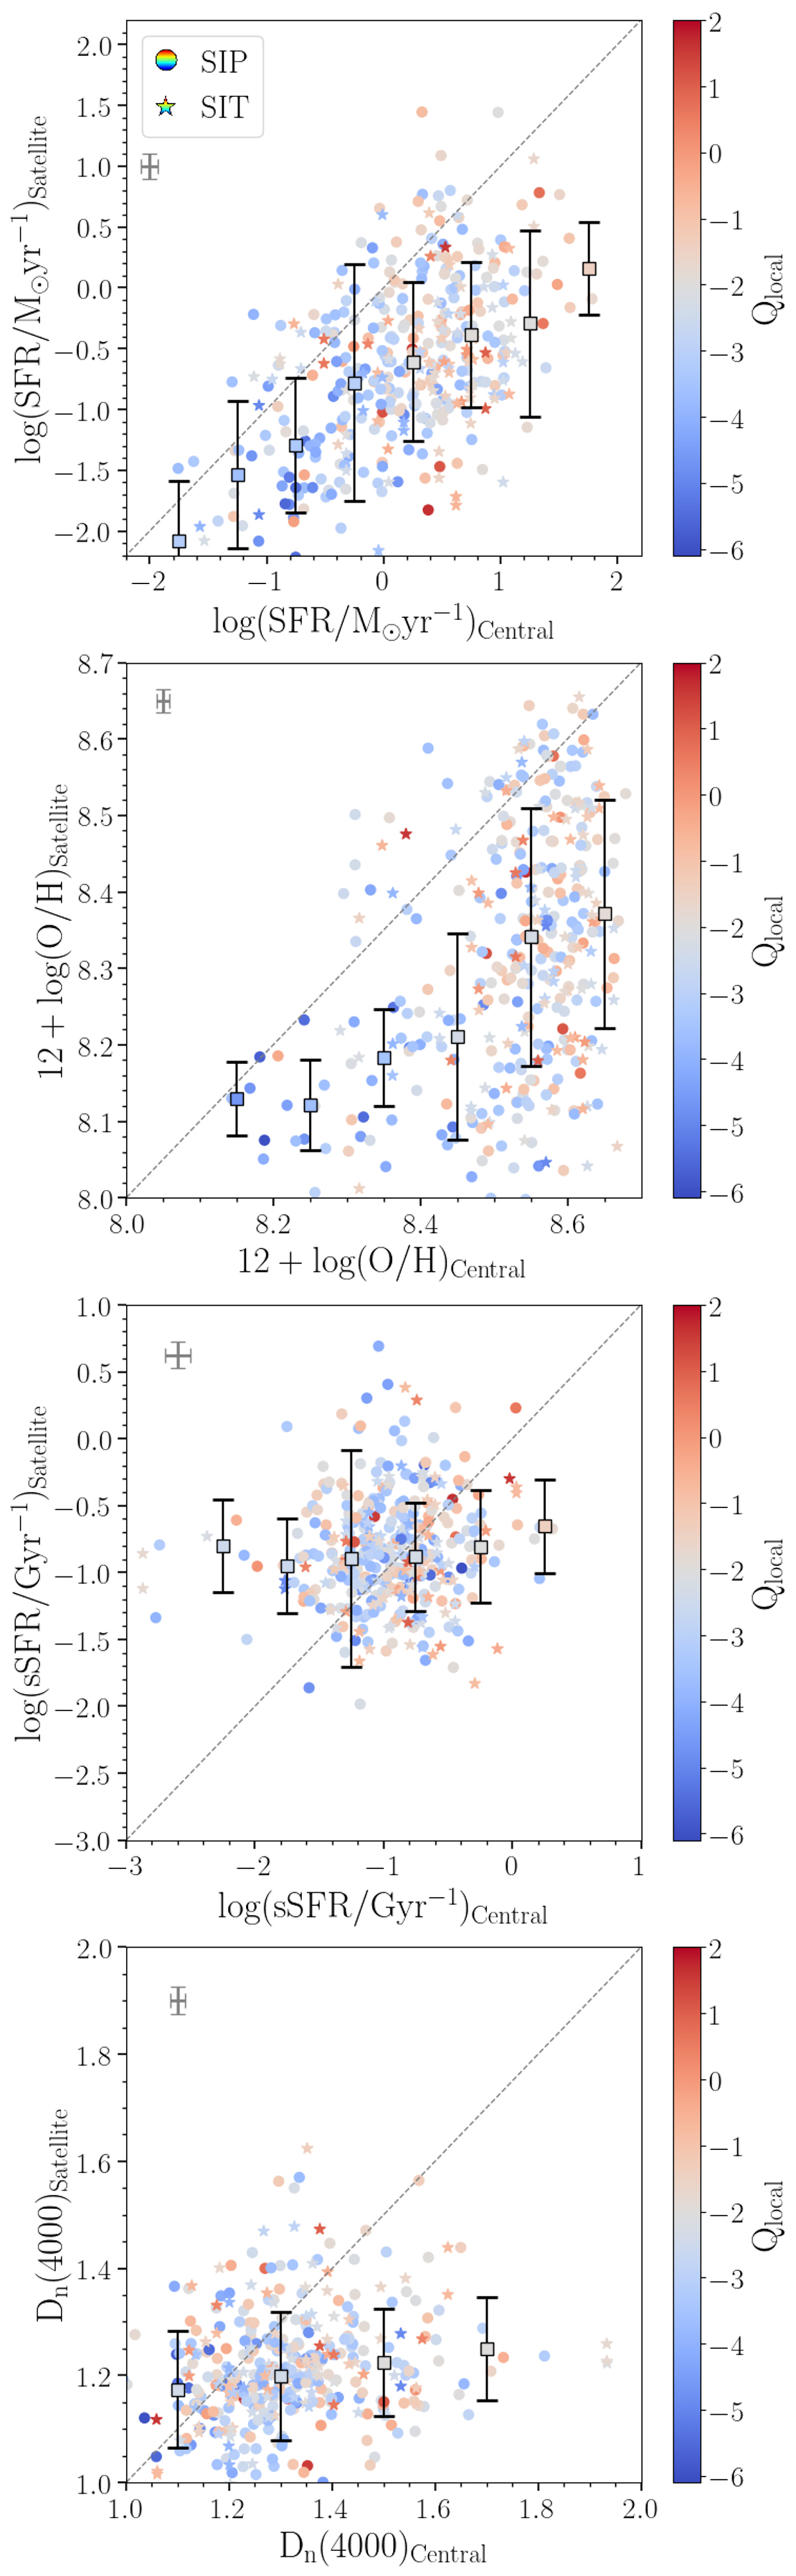
Fig. 8.
Download original image
Galactic conformity on the SFR, 12 + log(O/H), sSFR, and Dn(4000) for SF galaxies, coloured by the local tidal strength affecting the central galaxies in the isolated pairs (circles) and isolated triplets (stars). Upper panel: the SFR of the central galaxy versus the SFR of the satellite galaxy. Second panel: 12 + log(O/H) of the central galaxy versus 12 + log(O/H) of the satellite galaxy. Third panel: sSFR of the central galaxy, versus the sSFR of the satellite galaxy. Lower panel: Dn(4000) of the central galaxy versus Dn(4000) of the satellite galaxy. Grey dashed line is 1:1 relationship. Squares and error bars represent the median trend (coloured according to the colour bar) and dispersion, respectively, in three bins of the SFR, 12 + log(O/H), sSFR, and Dn(4000). In the upper left on each panel we present a representative error, given by the median value of the error of the property in each panel for central and satellite galaxies. The median value of the uncertainties of the SFR is multiplied by 10 for better visualisation.
Current usage metrics show cumulative count of Article Views (full-text article views including HTML views, PDF and ePub downloads, according to the available data) and Abstracts Views on Vision4Press platform.
Data correspond to usage on the plateform after 2015. The current usage metrics is available 48-96 hours after online publication and is updated daily on week days.
Initial download of the metrics may take a while.