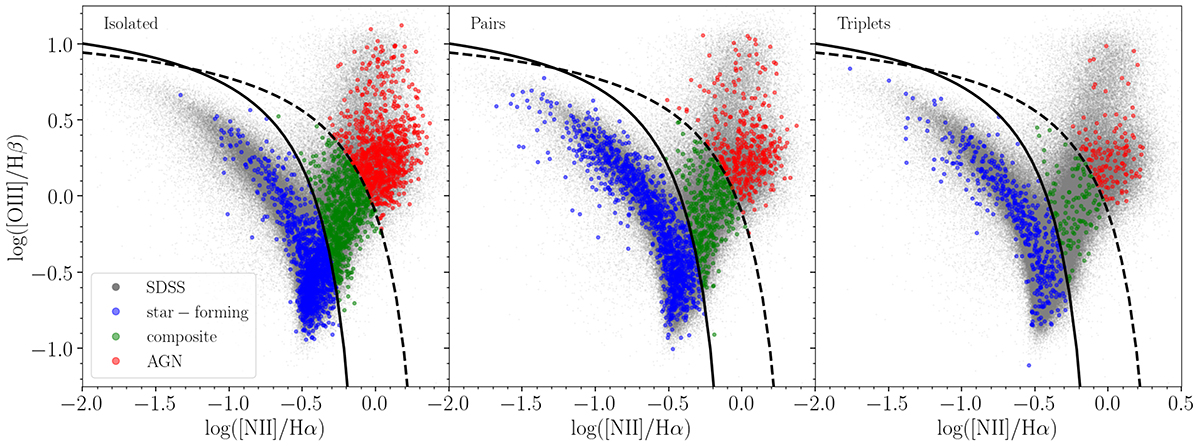
Fig. 1.
Download original image
[O III]λ 5007/Hβ versus [N II]λ 6583/Hα diagnostic diagram (BPT) for isolated galaxies (left panel), galaxies in isolated pairs (middle panel), and galaxies in isolated triplets (right panel). In each panel, blue, green, and red points represent SF galaxies, composite galaxies, and AGN galaxies, respectively. Grey points show the position in the BPT diagram of the SDSS galaxies in the MPA-JHU catalogue. The dashed line shows the Kewley et al. (2001) demarcation and the continuous line shows the Kauffmann et al. (2003b) curve.
Current usage metrics show cumulative count of Article Views (full-text article views including HTML views, PDF and ePub downloads, according to the available data) and Abstracts Views on Vision4Press platform.
Data correspond to usage on the plateform after 2015. The current usage metrics is available 48-96 hours after online publication and is updated daily on week days.
Initial download of the metrics may take a while.