Fig. 10.
Download original image
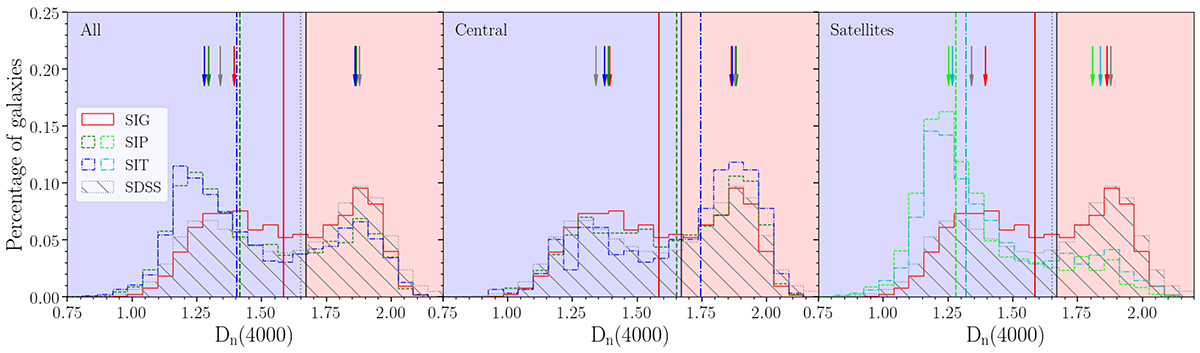
Distributions of the Dn(4000) for all galaxies (SF, composite, and AGN), following the format in Fig. 4. Vertical lines indicate the median values for all the galaxies in each sample, with the respective colour and line style according to the legend. Arrows indicate the median values when separating into young and old stellar populations (blue and red areas, respectively). The corresponding median values and standard deviations are presented in Table 6.
Current usage metrics show cumulative count of Article Views (full-text article views including HTML views, PDF and ePub downloads, according to the available data) and Abstracts Views on Vision4Press platform.
Data correspond to usage on the plateform after 2015. The current usage metrics is available 48-96 hours after online publication and is updated daily on week days.
Initial download of the metrics may take a while.