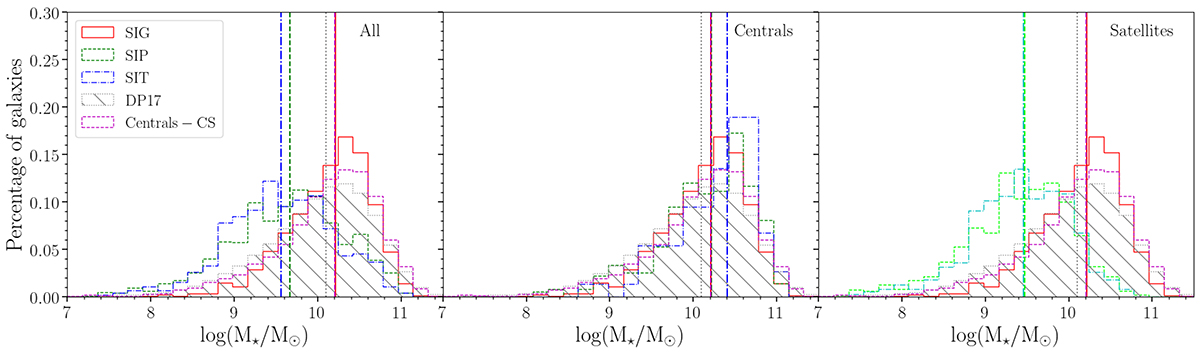
Fig. 2.
Download original image
Distributions of the stellar mass for SF galaxies in the samples used in this work. From left to right: Distributions for all the galaxies (including both central and satellites for isolated pairs and isolated triplets); distributions for isolated and central galaxies in isolated pairs and triplets; and distributions for satellite galaxies in isolated pairs (dash-dotted light-green distribution) and triplets (dash-dotted cyan distribution). The distributions in the first two panels follow line style and colours as indicated in the legend. We note that in the last panel we keep the distribution for isolated galaxies for reference. For reference, we also show the distribution for the DP17 sample, extended for low-mass galaxies (log(M⋆/M⊙) < 8.5) as explained in Sect. 2.3 and the Centrals-CS sample in all the panels. The median values for each subsample of galaxies are indicated by a vertical line, following the respective colour and line style of each distribution. The number of galaxies in each sample, as well as their corresponding median values, standard deviations, mean values and associated errors, are presented in Table 2.
Current usage metrics show cumulative count of Article Views (full-text article views including HTML views, PDF and ePub downloads, according to the available data) and Abstracts Views on Vision4Press platform.
Data correspond to usage on the plateform after 2015. The current usage metrics is available 48-96 hours after online publication and is updated daily on week days.
Initial download of the metrics may take a while.