Fig. 4.
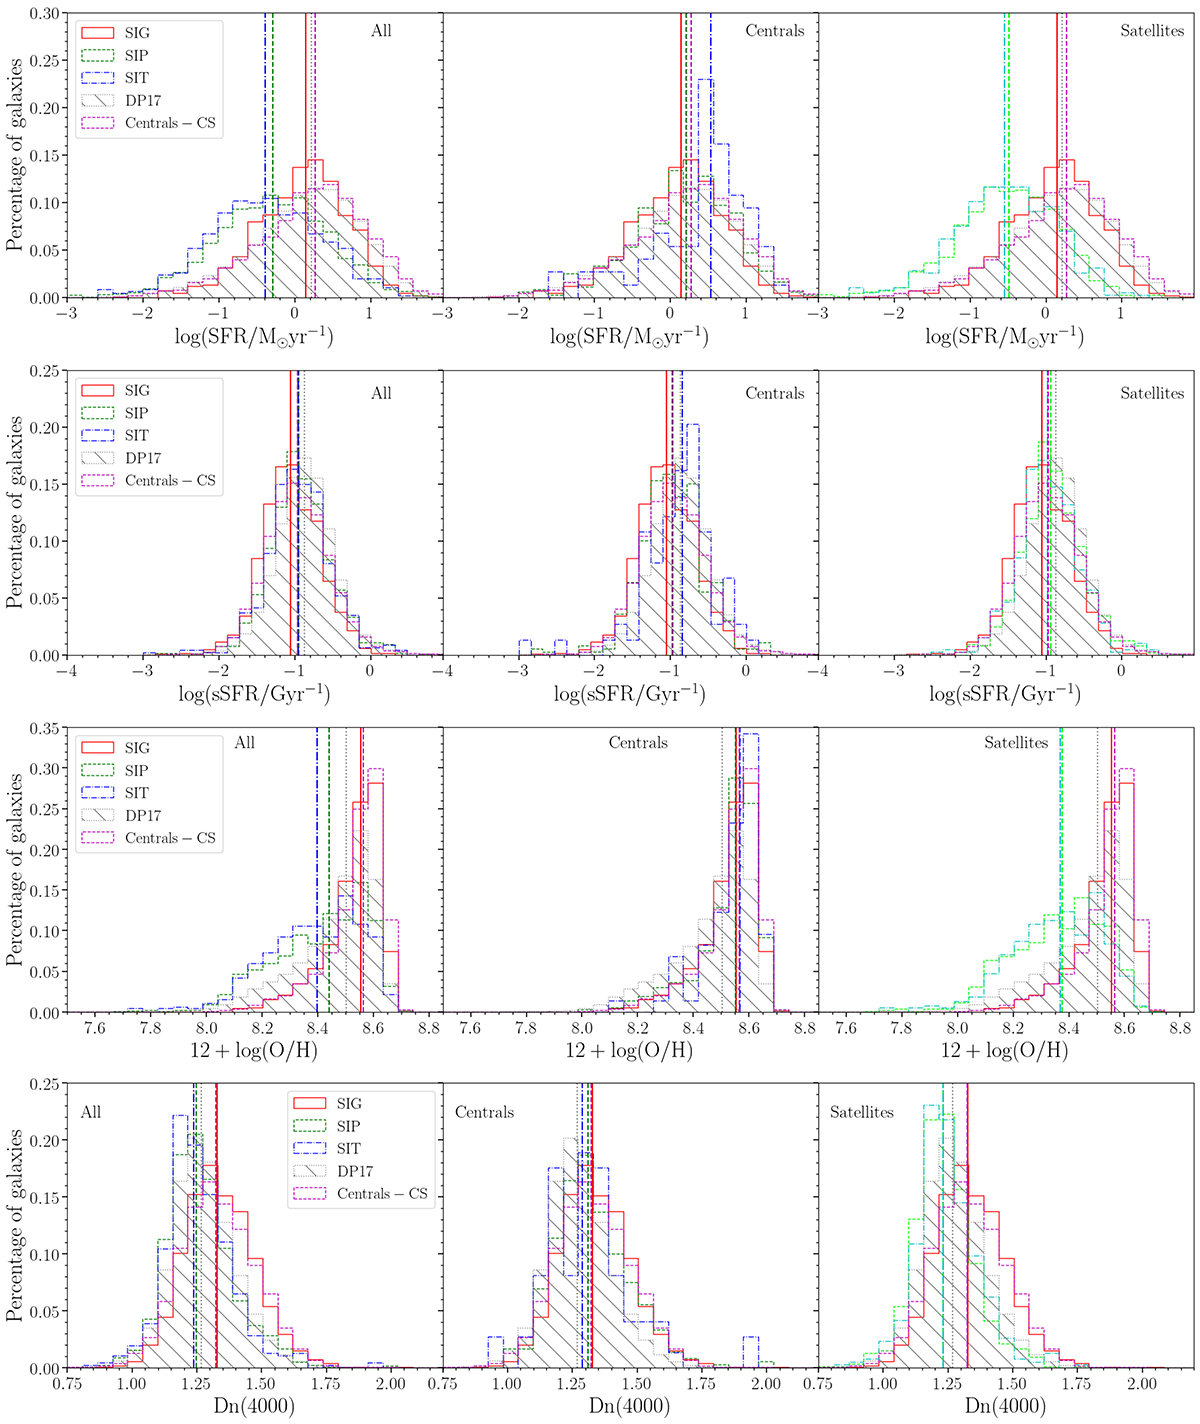
Download original image
Distributions of the SFR, sSFR, oxygen abundance, and Dn(4000), from upper to lower panels, for SF galaxies in the samples used in this work (similar to Fig. 2). The median values for each subsample of galaxies are indicated by a vertical line, following the respective colour and line style of each distribution. The number of galaxies in each sample, as well as their corresponding median values, standard deviations, mean values and associated errors, are presented in Table 2.
Current usage metrics show cumulative count of Article Views (full-text article views including HTML views, PDF and ePub downloads, according to the available data) and Abstracts Views on Vision4Press platform.
Data correspond to usage on the plateform after 2015. The current usage metrics is available 48-96 hours after online publication and is updated daily on week days.
Initial download of the metrics may take a while.