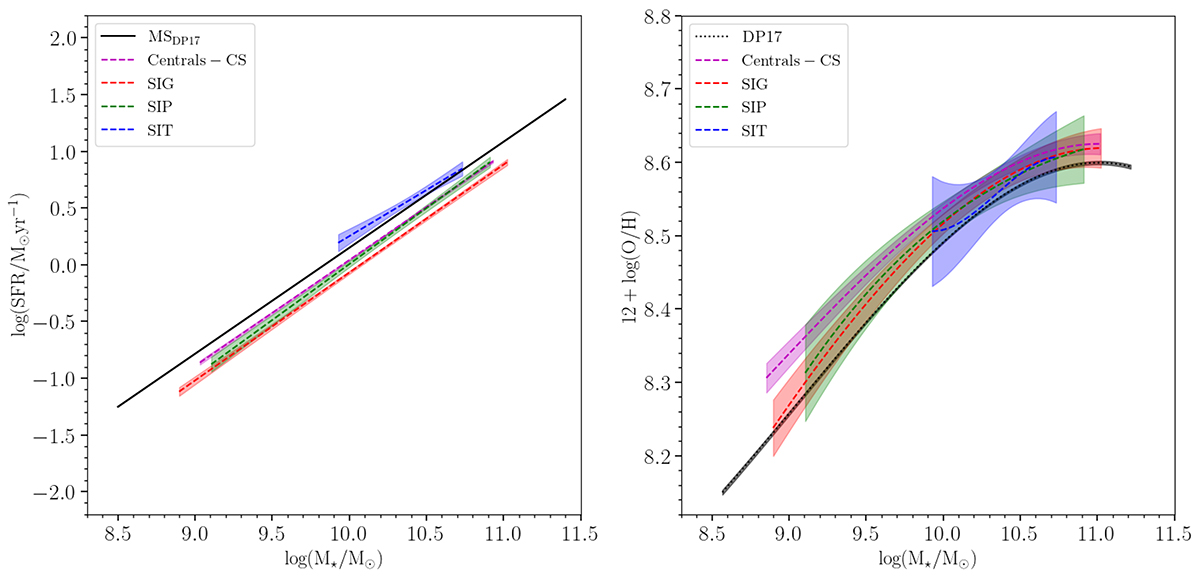
Fig. 5.
Download original image
Relation between the SFR and M⋆ (left panel) and the 12 + log(O/H) and M⋆ (right panel) for central SF galaxies with 8.5 ≤ log(M⋆/M⊙) ≤ 11.5. The relations are presented as the first and third order fit (respectively) to the running median in both axes. The relations for SIG galaxies (red dashed line) and central galaxies in the SIP and SIT (in green and blue dashed lines, respectively) are represented with their corresponding 1σ error. For comparison, we also show the relations for SF galaxies in DP17 and the control sample (black dotted line and grey dashed line, respectively). The number of galaxies considered in bin for each sample, as well as the parameters of the fits with their corresponding uncertainties, are presented in Table 3 and Table 4, respectively.
Current usage metrics show cumulative count of Article Views (full-text article views including HTML views, PDF and ePub downloads, according to the available data) and Abstracts Views on Vision4Press platform.
Data correspond to usage on the plateform after 2015. The current usage metrics is available 48-96 hours after online publication and is updated daily on week days.
Initial download of the metrics may take a while.